

Dogecoin (DOGE) has maintained its position near the $0.077 horizontal support level since the year began. Analysis of both daily and six-hour time frames, along with RSI readings, suggests a potential downtrend in DOGE’s price. Nevertheless, breaching the resistance trendline might trigger a rebound, defying bearish expectations.
ドージコイン(DOGE)は年初以来、0.077ドルの水平サポートレベル付近のポジションを維持している。日足と6時間足の両方の時間枠とRSIの測定値の分析は、DOGE価格の潜在的な下降傾向を示唆しています。それにもかかわらず、レジスタンストレンドラインを突破すると、弱気の予想に反して反発が起こる可能性があります。

Cryptos Headlines Platform Has Launched Its Native Token's Airdrop for the Public Join Airdrop Now
Cryptos Headlines プラットフォームが一般向けにネイティブ トークンの Airdrop を開始しました 今すぐ Airdrop に参加してください
DOGE price is currently trading within a long-term corrective pattern and a short-term bearish trend. It has revisited a horizontal support zone established since the beginning of the year. The critical question remains: will it bounce off this support level or break down?
DOGE価格は現在、長期的な調整パターンと短期的な弱気トレンドの範囲内で取引されています。今年初めから設置された水平的な支援ゾーンを再検討した。重要な疑問は残る:このサポートレベルから反発するのか、それとも崩壊するのか?
Dogecoin (DOGE) Technical Analysis
The daily time frame analysis reveals a downward trajectory in DOGE’s price since its peak at $0.107 on December 11, 2023. This decline occurred within the confines of an ascending parallel channel that had been in place since June 2023.
ドージコイン (DOGE) テクニカル分析毎日の時間枠分析により、2023 年 12 月 11 日の 0.107 ドルでのピーク以来、DOGE 価格が下降軌道を描いていることが明らかになります。この下落は、2023 年 6 月以来存在していた上昇平行チャネルの範囲内で発生しました。
Although Dogecoin experienced a rebound at the midline of this pattern, it faced rejection twice at the resistance trend line, marked by red icons on January 11 and 21, 2024, respectively. Currently, DOGE is trading near the midline of the channel.
ドージコインはこのパターンの正中線で反発を経験しましたが、2024年1月11日と21日にそれぞれ赤いアイコンでマークされたレジスタンストレンドラインで2回拒絶に直面しました。現在、DOGEはチャネルの正中線付近で取引されています。
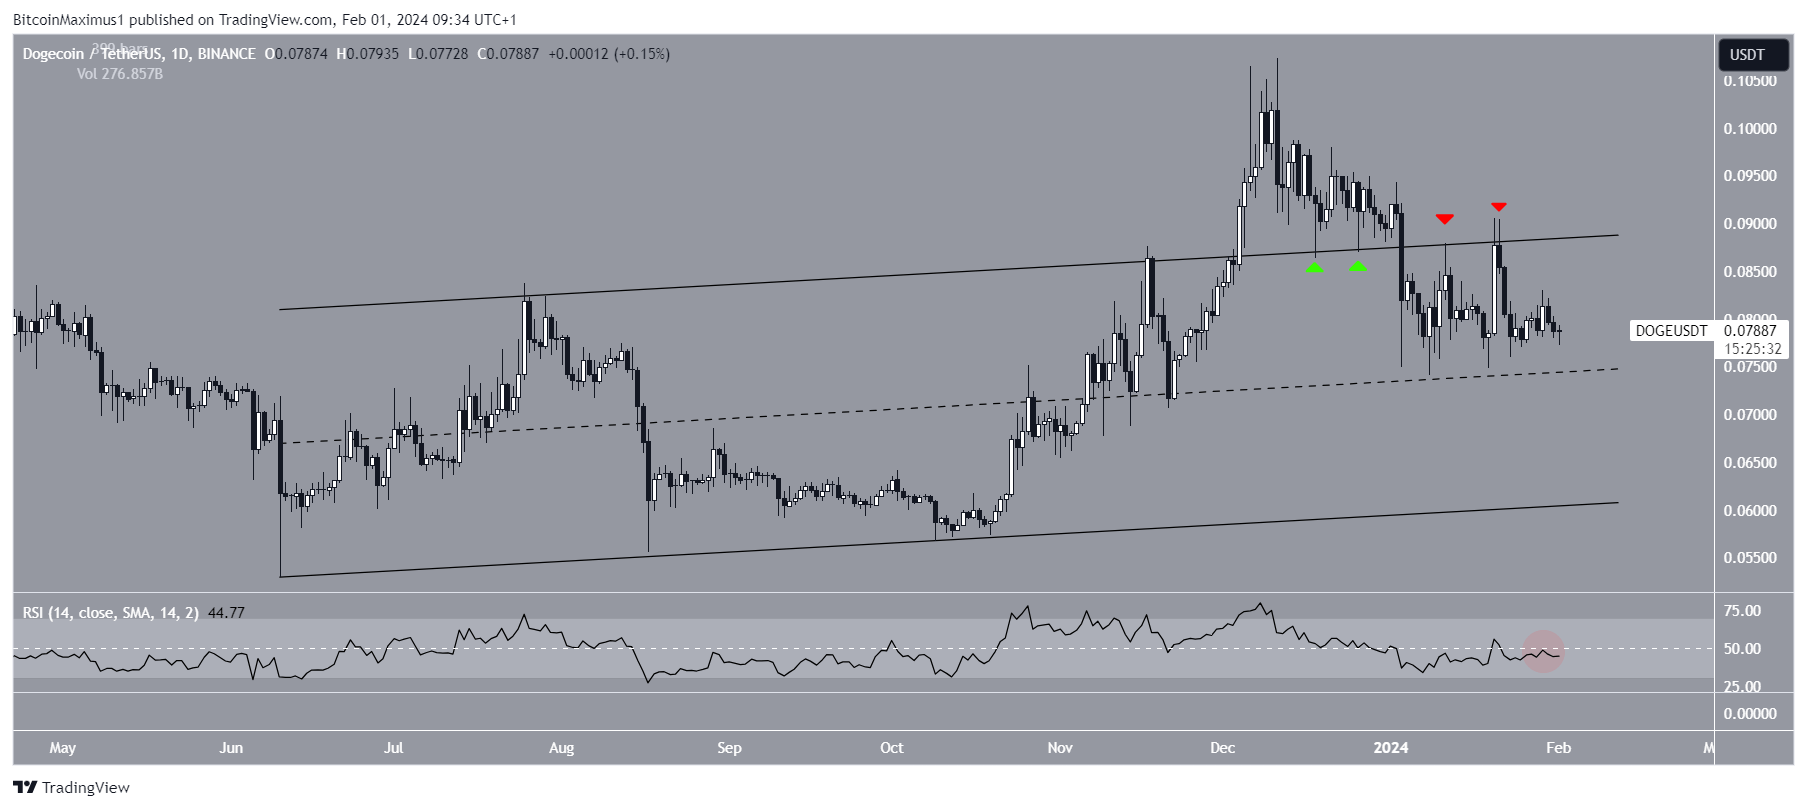
DOGE/USDT Daily Chart. Source: TradingView
DOGE/USDTの日足チャート。出典: TradingView
In terms of momentum, the daily Relative Strength Index (RSI) provides a bearish indication. The RSI, a key momentum indicator used by traders to assess market conditions, suggests whether an asset is overbought or oversold, informing decisions to buy or sell.
勢いの点では、日次相対力指数 (RSI) が弱気の兆候を示しています。トレーダーが市況を評価するために使用する主要なモメンタム指標である RSI は、資産が買われすぎか売られすぎかを示唆し、売買の決定に役立ちます。
Cryptos Headlines Platform Has Launched Its Native Token's Airdrop for the Public Join Airdrop Now
Cryptos Headlines プラットフォームが一般向けにネイティブ トークンの Airdrop を開始しました 今すぐ Airdrop に参加してください
With readings above 50 and an upward trend indicating a bullish market sentiment, readings below 50 signal the opposite. Presently, the RSI sits below 50 (highlighted by a red circle), indicative of a bearish trend in DOGE’s price.
50 を超える測定値と上昇傾向は強気の市場センチメントを示し、50 を下回る測定値はその逆を示します。現在、RSI は 50 を下回っており (赤い丸で強調表示されています)、DOGE 価格の弱気傾向を示しています。
Also Read: Ripple Co-Founder: Hold XRP; Avoid Selling Below $10000
こちらもお読みください: リップル共同創設者: XRP を保持。 10000ドル以下での販売は避ける
Dogecoin (DOGE) Six-Hour Time Frame Analysis
On the six-hour time frame, Dogecoin (DOGE) has been tracking beneath a descending resistance trend line since December 2023. This trend line, coupled with the $0.077 horizontal support level, has formed a descending triangle pattern, typically considered bearish.
ドージコイン (DOGE) 6 時間足分析6 時間足では、ドージコイン (DOGE) は 2023 年 12 月以来、下降抵抗トレンドラインの下を追跡しています。このトレンドラインは、0.077 ドルの水平サポートレベルと相まって、下降抵抗線を形成しています。トライアングルパターン、通常は弱気とみなされます。
Cryptos Headlines Platform Has Launched Its Native Token's Airdrop for the Public Join Airdrop Now
Cryptos Headlines プラットフォームが一般向けにネイティブ トークンの Airdrop を開始しました 今すぐ Airdrop に参加してください
Currently, DOGE hovers just above this crucial support area, while the Relative Strength Index (RSI) has dipped below the 50 mark (indicated by a red circle). A breakdown below this support level could potentially lead to a significant 27% decline, targeting the nearest support at $0.057.
現在、DOGE はこの重要なサポート領域のすぐ上を推移していますが、相対強度指数 (RSI) は 50 マークを下回っています (赤い円で示されています)。このサポートレベルを下回ると、27%の大幅な下落につながる可能性があり、最も近いサポートである0.057ドルが目標となります。
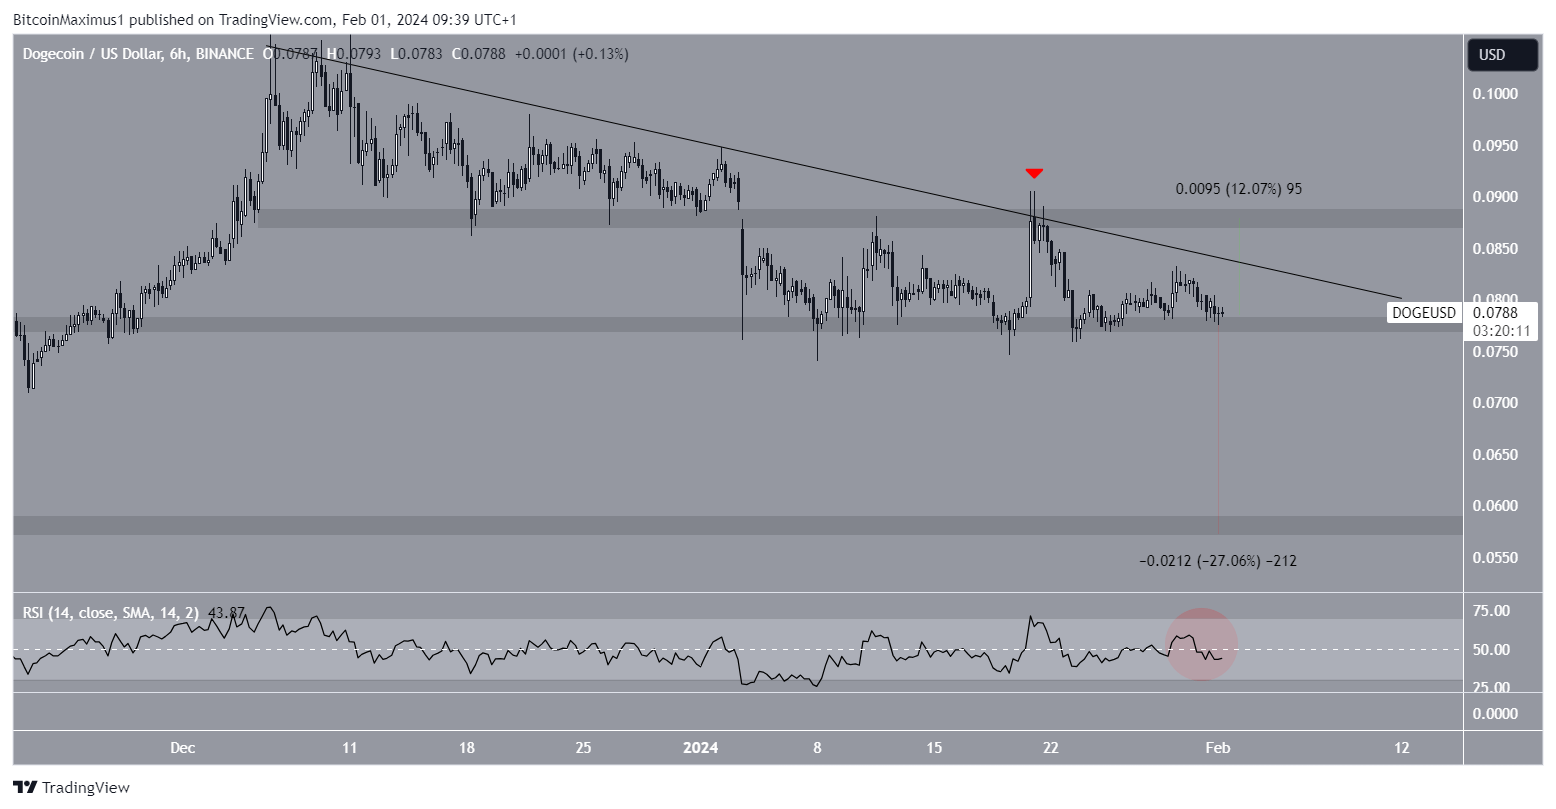
DOGE/USDT Six-Hour Chart. Source: TradingView
DOGE/USDTの6時間足チャート。出典: TradingView
However, despite the bearish outlook, a robust rebound from the $0.077 support zone could catalyze a breakout from the resistance trend line. This breakout scenario could prompt a 12% upswing, aiming for the next resistance level at $0.087.
しかし、弱気の見通しにもかかわらず、0.077ドルのサポートゾーンからの力強い反発は、レジスタンストレンドラインからのブレイクアウトを引き起こす可能性があります。このブレイクアウトシナリオは12%の上昇を促し、次の抵抗線である0.087ドルを目指す可能性がある。
Important: Please note that this article is only meant to provide information and should not be taken as legal, tax, investment, financial, or any other type of advice.
重要: この記事は情報提供のみを目的としており、法律、税金、投資、財務、その他の種類のアドバイスとして受け取られるべきではないことに注意してください。
 Optimisus
 Optimisus
 DeFi Planet
 Crypto Daily™
 BlockchainReporter
 TheCoinrise Media
 DogeHome
 Crypto Daily™
 Crypto Daily™


