

Dogecoin (DOGE) has maintained its position near the $0.077 horizontal support level since the year began. Analysis of both daily and six-hour time frames, along with RSI readings, suggests a potential downtrend in DOGE’s price. Nevertheless, breaching the resistance trendline might trigger a rebound, defying bearish expectations.
Dogecoin(DOGE)은 연초부터 $0.077 수평 지지 수준 근처의 위치를 유지해 왔습니다. RSI 수치와 함께 일일 및 6시간 단위 분석을 통해 DOGE 가격의 잠재적인 하락 추세를 시사합니다. 그럼에도 불구하고 저항 추세선을 돌파하면 하락세 예상을 깨고 반등을 촉발할 수 있습니다.

Cryptos Headlines Platform Has Launched Its Native Token's Airdrop for the Public Join Airdrop Now
Cryptos Headlines 플랫폼은 이제 공개 참여를 위한 기본 토큰 에어드롭을 출시했습니다.
DOGE price is currently trading within a long-term corrective pattern and a short-term bearish trend. It has revisited a horizontal support zone established since the beginning of the year. The critical question remains: will it bounce off this support level or break down?
DOGE 가격은 현재 장기 조정 패턴과 단기 약세 추세 내에서 거래되고 있습니다. 연초부터 구축한 수평적 지원지대를 재검토했다. 중요한 질문은 여전히 남아 있습니다. 이 지지 수준에서 벗어날 것인가, 아니면 붕괴될 것인가?
Dogecoin (DOGE) Technical Analysis
The daily time frame analysis reveals a downward trajectory in DOGE’s price since its peak at $0.107 on December 11, 2023. This decline occurred within the confines of an ascending parallel channel that had been in place since June 2023.
Dogecoin(DOGE) 기술 분석일별 시간대 분석에서는 2023년 12월 11일 $0.107로 정점을 찍은 이후 DOGE 가격의 하락 궤적을 보여줍니다. 이러한 하락은 2023년 6월 이후 진행된 상승 병렬 채널의 범위 내에서 발생했습니다.
Although Dogecoin experienced a rebound at the midline of this pattern, it faced rejection twice at the resistance trend line, marked by red icons on January 11 and 21, 2024, respectively. Currently, DOGE is trading near the midline of the channel.
Dogecoin은 이 패턴의 중간선에서 반등을 경험했지만 각각 2024년 1월 11일과 21일에 빨간색 아이콘으로 표시된 저항 추세선에서 두 번 거부에 직면했습니다. 현재 DOGE는 채널 중앙선 근처에서 거래되고 있습니다.
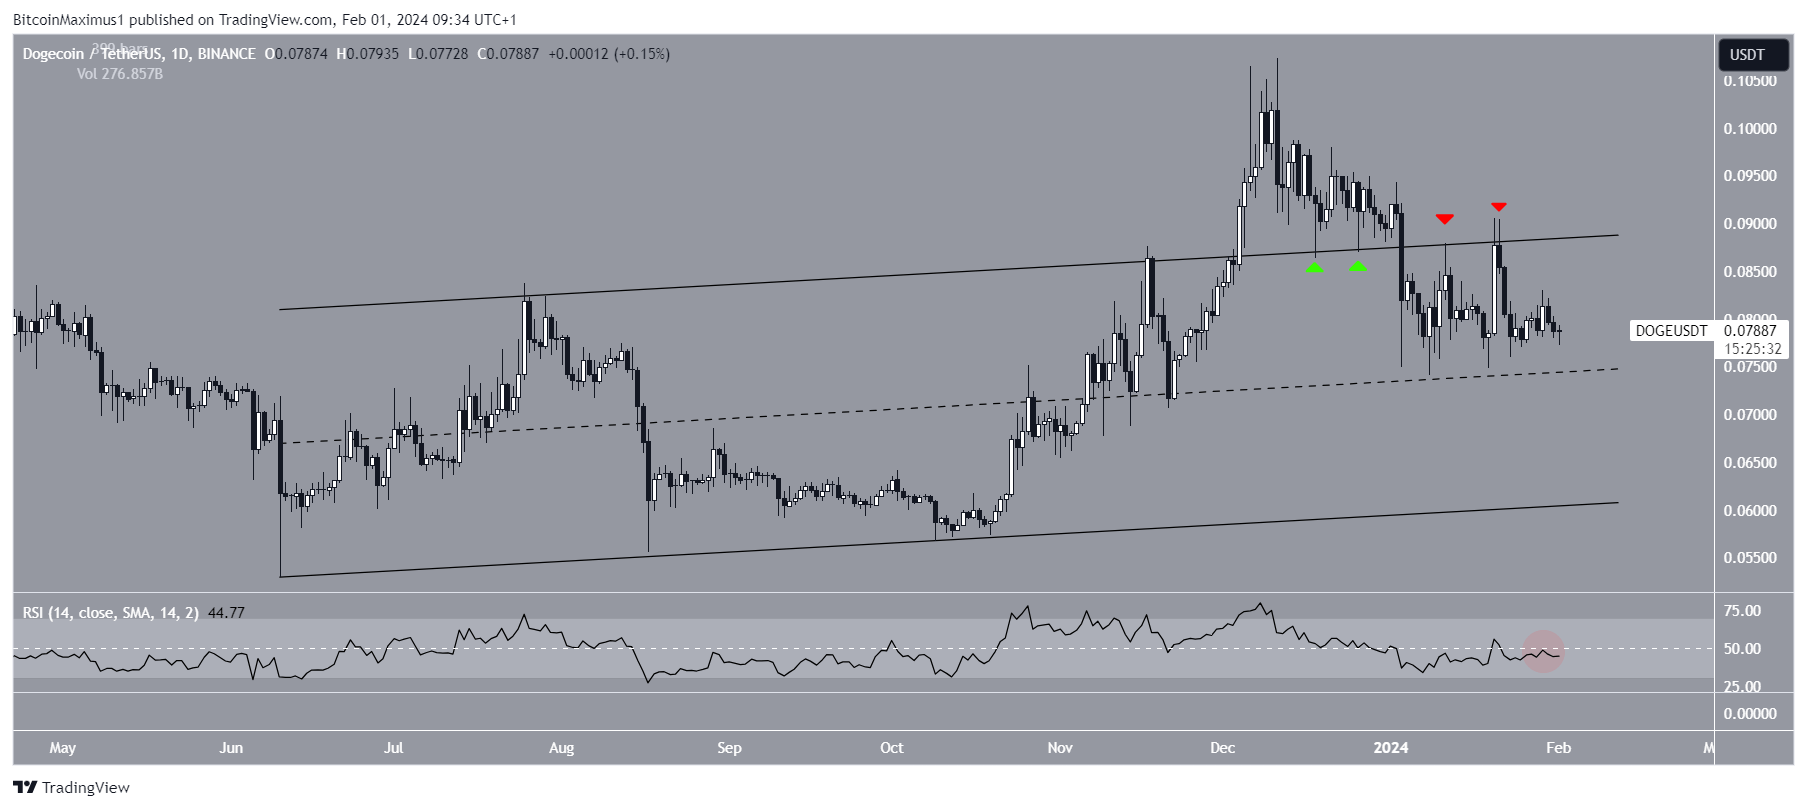
DOGE/USDT Daily Chart. Source: TradingView
DOGE/USDT 일일 차트. 출처: TradingView
In terms of momentum, the daily Relative Strength Index (RSI) provides a bearish indication. The RSI, a key momentum indicator used by traders to assess market conditions, suggests whether an asset is overbought or oversold, informing decisions to buy or sell.
모멘텀 측면에서 일일 상대강도지수(RSI)는 약세를 나타냅니다. 트레이더가 시장 상황을 평가하기 위해 사용하는 주요 모멘텀 지표인 RSI는 자산이 과매수 또는 과매도 상태인지 여부를 제시하여 매수 또는 매도 결정을 알려줍니다.
Cryptos Headlines Platform Has Launched Its Native Token's Airdrop for the Public Join Airdrop Now
Cryptos Headlines 플랫폼은 이제 공개 참여를 위한 기본 토큰 에어드롭을 출시했습니다.
With readings above 50 and an upward trend indicating a bullish market sentiment, readings below 50 signal the opposite. Presently, the RSI sits below 50 (highlighted by a red circle), indicative of a bearish trend in DOGE’s price.
수치가 50 이상이고 상승 추세가 강세 시장 심리를 나타내는 반면, 수치가 50 미만이면 그 반대 신호입니다. 현재 RSI는 50(빨간색 원으로 강조 표시) 아래에 있는데, 이는 DOGE 가격의 약세 추세를 나타냅니다.
Also Read: Ripple Co-Founder: Hold XRP; Avoid Selling Below $10000
또한 읽어보세요: Ripple 공동 창립자: XRP 보유; $10000 미만 판매 피하기
Dogecoin (DOGE) Six-Hour Time Frame Analysis
On the six-hour time frame, Dogecoin (DOGE) has been tracking beneath a descending resistance trend line since December 2023. This trend line, coupled with the $0.077 horizontal support level, has formed a descending triangle pattern, typically considered bearish.
Dogecoin(DOGE) 6시간 프레임 분석 6시간 프레임에서 Dogecoin(DOGE)은 2023년 12월부터 하강 저항 추세선 아래를 추적해 왔습니다. 이 추세선은 $0.077 수평 지지 수준과 결합되어 하강 추세선을 형성했습니다. 일반적으로 약세로 간주되는 삼각형 패턴입니다.
Cryptos Headlines Platform Has Launched Its Native Token's Airdrop for the Public Join Airdrop Now
Cryptos Headlines 플랫폼은 이제 공개 참여를 위한 기본 토큰 에어드롭을 출시했습니다.
Currently, DOGE hovers just above this crucial support area, while the Relative Strength Index (RSI) has dipped below the 50 mark (indicated by a red circle). A breakdown below this support level could potentially lead to a significant 27% decline, targeting the nearest support at $0.057.
현재 DOGE는 이 중요한 지지 영역 바로 위에 맴돌고 있는 반면 상대 강도 지수(RSI)는 50 표시(빨간색 원으로 표시) 아래로 떨어졌습니다. 이 지지 수준 이하로 분류되면 가장 가까운 지지선인 $0.057를 목표로 하여 잠재적으로 27%의 상당한 하락이 발생할 수 있습니다.
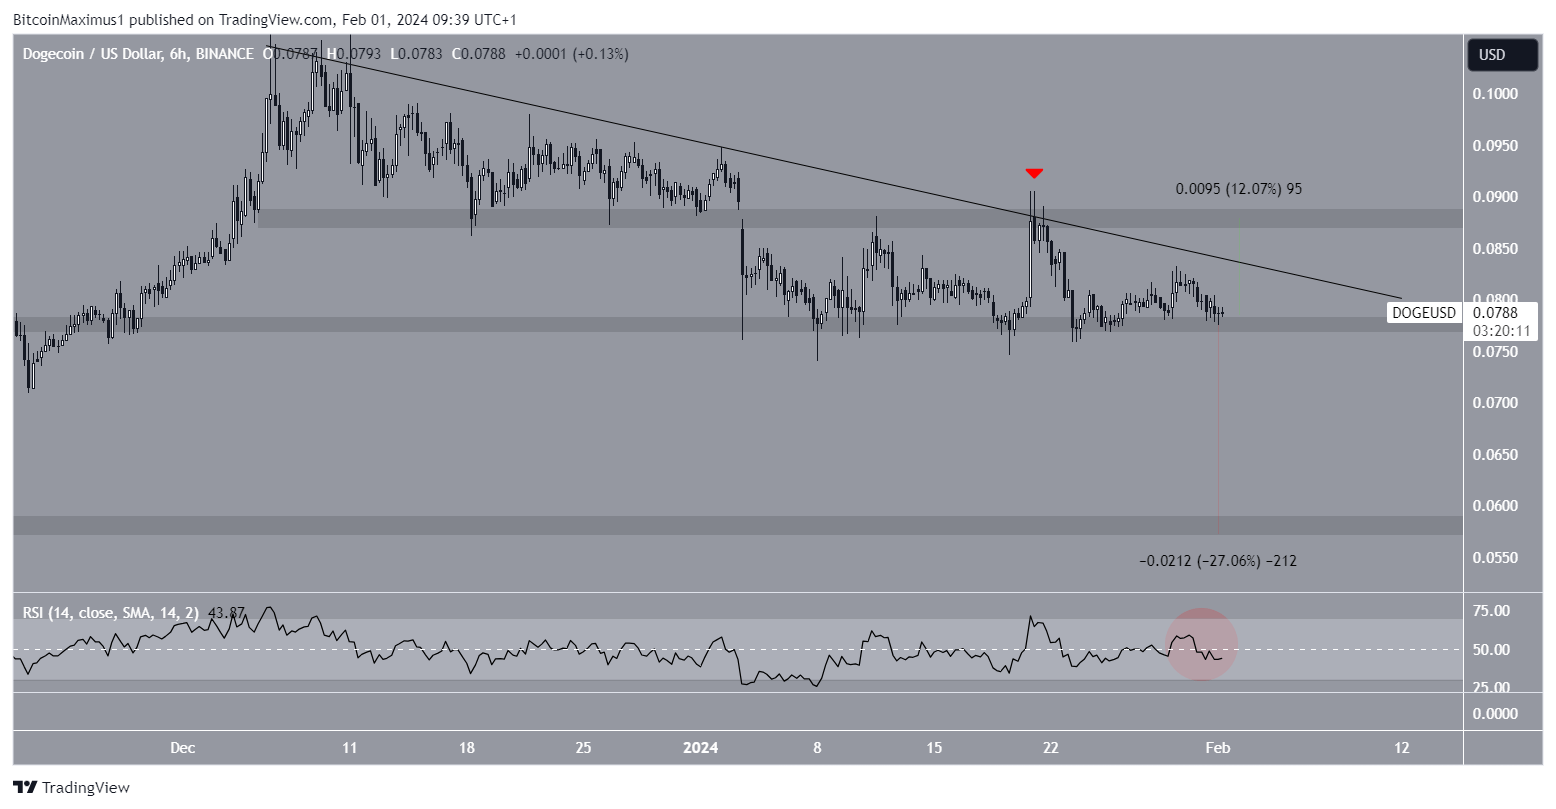
DOGE/USDT Six-Hour Chart. Source: TradingView
DOGE/USDT 6시간 차트. 출처: TradingView
However, despite the bearish outlook, a robust rebound from the $0.077 support zone could catalyze a breakout from the resistance trend line. This breakout scenario could prompt a 12% upswing, aiming for the next resistance level at $0.087.
그러나 약세 전망에도 불구하고 0.077달러 지지대에서 강력한 반등이 이루어지면 저항 추세선의 돌파를 촉진할 수 있습니다. 이 돌파 시나리오는 12% 상승을 촉발하여 다음 저항 수준인 $0.087을 목표로 할 수 있습니다.
Important: Please note that this article is only meant to provide information and should not be taken as legal, tax, investment, financial, or any other type of advice.
중요: 이 문서는 정보 제공만을 목적으로 하며 법률, 세금, 투자, 금융 또는 기타 유형의 조언으로 받아들여서는 안 됩니다.
 DogeHome
 TheCoinrise Media
 Thecoinrepublic.com
 TheCoinrise Media
 TheCoinrise Media
 Cryptopolitan_News
 Coin Edition
 BlockchainReporter


