Análisis de Dogecoin: ¿Qué está pasando en el mercado de Dogecoin?
The cryptocurrency market continues to recover from the effects of the decline that started with the opening of Wall Street. Bitcoin, which fell below the $35,000 level during the day, was trading at $35,043 at the time of writing this article. Of course, many altcoins were also negatively affected by this situation, but buying has started to increase in the altcoin market as well. So, what’s happening in the Dogecoin market? Let’s take a closer look.
El mercado de las criptomonedas continúa recuperándose de los efectos de la caída que comenzó con la apertura de Wall Street. Bitcoin, que cayó por debajo del nivel de 35.000 dólares durante el día, se cotizaba a 35.043 dólares en el momento de escribir este artículo. Por supuesto, muchas altcoins también se vieron afectadas negativamente por esta situación, pero las compras también han comenzado a aumentar en el mercado de altcoins. Entonces, ¿qué está pasando en el mercado de Dogecoin? Miremos más de cerca.
Dogecoin Chart Analysis
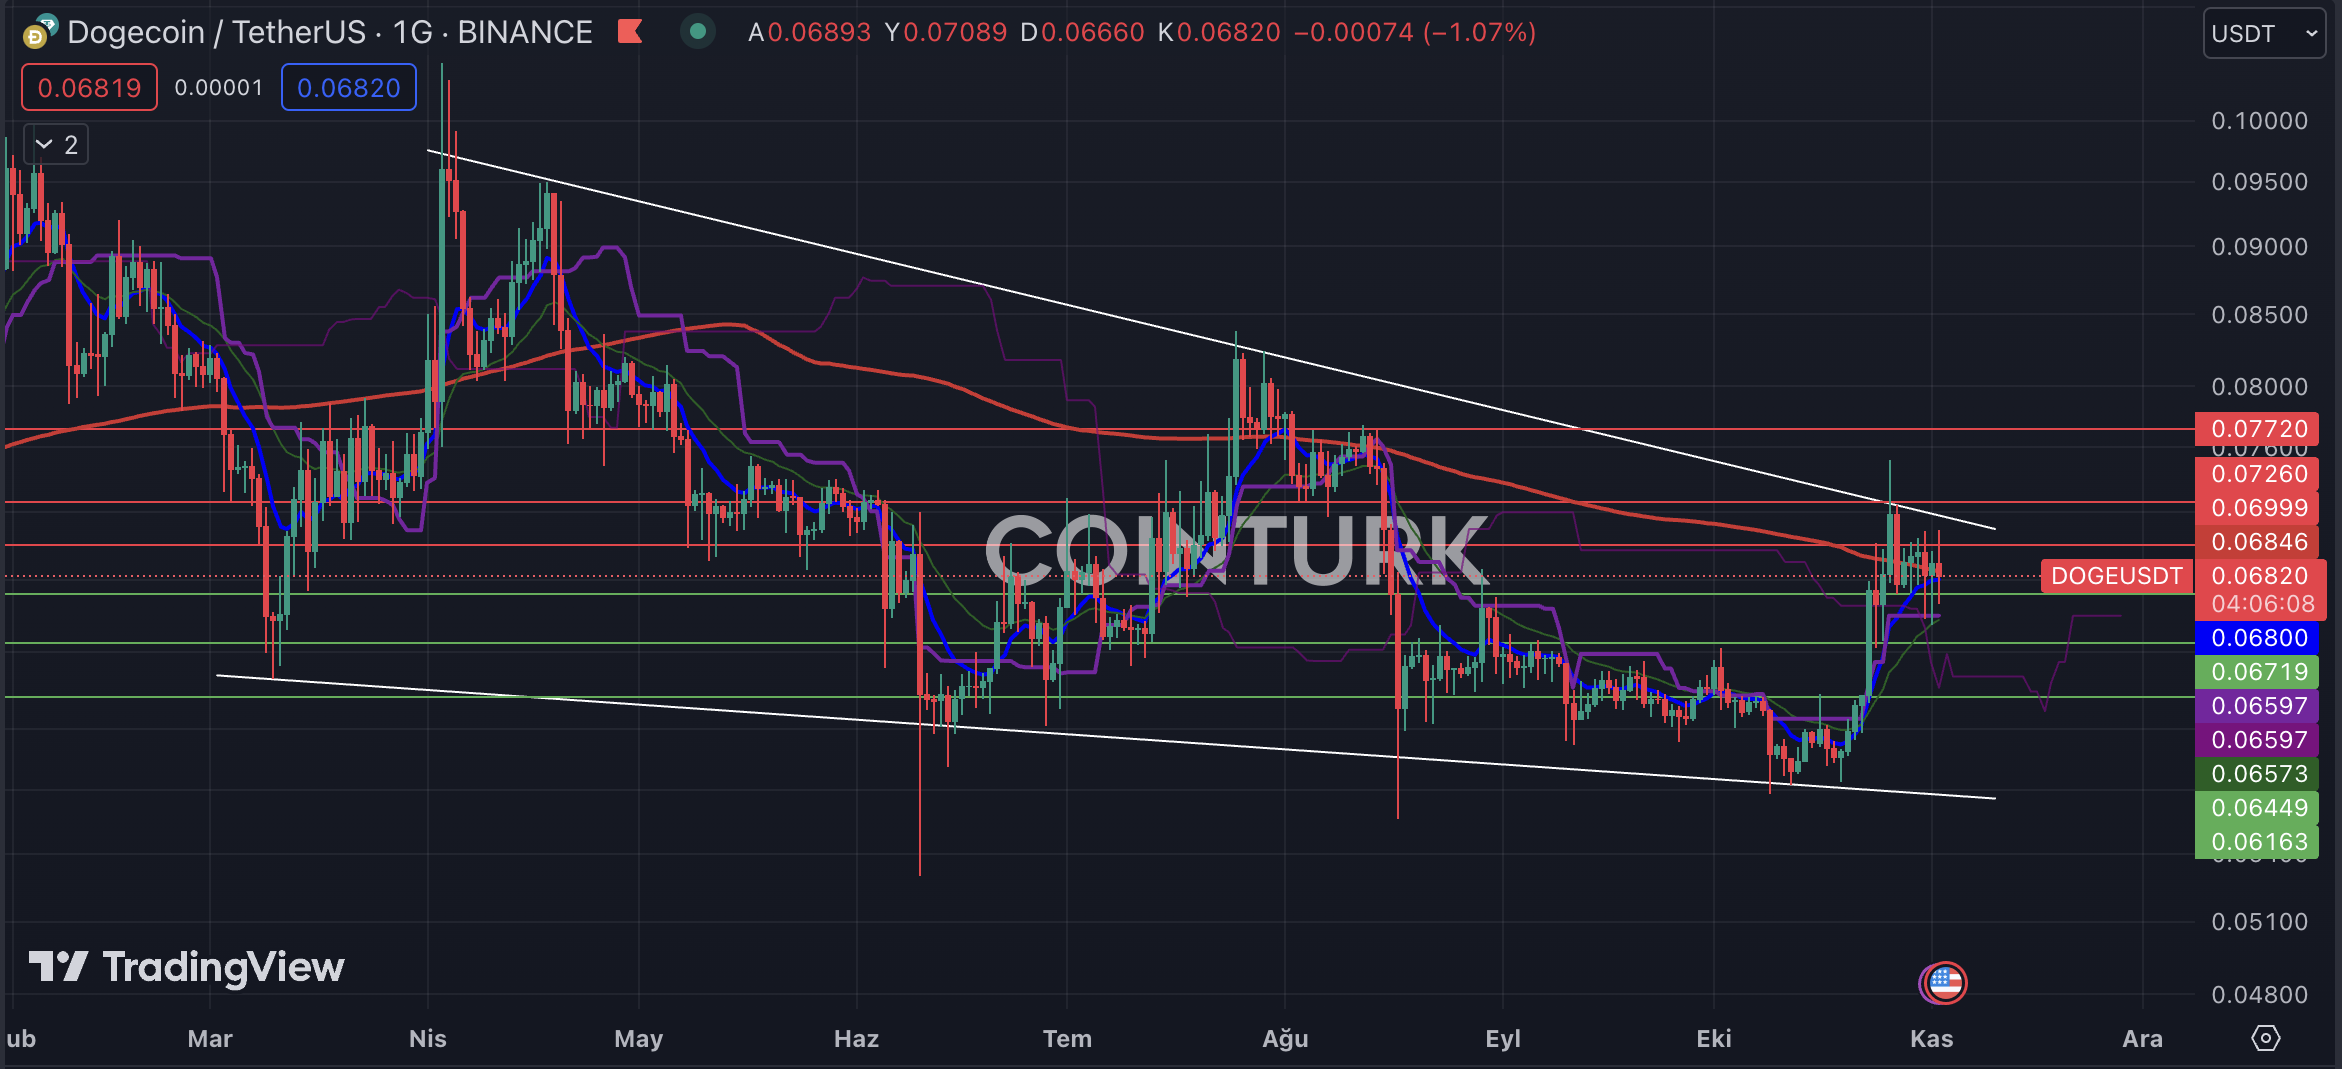
The first notable formation in the daily Dogecoin chart is a descending wedge formation. In this pattern that has been ongoing since March, the DOGE price recently squeezed into a tight range after touching the resistance line. This situation, especially at the EMA 200 (red line) level, may indicate a negative scenario for DOGE.
Análisis del gráfico de Dogecoin La primera formación notable en el gráfico diario de Dogecoin es una formación de cuña descendente. En este patrón que ha estado en curso desde marzo, el precio de DOGE recientemente se redujo a un rango estrecho después de tocar la línea de resistencia. Esta situación, especialmente en el nivel EMA 200 (línea roja), puede indicar un escenario negativo para DOGE.
The support levels to watch for DOGE are respectively $0.06719, $0.06449, and $0.06163. Although it may be difficult to talk about any negative scenarios below these supports, contact with the support line can be expected with a daily bar closing below the $0.06163 level.
Los niveles de soporte a tener en cuenta para DOGE son USD 0,06719, USD 0,06449 y USD 0,06163, respectivamente. Aunque puede ser difícil hablar de escenarios negativos por debajo de estos soportes, se puede esperar un contacto con la línea de soporte con una barra diaria que cierre por debajo del nivel de $0,06163.
The resistance levels to watch for DOGE are respectively $0.06820, $0.07260, and $0.07720. Especially, a daily bar closing above the $0.07260 level will trigger an upward breakout in the descending wedge formation and this will accelerate the rise of DOGE.
Los niveles de resistencia a tener en cuenta para DOGE son, respectivamente, $ 0,06820, $ 0,07260 y $ 0,07720. Especialmente, una barra diaria que cierre por encima del nivel de $ 0,07260 desencadenará una ruptura alcista en la formación de cuña descendente y esto acelerará el ascenso de DOGE.

DOGE/ETH Chart Analysis
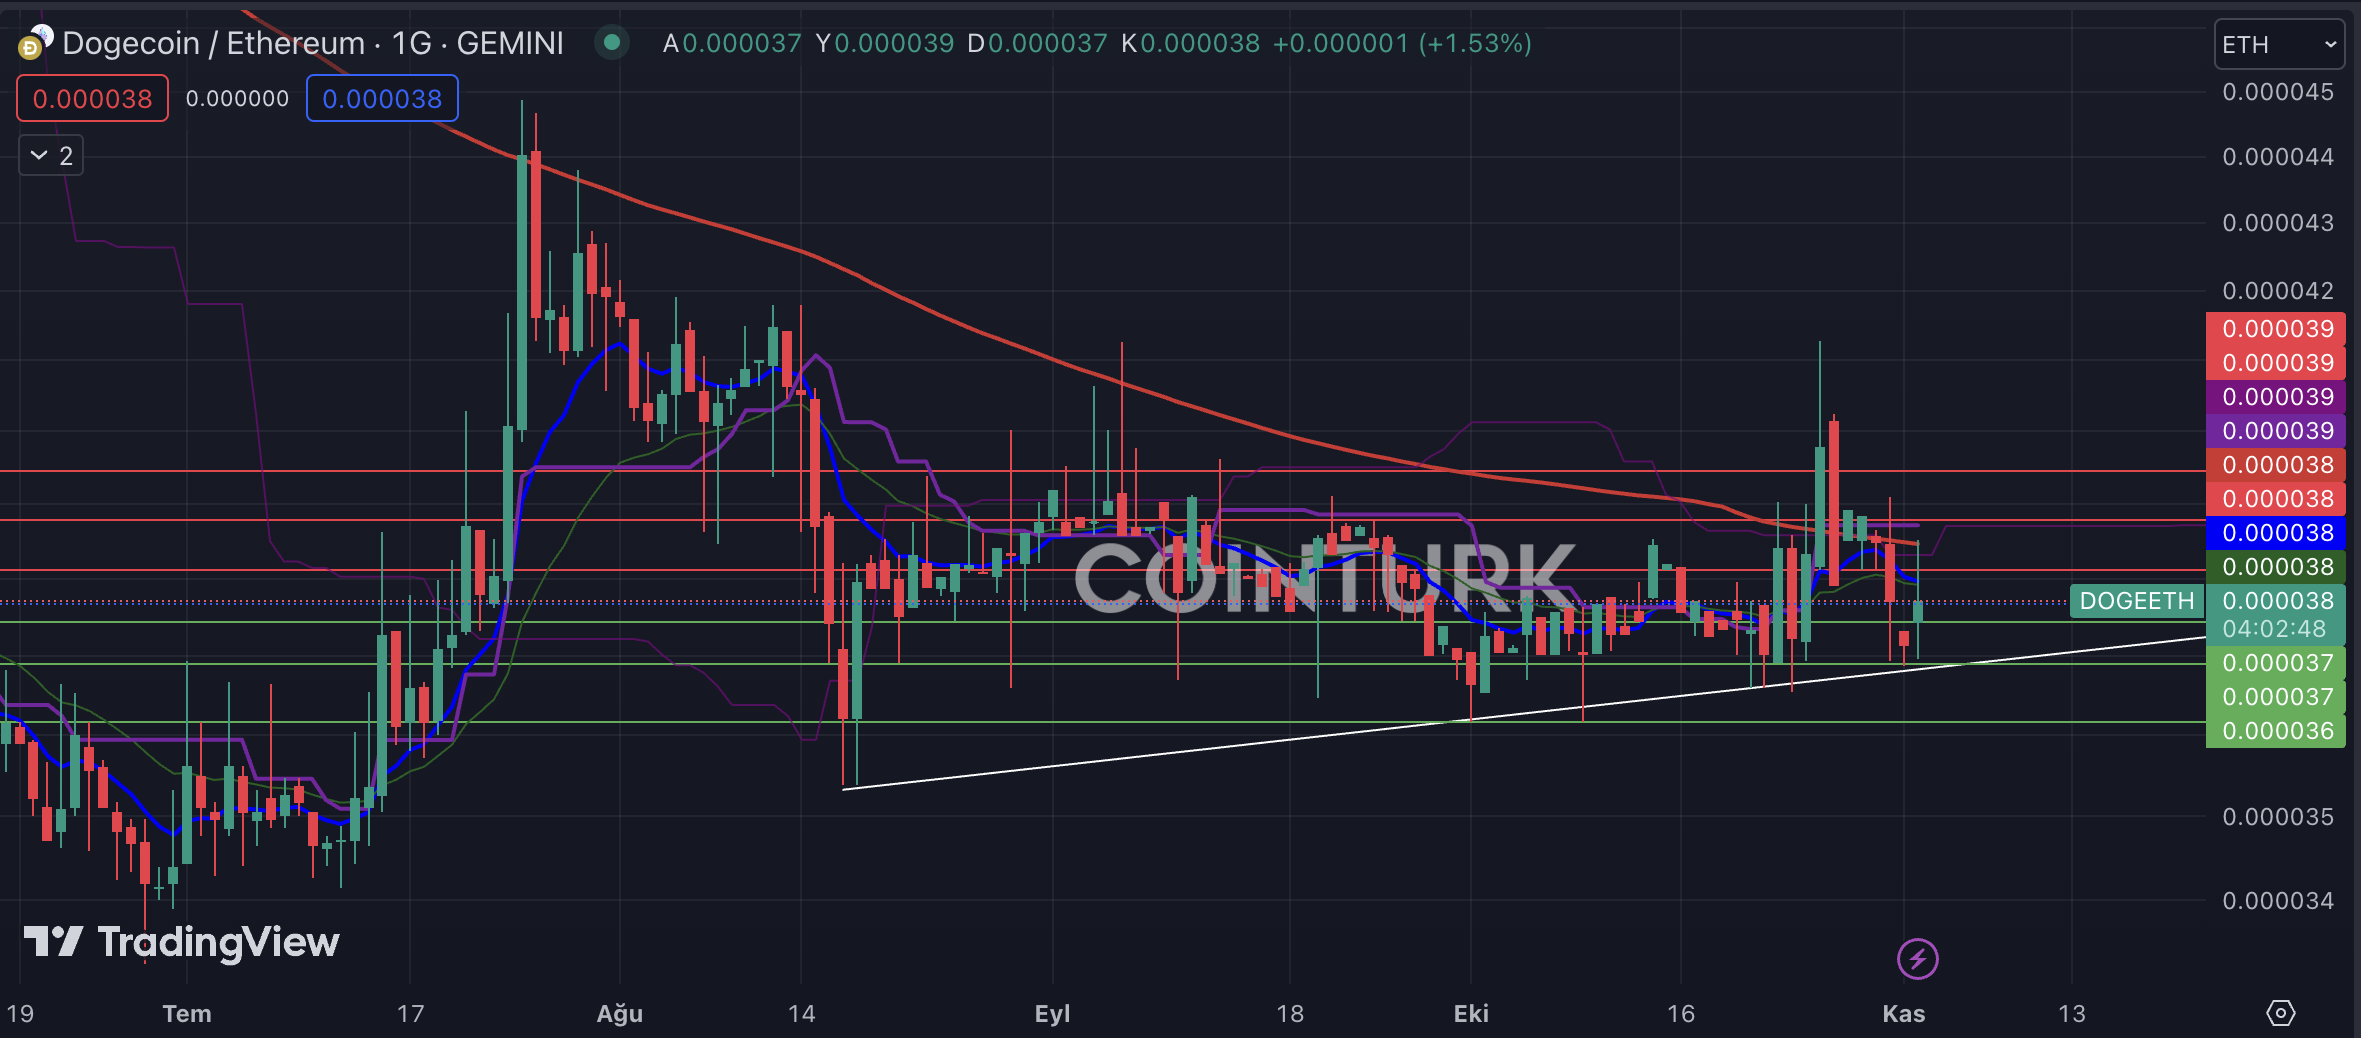
Another notable chart in the DOGE camp is the DOGE/ETH pair. The support trendline that has been in place since August indicates a significant power gain here, and accordingly, positive news flow in the near future could cause Dogecoin to gain value against Ethereum. Also, the recent resistance of the EMA 200 (red line) level is causing pressure on the pair.
Análisis del gráfico DOGE/ETHOtro gráfico notable en el campo DOGE es el par DOGE/ETH. La línea de tendencia de soporte que ha estado vigente desde agosto indica una ganancia de poder significativa aquí y, en consecuencia, el flujo de noticias positivas en el futuro cercano podría hacer que Dogecoin gane valor frente a Ethereum. Además, la reciente resistencia del nivel EMA 200 (línea roja) está ejerciendo presión sobre el par.
The support levels to watch for the DOGE/ETH pair are respectively 0.0000375, 0.0000370, and 0.0000360. Especially, a daily bar closing below the 0.0000360 level can trigger a decline in the pair, causing Ethereum to gain value against DOGE.
Los niveles de soporte a tener en cuenta para el par DOGE/ETH son respectivamente 0.0000375, 0.0000370 y 0.0000360. Especialmente, una barra diaria que cierra por debajo del nivel 0.0000360 puede provocar una caída en el par, haciendo que Ethereum gane valor frente a DOGE.
The resistance levels to watch for the DOGE/ETH pair are respectively 0.0000390, 0.0000395, and 0.0000398. Especially, a daily bar closing above the 0.0000395 level, along with breaking above the EMA 200 level, will enable an upward momentum in the pair, causing DOGE to gain value against ETH.
Los niveles de resistencia a tener en cuenta para el par DOGE/ETH son respectivamente 0.0000390, 0.0000395 y 0.0000398. Especialmente, una barra diaria que cierre por encima del nivel 0.0000395, junto con una ruptura por encima del nivel EMA 200, permitirá un impulso alcista en el par, lo que hará que DOGE gane valor frente a ETH.


 DogeHome
 Crypto Intelligence
 DogeHome
 CFN
CFN The Bit Journal
 Crypto Intelligence
 DeFi Planet
 Crypto News Land
 BH NEWS


