After a retracement from its current high of $0.22960, the price of Dogecoin (DOGE) looks like it is not yet done as the memecoin bounced back and moving toward its current high.
Después de un retroceso desde su máximo actual de $ 0,22960, el precio de Dogecoin (DOGE) parece que aún no ha terminado, ya que la memecoin se recuperó y avanzó hacia su máximo actual.
Dogecoin Price Technical Analysis
Dogecoin is one of the few memecoins that have captured the hearts of many crypto investors. Like Shiba Inu and Pepecoin (PEPE), Dogecoin is backed up by a strong and exciting community which has played a huge role in its success so far.
Análisis técnico del precio de Dogecoin Dogecoin es una de las pocas memecoins que ha capturado los corazones de muchos inversores en criptomonedas. Al igual que Shiba Inu y Pepecoin (PEPE), Dogecoin está respaldado por una comunidad sólida y apasionante que ha desempeñado un papel muy importante en su éxito hasta ahora.
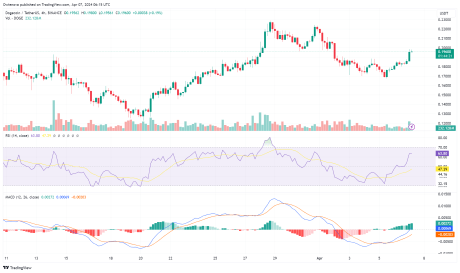
At the time of writing, the price of DOGE was trading around $0.19713 and was up by over 5% in the last 24 hours. Also, the price is currently trading above the 100-day moving average with very strong bullish momentum in the 4-hour timeframe.
En el momento de escribir este artículo, el precio de DOGE cotizaba alrededor de $0,19713 y subió más del 5% en las últimas 24 horas. Además, el precio se cotiza actualmente por encima del promedio móvil de 100 días con un impulso alcista muy fuerte en el período de 4 horas.
The MACD indicator in the 4-hour timeframe suggests an upward spike. This is so because the MACD line and the MACD signal that was trending below the zero line have both crossed, heading toward the MACD zero line.
El indicador MACD en el marco temporal de 4 horas sugiere un aumento. Esto se debe a que la línea MACD y la señal MACD que tenía una tendencia por debajo de la línea cero se han cruzado, dirigiéndose hacia la línea cero del MACD.
If the MACD line and the MACD signal line manage to cross above the MACD zero, Dogecoin might move higher to create a new high. Meanwhile, the MACD histogram is already trending above the zero line which suggests a bullish momentum.
Si la línea MACD y la línea de señal MACD logran cruzar por encima del MACD cero, Dogecoin podría subir para crear un nuevo máximo. Mientras tanto, el histograma MACD ya tiene una tendencia por encima de la línea cero, lo que sugiere un impulso alcista.

The Relative Strength Index (RSI) on the 4-hour timeframe also indicates a bullish momentum toward the upward direction as the RSI signal line has crossed above the 50% level and is heading towards the overbought zone. According to the RSI indicator, the strength of the upward movement is still very strong as buyers are still very active in the market.
El índice de fuerza relativa (RSI) en el marco temporal de 4 horas también indica un impulso alcista hacia arriba ya que la línea de señal RSI ha cruzado por encima del nivel del 50% y se dirige hacia la zona de sobrecompra. Según el indicador RSI, la fuerza del movimiento alcista sigue siendo muy fuerte ya que los compradores siguen muy activos en el mercado.
Potential Retracement On The Downside
Given the price’s previous surge, two major resistance levels and one major support level were created around $0.22960, $0.2244, and $0.19622 respectively. If the price of DOGE manages to move above the resistance level of $0.22441 level, it might move even further upward toward the resistance level of $0.22960.
Posible retroceso a la bajaDado el aumento anterior del precio, se crearon dos niveles de resistencia principales y un nivel de soporte importante alrededor de $ 0,22960, $ 0,2244 y $ 0,19622 respectivamente. Si el precio de DOGE logra superar el nivel de resistencia de $ 0,22441, podría subir aún más hacia el nivel de resistencia de $ 0,22960.
At this point, if the price succeeds in breaking above this level, the price might surge higher to create a new high. On the other hand, if the price fails to break above this resistance level, the price might start a new downward movement toward its previous support level of $0.19622. However, a breakout below the $0.19622 level could trigger a new downward trend.
En este punto, si el precio logra superar este nivel, el precio podría subir más para crear un nuevo máximo. Por otro lado, si el precio no logra superar este nivel de resistencia, el precio podría iniciar un nuevo movimiento a la baja hacia su nivel de soporte anterior de 0,19622 dólares. Sin embargo, una ruptura por debajo del nivel de USD 0,19622 podría desencadenar una nueva tendencia a la baja.

DOGE cotiza a 0,19 dólares en el gráfico 1D | Fuente: DOGEUSDT en Tradingview.com Imagen destacada de iStock, gráfico de Tradingview.com Descargo de responsabilidad: el artículo se proporciona únicamente con fines educativos. No representa las opiniones de NewsBTC sobre si comprar, vender o mantener inversiones y, naturalmente, invertir conlleva riesgos. Se recomienda realizar su propia investigación antes de tomar cualquier decisión de inversión. Utilice la información proporcionada en este sitio web bajo su propio riesgo. Etiquetas: dogeDogecoindogeusddogeusdtMACDPEPEPepeCoinÍndice de fuerza relativaRSISHIBShiba Inu


 CFN
CFN Crypto News Land
 Crypto News Land
 Crypto Intelligence
 DeFi Planet
 TheCoinrise Media
 TheCoinrise Media
 DogeHome
 crypto.news


