You can also read this news on COINTURK NEWS: Dogecoin Technical Analysis: A Closer Look at the Trend
También puede leer esta noticia en COINTURK NEWS: Análisis técnico de Dogecoin: una mirada más cercana a la tendencia
With the rally that occurred in 2021, the memecoin sector, which entered our lives, continues to experience notable developments. Dogecoin almost showed no presence in the recent memecoin hype, which continues to be a topic in various blockchain ecosystems, including the Solana network. So, what is expected for Dogecoin in the upcoming period? Let’s examine together.
Con el repunte ocurrido en 2021, el sector de las memecoins, que entró en nuestras vidas, sigue experimentando evoluciones notables. Dogecoin casi no mostró presencia en el reciente revuelo de memecoin, que sigue siendo un tema en varios ecosistemas blockchain, incluida la red Solana. Entonces, ¿qué se espera de Dogecoin en el próximo período? Examinemos juntos.
Dogecoin Chart Analysis
Análisis de gráficos de Dogecoin
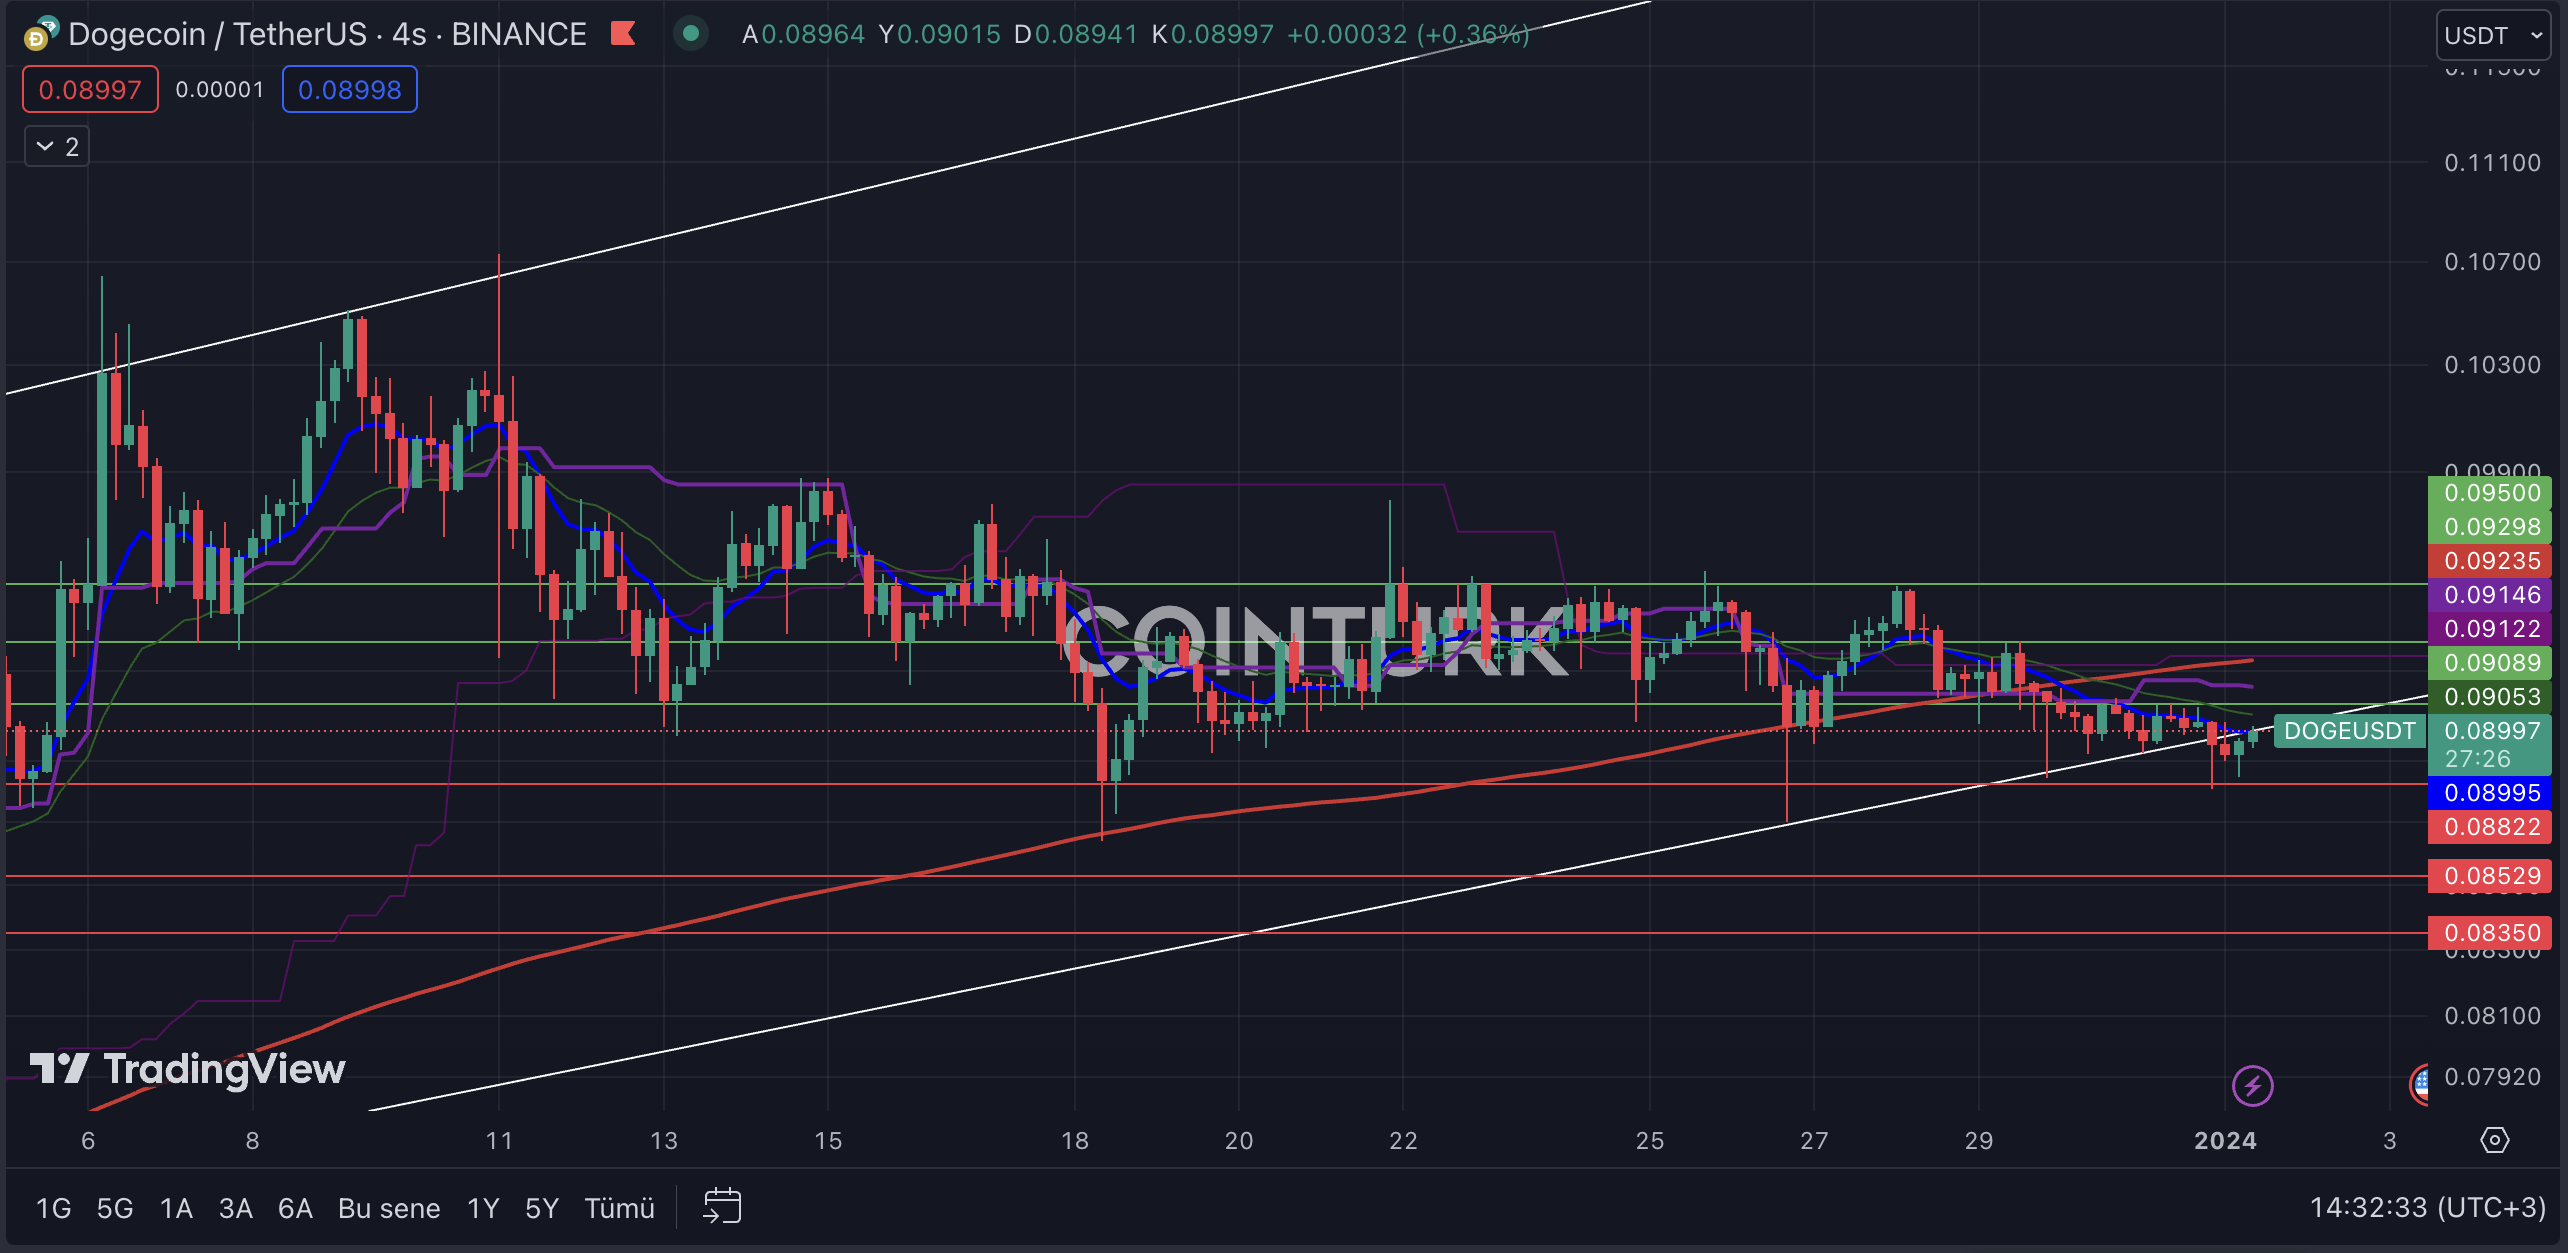
The first noticeable formation structure in the four-hour Dogecoin chart is the ascending channel formation. This structure indicates important clues for investors as there has been no support or resistance break until the last bar formation. However, with the last bars closing below the support line, the possibility of a negative scenario for DOGE in the coming period is increasing.
La primera estructura de formación notable en el gráfico de Dogecoin de cuatro horas es la formación del canal ascendente. Esta estructura indica pistas importantes para los inversores, ya que no ha habido ruptura de soporte o resistencia hasta la última formación de la barra. Sin embargo, con las últimas barras cerrando por debajo de la línea de soporte, aumenta la posibilidad de un escenario negativo para DOGE en el próximo período.
The most important support levels to watch on the four-hour Dogecoin chart are; $0.08822, $0.08529, and $0.08350, respectively. Especially if the closing of the last bars occurs below the crucial $0.08822 level, it will create selling pressure on the DOGE price.
Los niveles de soporte más importantes a observar en el gráfico de Dogecoin de cuatro horas son; $0,08822, $0,08529 y $0,08350, respectivamente. Especialmente si el cierre de las últimas barras se produce por debajo del nivel crucial de $ 0,08822, creará presión de venta sobre el precio de DOGE.
On the other hand, the most important resistance levels to follow on the four-hour DOGE chart are; $0.09089, $0.09298, and $0.09500, respectively. A four-hour bar closing above the $0.09089 level, which intersects with EMA 21 (blue line), will allow DOGE to trade back within the formation zone and keep the recent break as a bear trap.
Por otro lado, los niveles de resistencia más importantes a seguir en el gráfico DOGE de cuatro horas son; $0,09089, $0,09298 y $0,09500, respectivamente. Una barra de cuatro horas que cierra por encima del nivel de $ 0,09089, que se cruza con la EMA 21 (línea azul), permitirá a DOGE volver a operar dentro de la zona de formación y mantener la reciente ruptura como una trampa para bajistas.

Dogecoin Weekly Chart Analysis
Análisis de gráficos semanales de Dogecoin
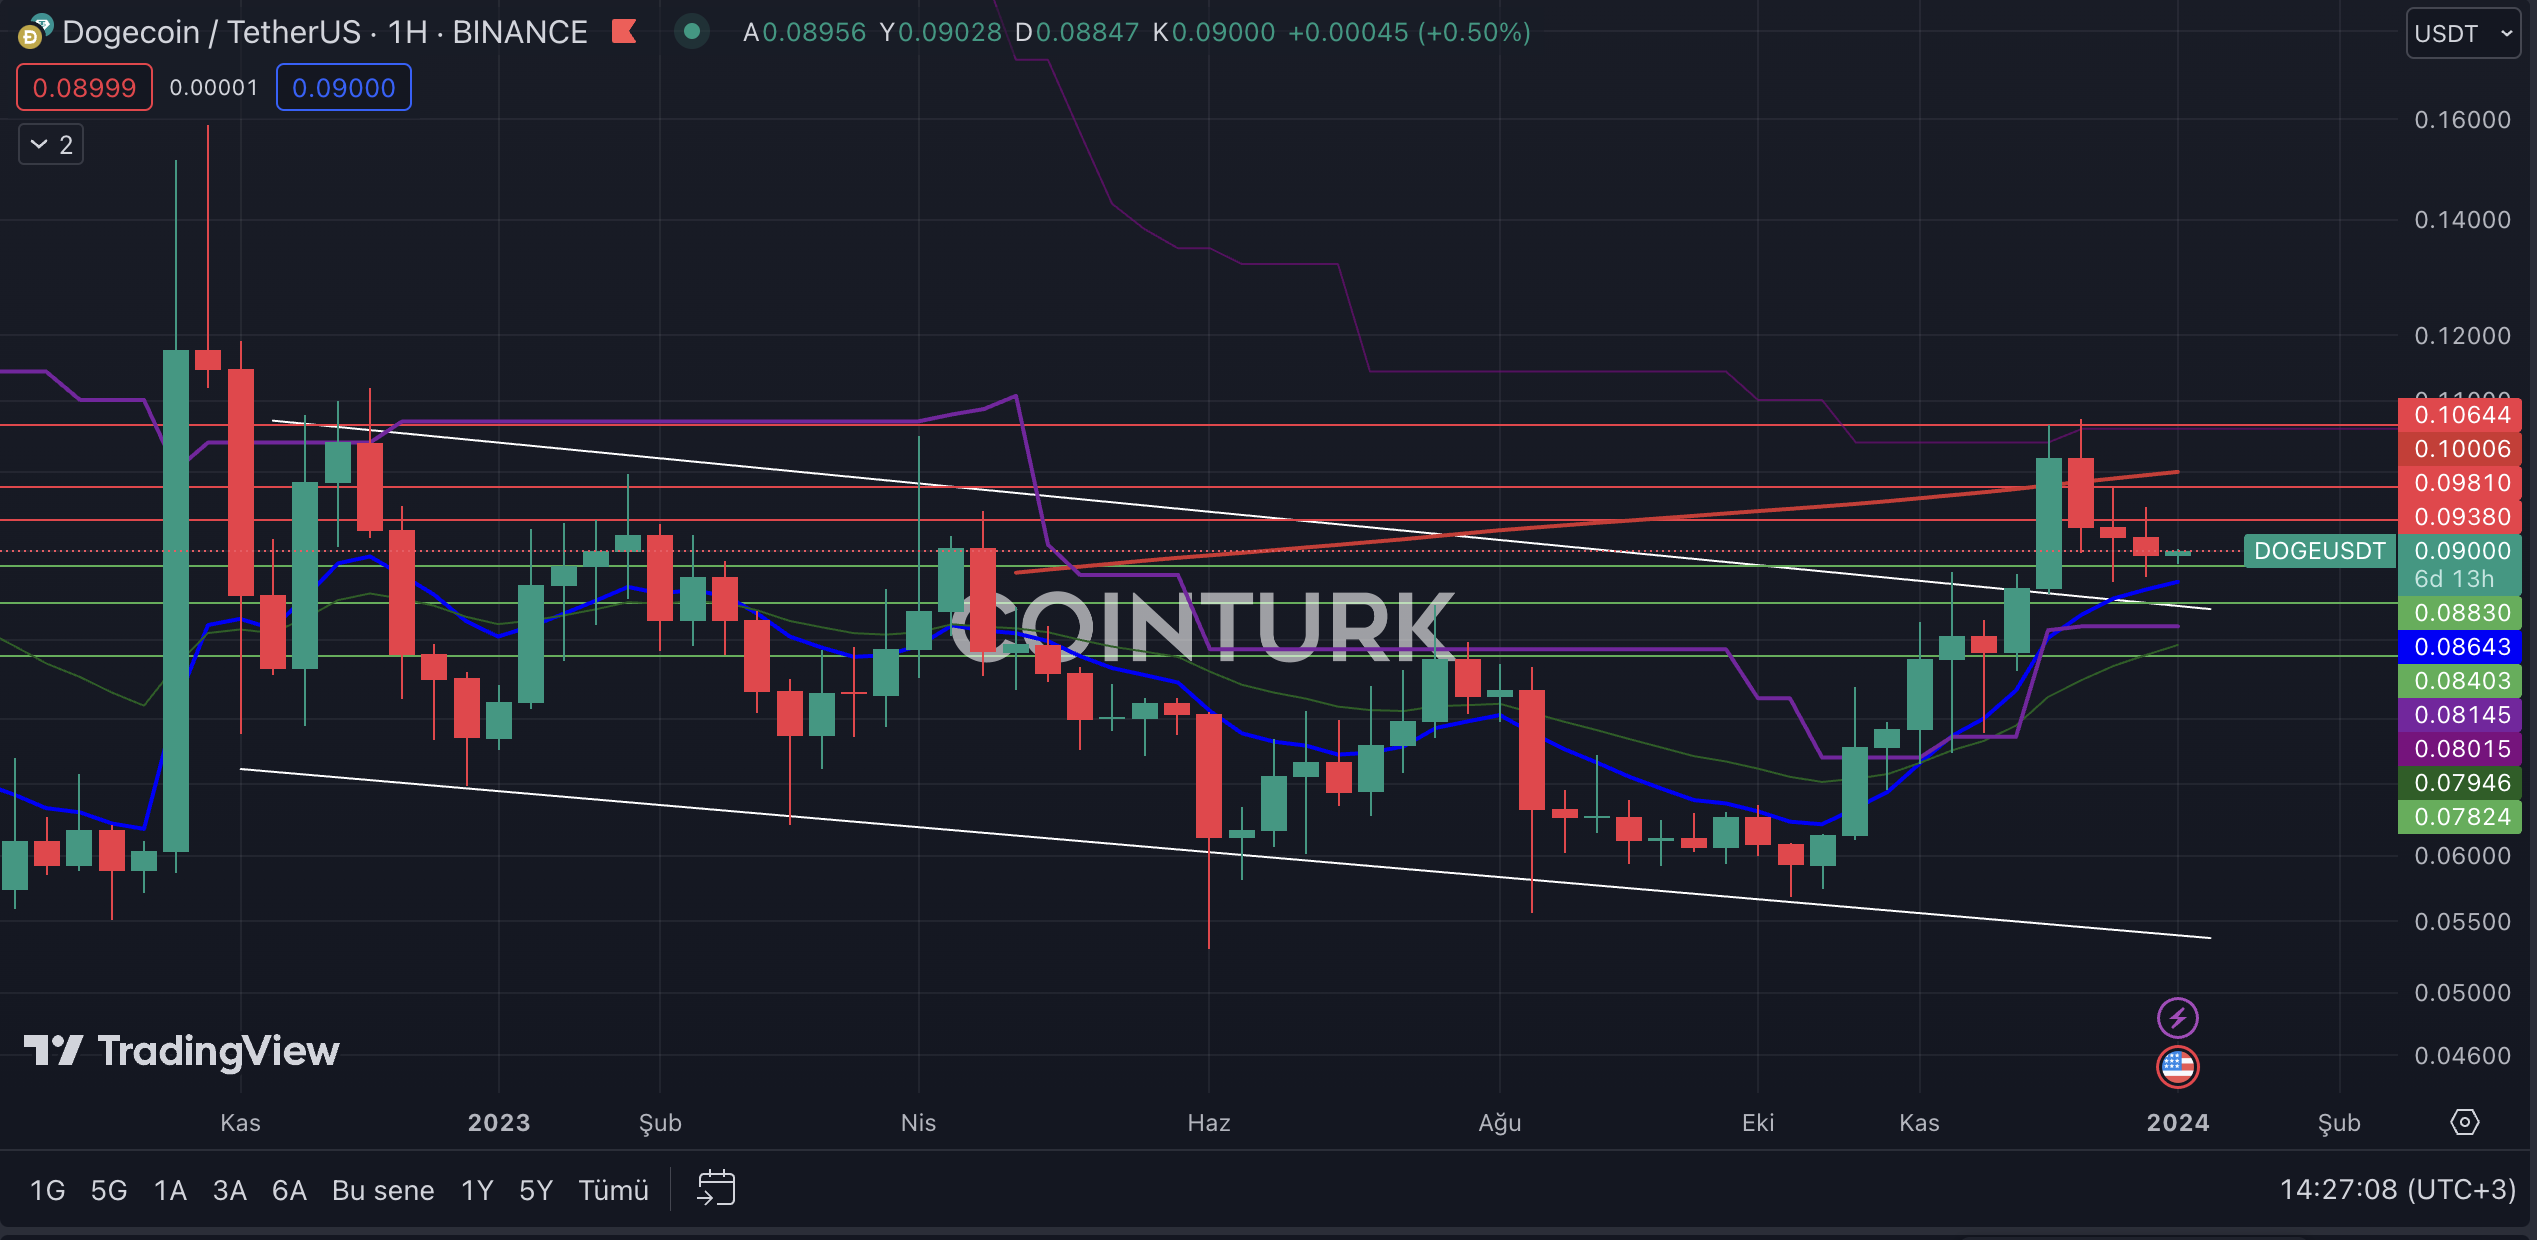
The first noticeable formation structure in the weekly Dogecoin chart is the descending channel formation, which led to an upward movement with the resistance break that occurred last month. However, the EMA 200 (red line) acting as resistance has led to selling pressure on DOGE, and the price continues to trade above the resistance line for now.
La primera estructura de formación notable en el gráfico semanal de Dogecoin es la formación del canal descendente, que condujo a un movimiento ascendente con la ruptura de resistencia que ocurrió el mes pasado. Sin embargo, la EMA 200 (línea roja) que actúa como resistencia ha generado presión de venta sobre DOGE y el precio continúa cotizando por encima de la línea de resistencia por ahora.
The most important support levels for Dogecoin to watch are; $0.08830, $0.08403, and $0.07824, respectively. Particularly, a weekly bar closing below the significant $0.08830 level in recent weeks will cause DOGE’s price to lose momentum.
Los niveles de soporte más importantes que debe observar Dogecoin son; $0,08830, $0,08403 y $0,07824, respectivamente. En particular, una barra semanal que cierra por debajo del importante nivel de $ 0,08830 en las últimas semanas hará que el precio de DOGE pierda impulso.
The most important resistance levels to follow on the weekly chart for Dogecoin are; $0.09380, $0.09810, and $0.10644, respectively. Especially a weekly bar closing above the $0.09810 level, which intersects with EMA 200, will help DOGE’s price gain momentum.
Los niveles de resistencia más importantes a seguir en el gráfico semanal de Dogecoin son; $0,09380, $0,09810 y $0,10644, respectivamente. Especialmente una barra semanal que cierre por encima del nivel de $ 0,09810, que se cruza con la EMA 200, ayudará a que el precio de DOGE gane impulso.

The post first appeared on COINTURK NEWS: Dogecoin Technical Analysis: A Closer Look at the Trend
La publicación apareció por primera vez en COINTURK NEWS: Análisis técnico de Dogecoin: una mirada más cercana a la tendencia


 Crypto Intelligence
 BlockchainReporter
 CFN
CFN Crypto News Land
 Crypto News Land
 Crypto Intelligence
 DeFi Planet
 TheCoinrise Media
 TheCoinrise Media


