Technical analysis plays a crucial role in the cryptocurrency market, especially for investors trading in the futures market. So, what insights does technical analysis provide for Dogecoin, which is currently trading at $0.078? Let’s take a detailed look at the charts, important support and resistance levels.
El análisis técnico juega un papel crucial en el mercado de las criptomonedas, especialmente para los inversores que operan en el mercado de futuros. Entonces, ¿qué información proporciona el análisis técnico para Dogecoin, que actualmente cotiza a 0,078 dólares? Echemos un vistazo detallado a los gráficos, los niveles importantes de soporte y resistencia.
Dogecoin Daily Chart Analysis
Análisis del gráfico diario de Dogecoin
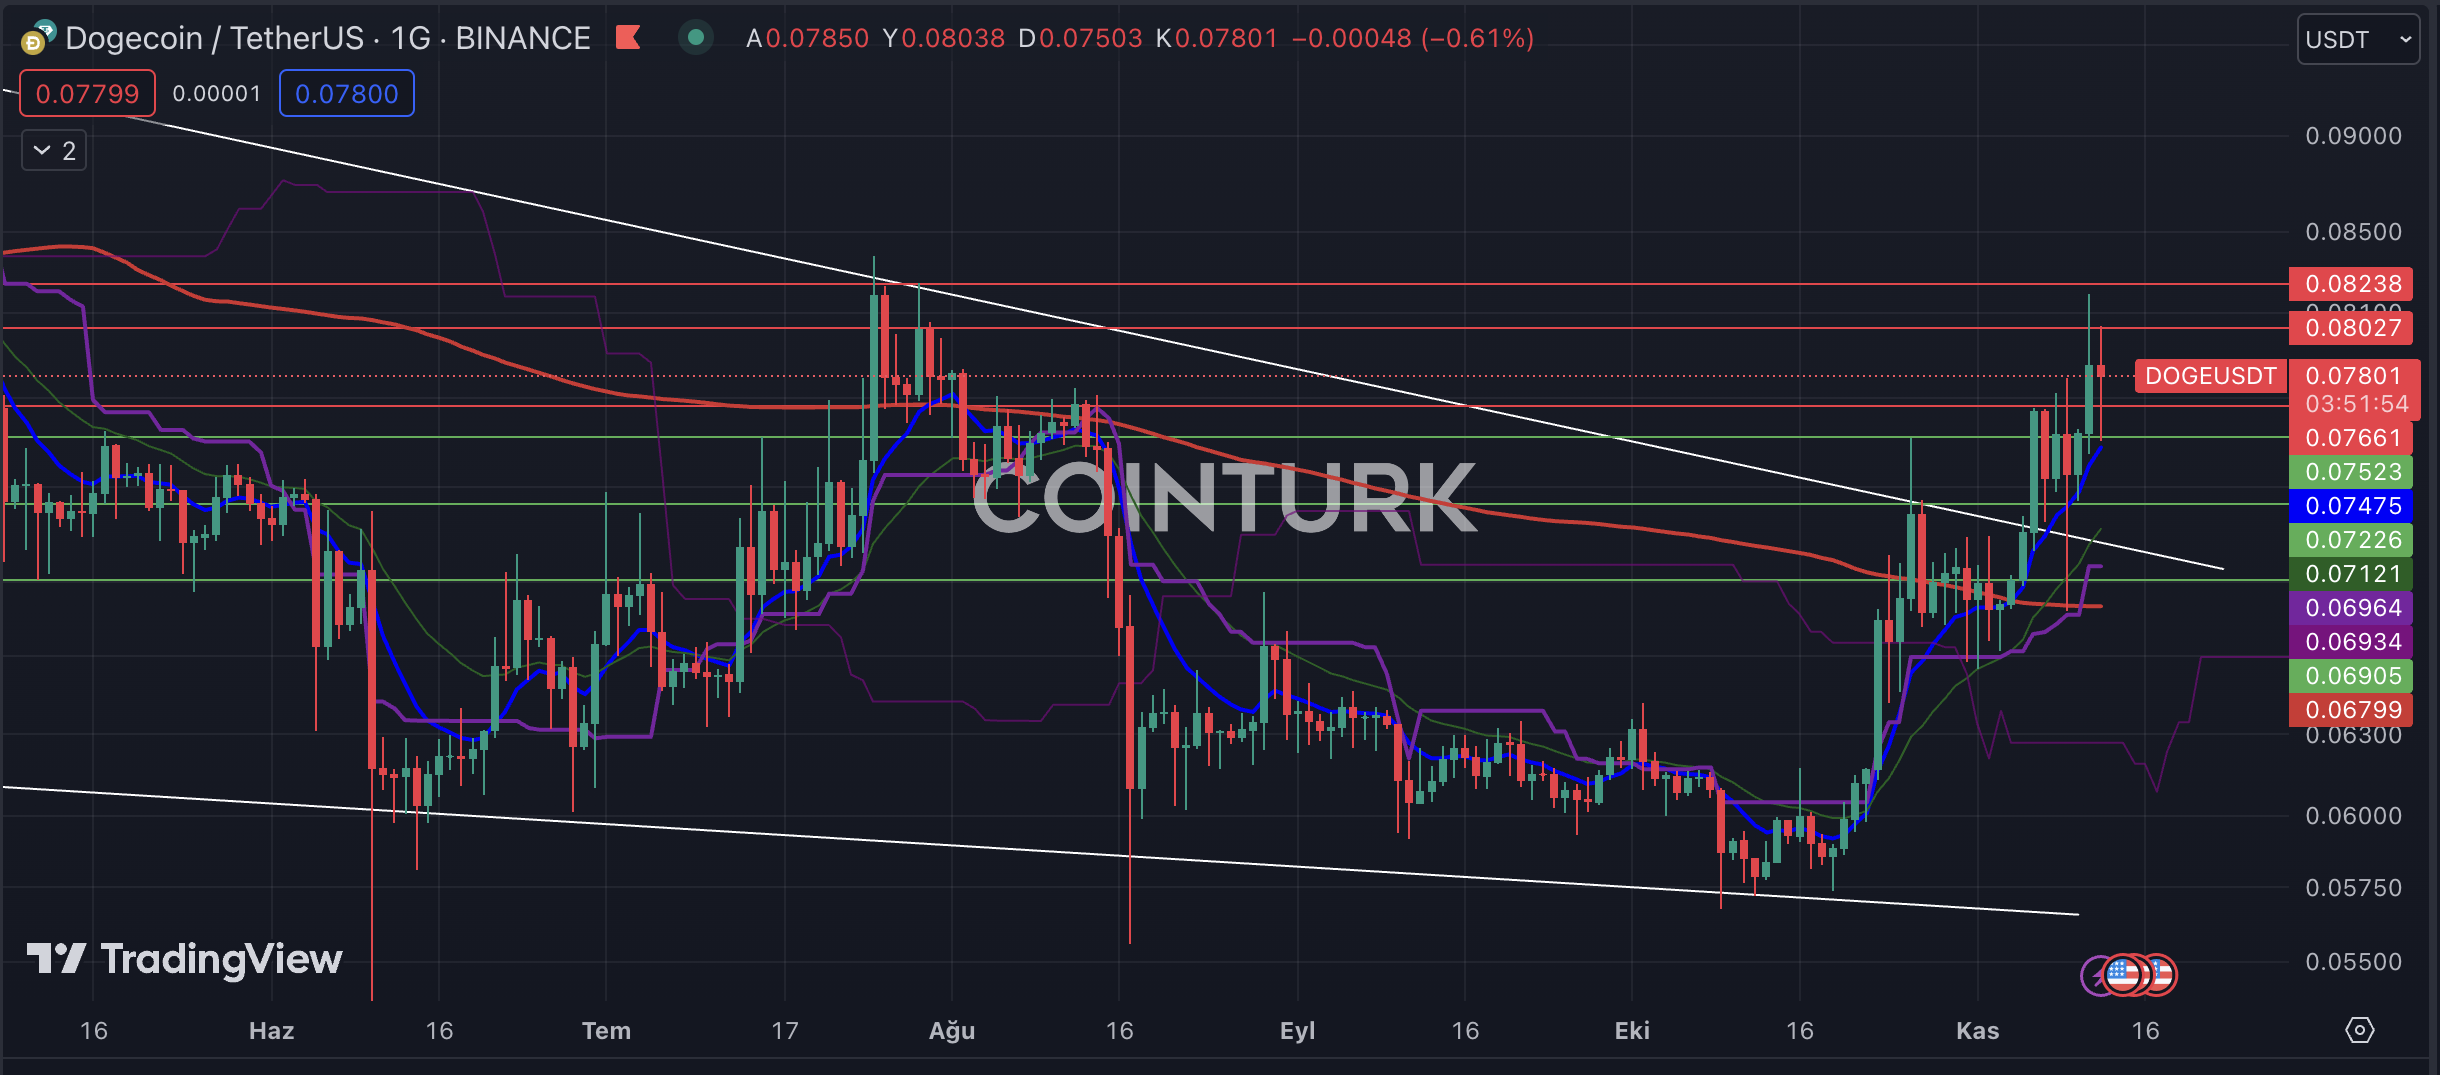
The Dogecoin daily chart reveals a notable breakout from a descending wedge formation, and after working as support, the resistance line led to a significant rise in DOGE. Additionally, the support provided by the EMA 200 (red line) during the drop on November 9 is a positive indicator for the DOGE price.
El gráfico diario de Dogecoin muestra una ruptura notable de una formación de cuña descendente y, después de funcionar como soporte, la línea de resistencia condujo a un aumento significativo en DOGE. Además, el soporte brindado por la EMA 200 (línea roja) durante la caída del 9 de noviembre es un indicador positivo para el precio de DOGE.
The support levels to watch on the daily chart for DOGE are $0.07523, $0.07226, and $0.06905, respectively. A daily close below $0.06905 could lead to a significant decline in this area. In such a scenario, the support level at $0.05750 may come into play.
Los niveles de soporte a tener en cuenta en el gráfico diario para DOGE son USD 0,07523, USD 0,07226 y USD 0,06905, respectivamente. Un cierre diario por debajo de USD 0,06905 podría provocar una caída significativa en esta área. En tal escenario, el nivel de soporte de $0,05750 puede entrar en juego.
The notable resistance levels to watch on the daily chart for DOGE are $0.08027, $0.08238, and $0.08500, respectively. In particular, breaking the unbroken $0.08238 resistance level in the recent rally could trigger a potential bullish rally for DOGE. This, of course, can also be seen with the positive impact of news flow.
Los niveles de resistencia notables a observar en el gráfico diario de DOGE son $ 0,08027, $ 0,08238 y $ 0,08500, respectivamente. En particular, romper el nivel de resistencia ininterrumpido de $ 0,08238 en el reciente repunte podría desencadenar un posible repunte alcista para DOGE. Esto, por supuesto, también se puede ver en el impacto positivo del flujo de noticias.

DOGE/BTC Chart Analysis
Análisis de gráficos DOGE/BTC
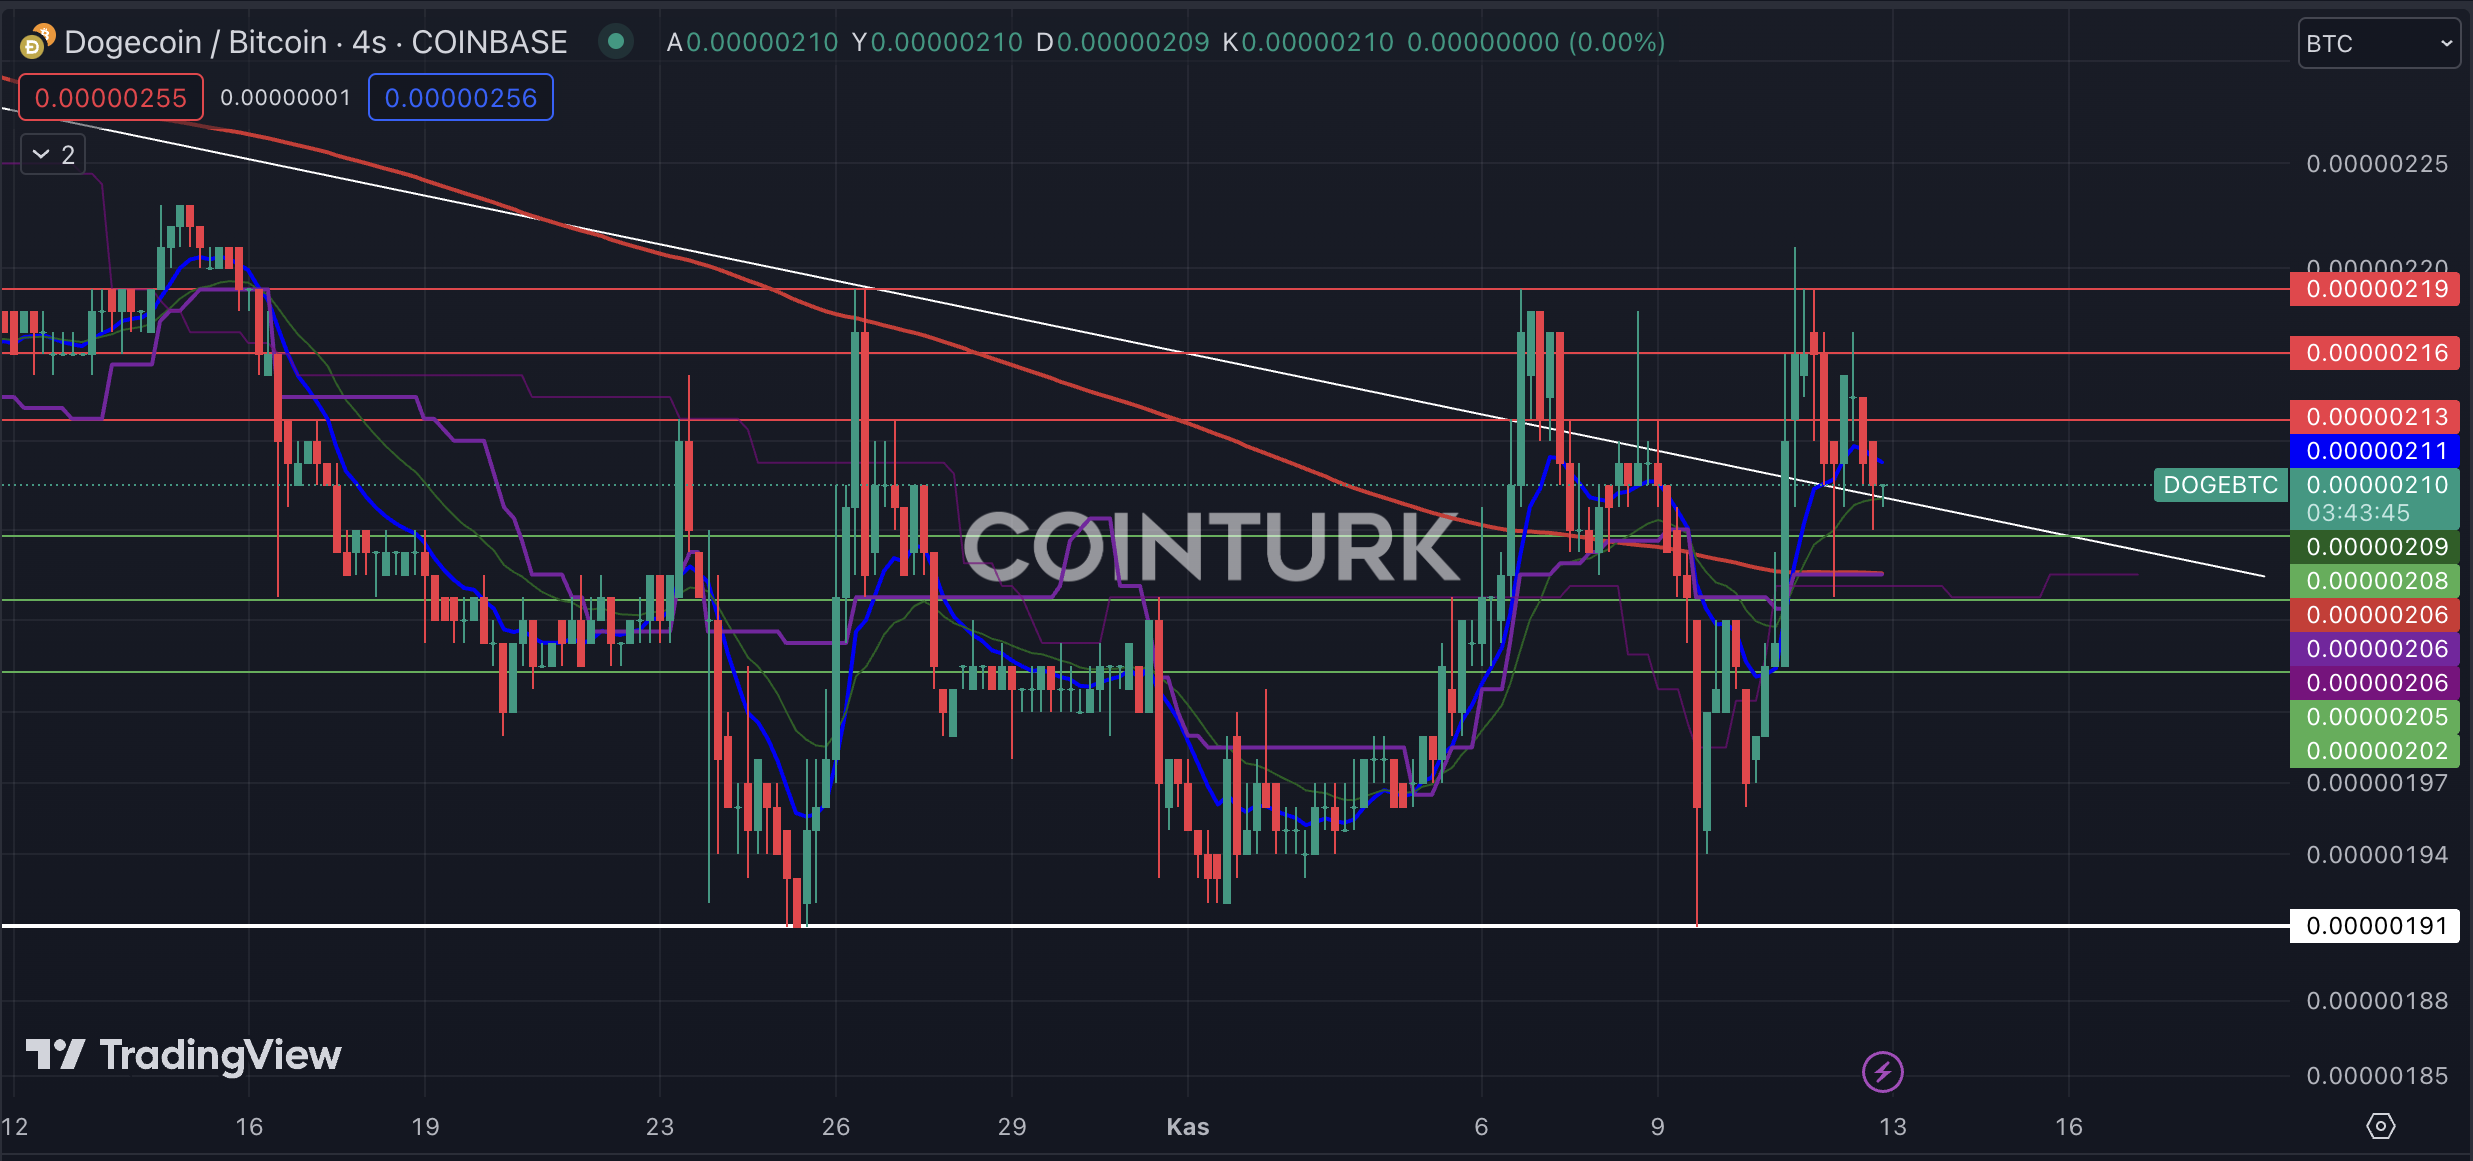
In the DOGE/BTC pair, there has been a recent breakout from a contracting triangle structure. The repeated support provided by the resistance line indicates a consolidation phase for DOGE. The recent support provided by the EMA 200 suggests a significant potential rise in this structure.
En el par DOGE/BTC, ha habido una ruptura reciente de una estructura triangular en contracción. El soporte repetido proporcionado por la línea de resistencia indica una fase de consolidación para DOGE. El reciente soporte proporcionado por la EMA 200 sugiere un aumento potencial significativo en esta estructura.
The support levels to watch in the DOGE/BTC pair are 0.00000208, 0.00000205, and 0.00000202, respectively. Especially, a close below 0.00000205 could lead to a retracement within the formation and the creation of a structure below the EMA 200 level. In such a case, DOGE would lose value against Bitcoin.
Los niveles de soporte a tener en cuenta en el par DOGE/BTC son 0.00000208, 0.00000205 y 0.00000202, respectivamente. Especialmente, un cierre por debajo de 0.00000205 podría conducir a un retroceso dentro de la formación y la creación de una estructura por debajo del nivel EMA 200. En tal caso, DOGE perdería valor frente a Bitcoin.
The notable resistance levels to watch in the DOGE/BTC pair are 0.00000213, 0.00000216, and 0.00000219, respectively. In particular, a close above 0.00000219 could trigger a significant upward momentum for DOGE.
Los niveles de resistencia notables a tener en cuenta en el par DOGE/BTC son 0.00000213, 0.00000216 y 0.00000219, respectivamente. En particular, un cierre por encima de 0.00000219 podría desencadenar un impulso alcista significativo para DOGE.

Continuar leyendo: https://en.coin-turk.com/dogecoin-technical-analysis-key-levels-to-watch/


 Crypto News Land
 BH NEWS
 DogeHome
 CryptoPotato_News
 CoinsProbe
 U.Today
 BlockchainReporter
 BlockchainReporter
 Crypto Intelligence


