Technical analysis plays a crucial role in the cryptocurrency market, especially for investors trading in the futures market. So, what insights does technical analysis provide for Dogecoin, which is currently trading at $0.078? Let’s take a detailed look at the charts, important support and resistance levels.
技术分析在加密货币市场中发挥着至关重要的作用,尤其是对于在期货市场交易的投资者而言。那么,技术分析为目前交易价格为 0.078 美元的狗狗币提供了哪些见解呢?让我们详细看看图表、重要的支撑位和阻力位。
Dogecoin Daily Chart Analysis
狗狗币每日图表分析
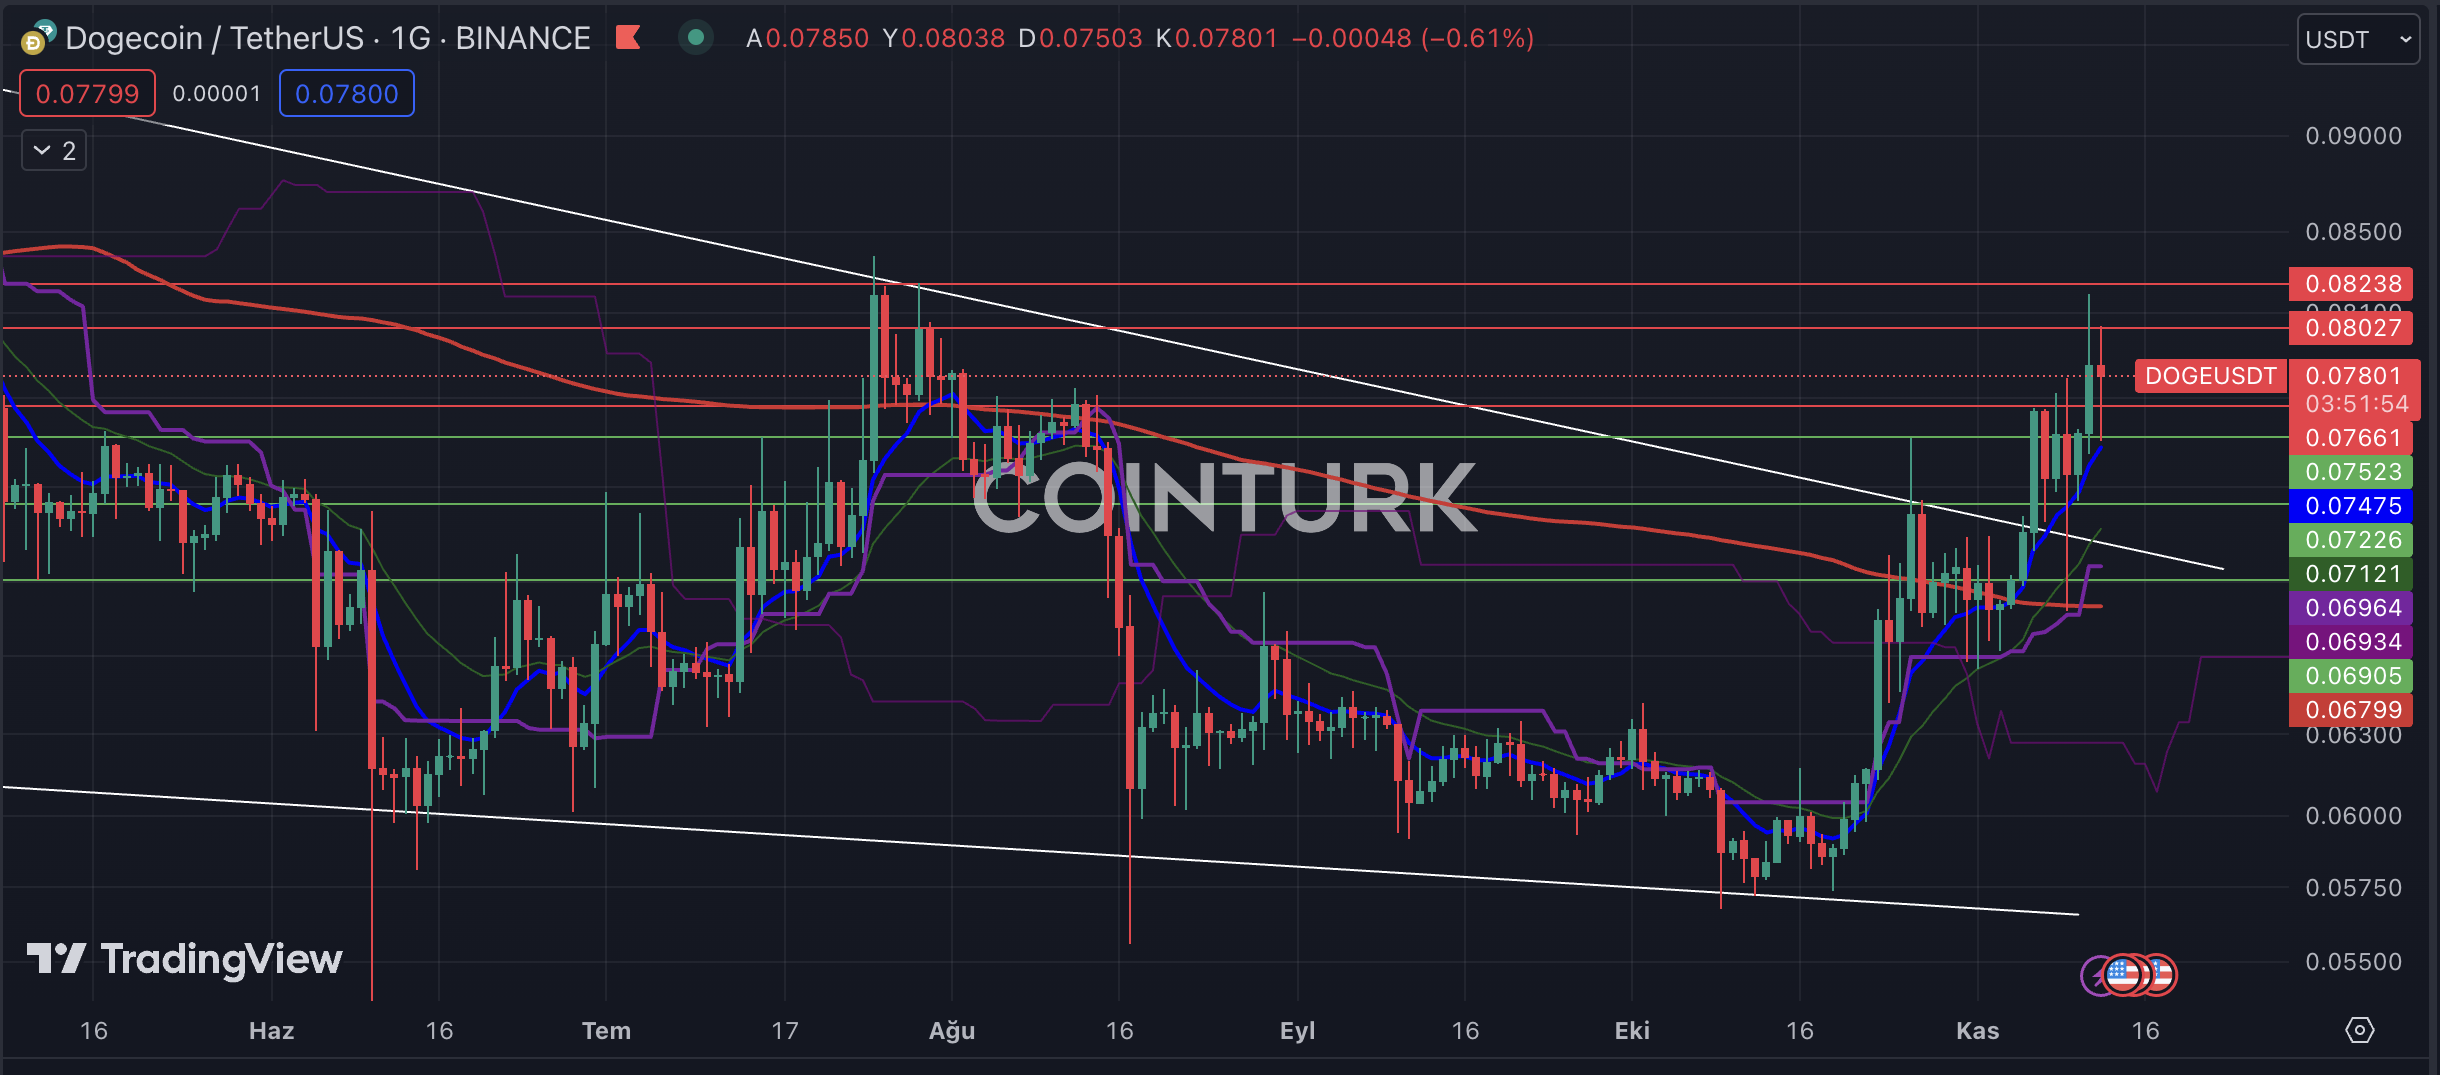
The Dogecoin daily chart reveals a notable breakout from a descending wedge formation, and after working as support, the resistance line led to a significant rise in DOGE. Additionally, the support provided by the EMA 200 (red line) during the drop on November 9 is a positive indicator for the DOGE price.
狗狗币日线图显示出明显突破下降楔形,在作为支撑后,阻力线导致狗狗币大幅上涨。此外,11 月 9 日下跌期间 EMA 200(红线)提供的支撑是 DOGE 价格的积极指标。
The support levels to watch on the daily chart for DOGE are $0.07523, $0.07226, and $0.06905, respectively. A daily close below $0.06905 could lead to a significant decline in this area. In such a scenario, the support level at $0.05750 may come into play.
DOGE 日线图上值得关注的支撑位分别为 0.07523 美元、0.07226 美元和 0.06905 美元。每日收盘价低于 0.06905 美元可能会导致该区域大幅下跌。在这种情况下,0.05750 美元的支撑位可能会发挥作用。
The notable resistance levels to watch on the daily chart for DOGE are $0.08027, $0.08238, and $0.08500, respectively. In particular, breaking the unbroken $0.08238 resistance level in the recent rally could trigger a potential bullish rally for DOGE. This, of course, can also be seen with the positive impact of news flow.
DOGE 日线图上值得注意的阻力位分别为 0.08027 美元、0.08238 美元和 0.08500 美元。特别是,在最近的反弹中突破 0.08238 美元的不间断阻力位可能会引发 DOGE 的潜在看涨反弹。当然,这也可以从新闻流的积极影响中看出。

DOGE/BTC Chart Analysis
DOGE/BTC 图表分析
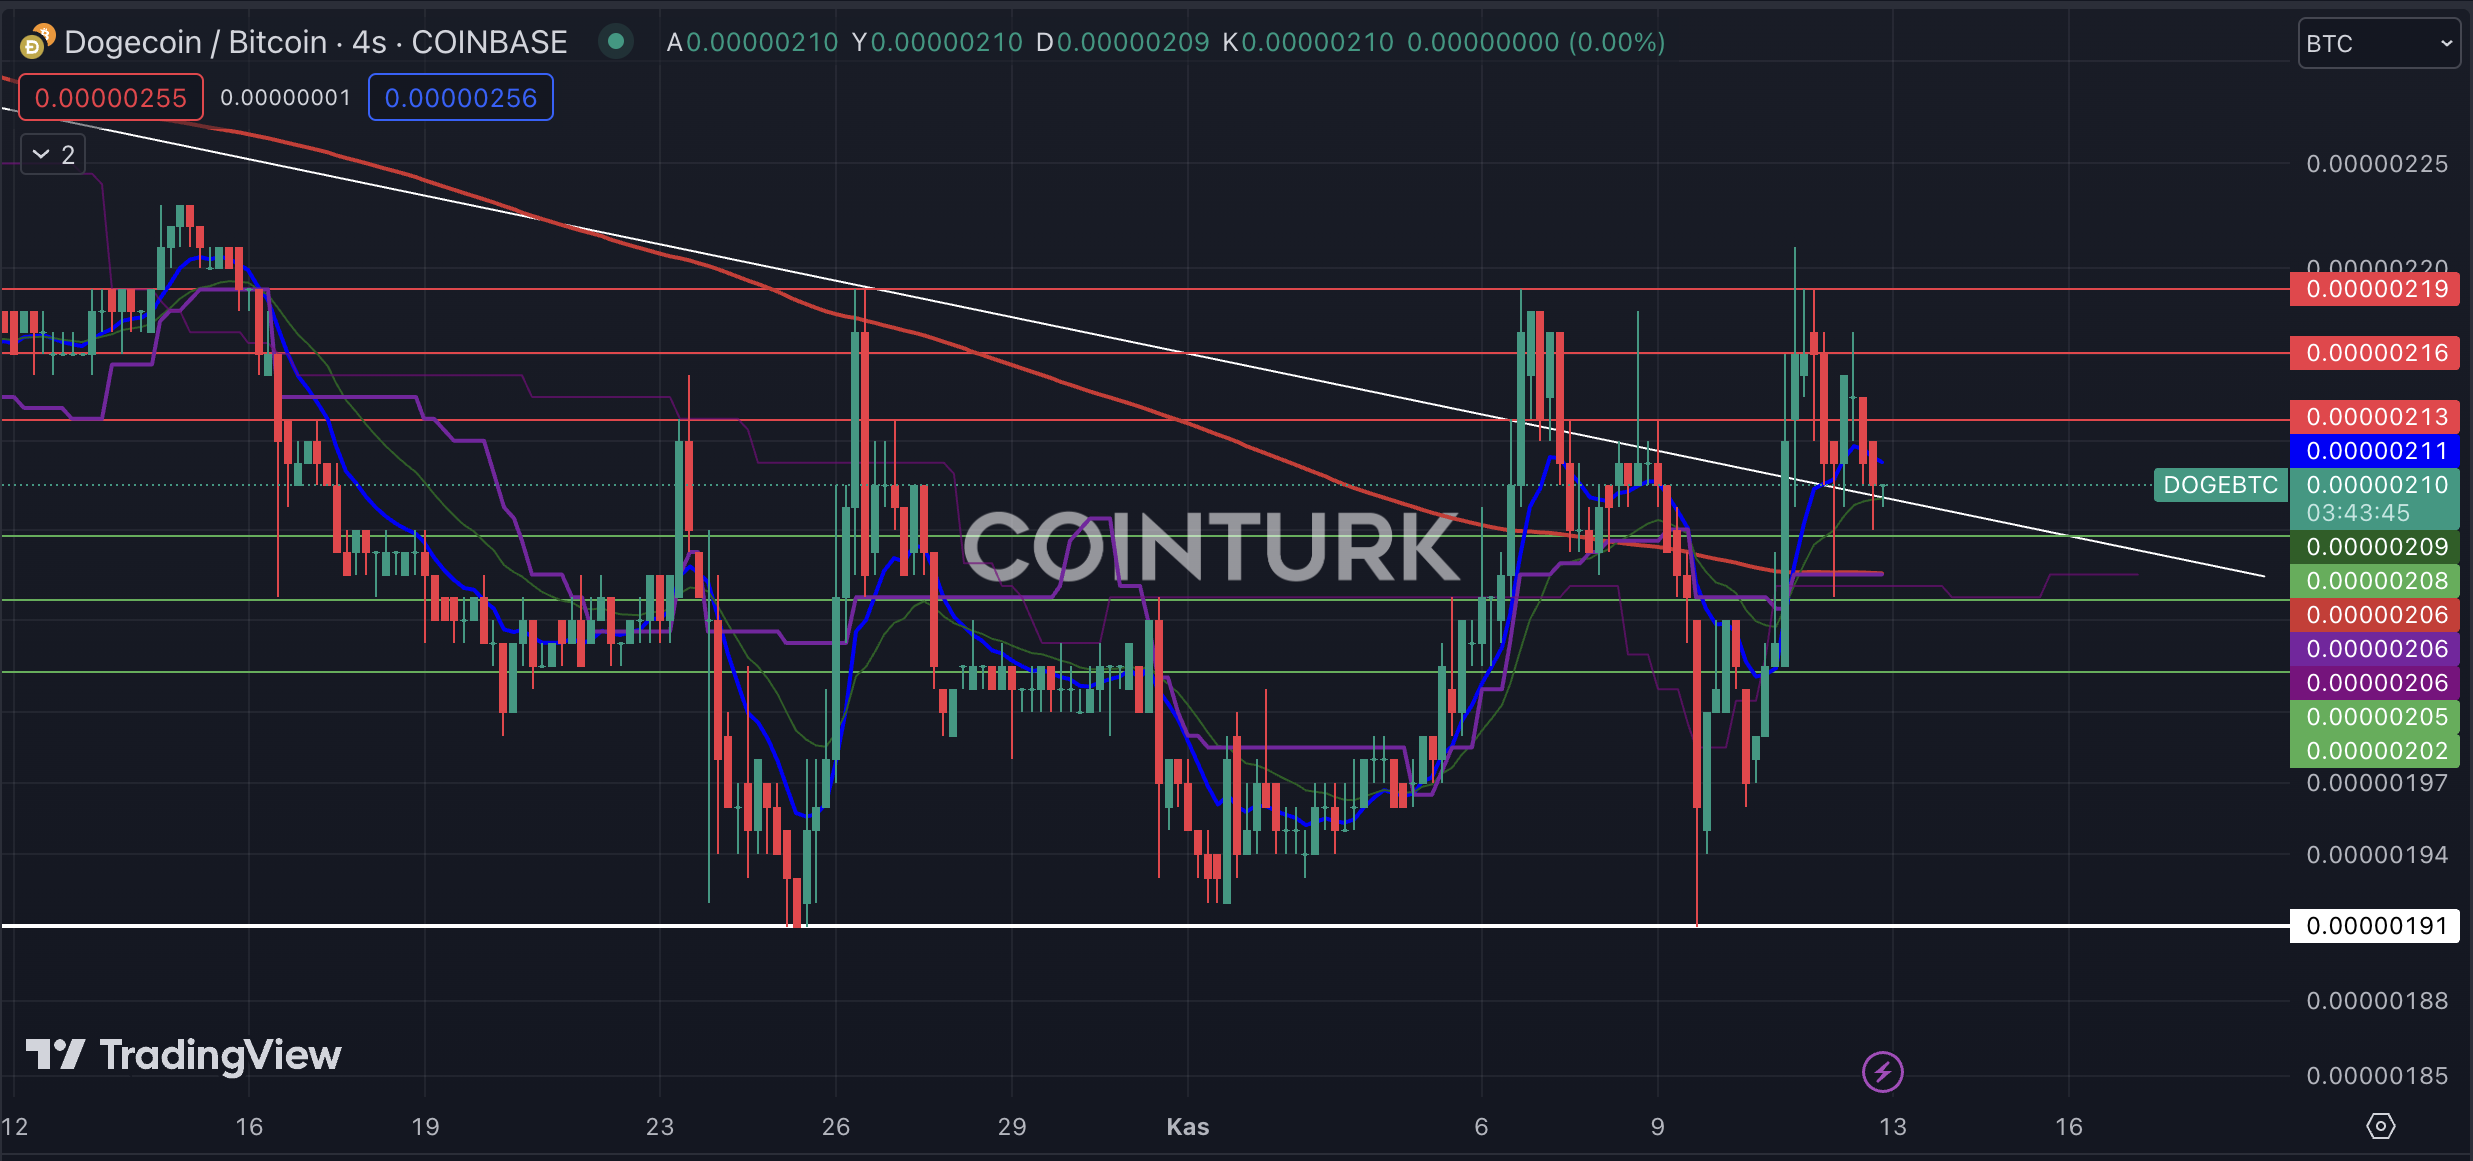
In the DOGE/BTC pair, there has been a recent breakout from a contracting triangle structure. The repeated support provided by the resistance line indicates a consolidation phase for DOGE. The recent support provided by the EMA 200 suggests a significant potential rise in this structure.
在 DOGE/BTC 货币对中,最近突破了收缩三角形结构。阻力线提供的反复支撑表明 DOGE 进入盘整阶段。 EMA 200 近期提供的支撑表明该结构有可能大幅上涨。
The support levels to watch in the DOGE/BTC pair are 0.00000208, 0.00000205, and 0.00000202, respectively. Especially, a close below 0.00000205 could lead to a retracement within the formation and the creation of a structure below the EMA 200 level. In such a case, DOGE would lose value against Bitcoin.
DOGE/BTC 货币对中值得关注的支撑位分别为 0.00000208、0.00000205 和 0.00000202。特别是,收盘价低于 0.00000205 可能会导致该形态内出现回调,并形成低于 EMA 200 水平的结构。在这种情况下,狗狗币相对于比特币的价值将会下降。
The notable resistance levels to watch in the DOGE/BTC pair are 0.00000213, 0.00000216, and 0.00000219, respectively. In particular, a close above 0.00000219 could trigger a significant upward momentum for DOGE.
DOGE/BTC 货币对中值得注意的阻力位分别是 0.00000213、0.00000216 和 0.00000219。特别是,收盘价高于 0.00000219 可能会引发 DOGE 的显着上涨势头。

继续阅读:https://en.coin-turk.com/dogecoin-technical-analysis-key-levels-to-watch/


 crypto.ro English
 DogeHome
 Crypto News Land
 ETHNews
 CFN
CFN U_Today
 Thecoinrepublic.com
 Optimisus


