Technical analysis plays a crucial role in the cryptocurrency market, especially for investors trading in the futures market. So, what insights does technical analysis provide for Dogecoin, which is currently trading at $0.078? Let’s take a detailed look at the charts, important support and resistance levels.
기술적 분석은 암호화폐 시장, 특히 선물 시장에서 거래하는 투자자에게 중요한 역할을 합니다. 그렇다면 현재 0.078달러에 거래되고 있는 Dogecoin에 대해 기술적 분석은 어떤 통찰력을 제공합니까? 차트와 중요한 지지, 저항 수준을 자세히 살펴보겠습니다.
Dogecoin Daily Chart Analysis
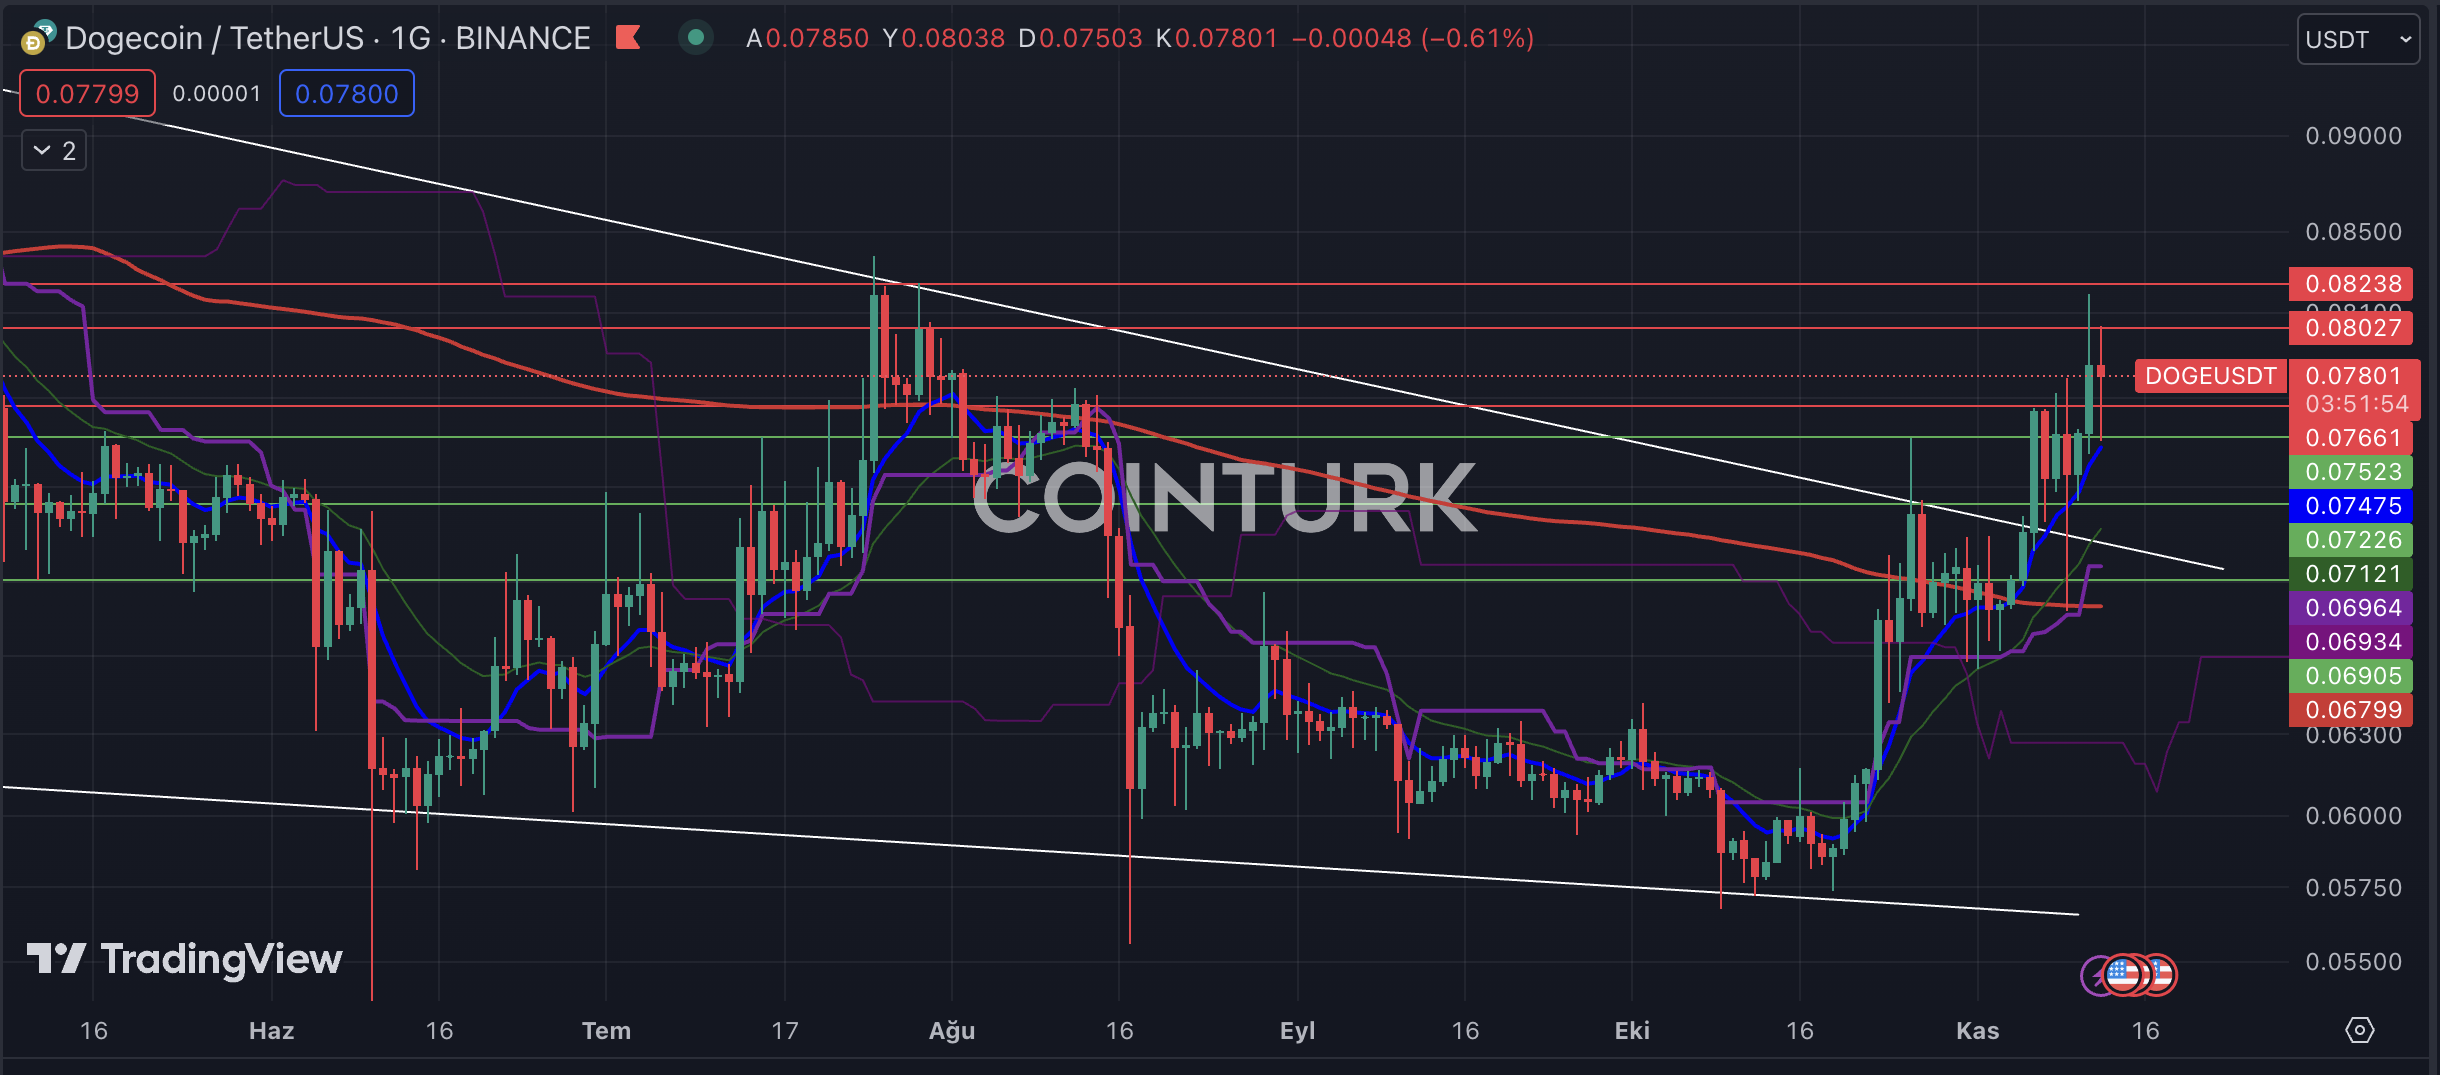
The Dogecoin daily chart reveals a notable breakout from a descending wedge formation, and after working as support, the resistance line led to a significant rise in DOGE. Additionally, the support provided by the EMA 200 (red line) during the drop on November 9 is a positive indicator for the DOGE price.
Dogecoin 일일 차트는 하강하는 쐐기 형태에서 눈에 띄는 돌파를 보여주며, 지지선으로 작용한 후 저항선이 DOGE의 상당한 상승으로 이어졌습니다. 또한 11월 9일 하락 기간 동안 EMA 200(빨간색 선)이 제공한 지원은 DOGE 가격에 대한 긍정적인 지표입니다.
The support levels to watch on the daily chart for DOGE are $0.07523, $0.07226, and $0.06905, respectively. A daily close below $0.06905 could lead to a significant decline in this area. In such a scenario, the support level at $0.05750 may come into play.
The notable resistance levels to watch on the daily chart for DOGE are $0.08027, $0.08238, and $0.08500, respectively. In particular, breaking the unbroken $0.08238 resistance level in the recent rally could trigger a potential bullish rally for DOGE. This, of course, can also be seen with the positive impact of news flow.

DOGE/BTC Chart Analysis
DOGE/BTC 차트 분석
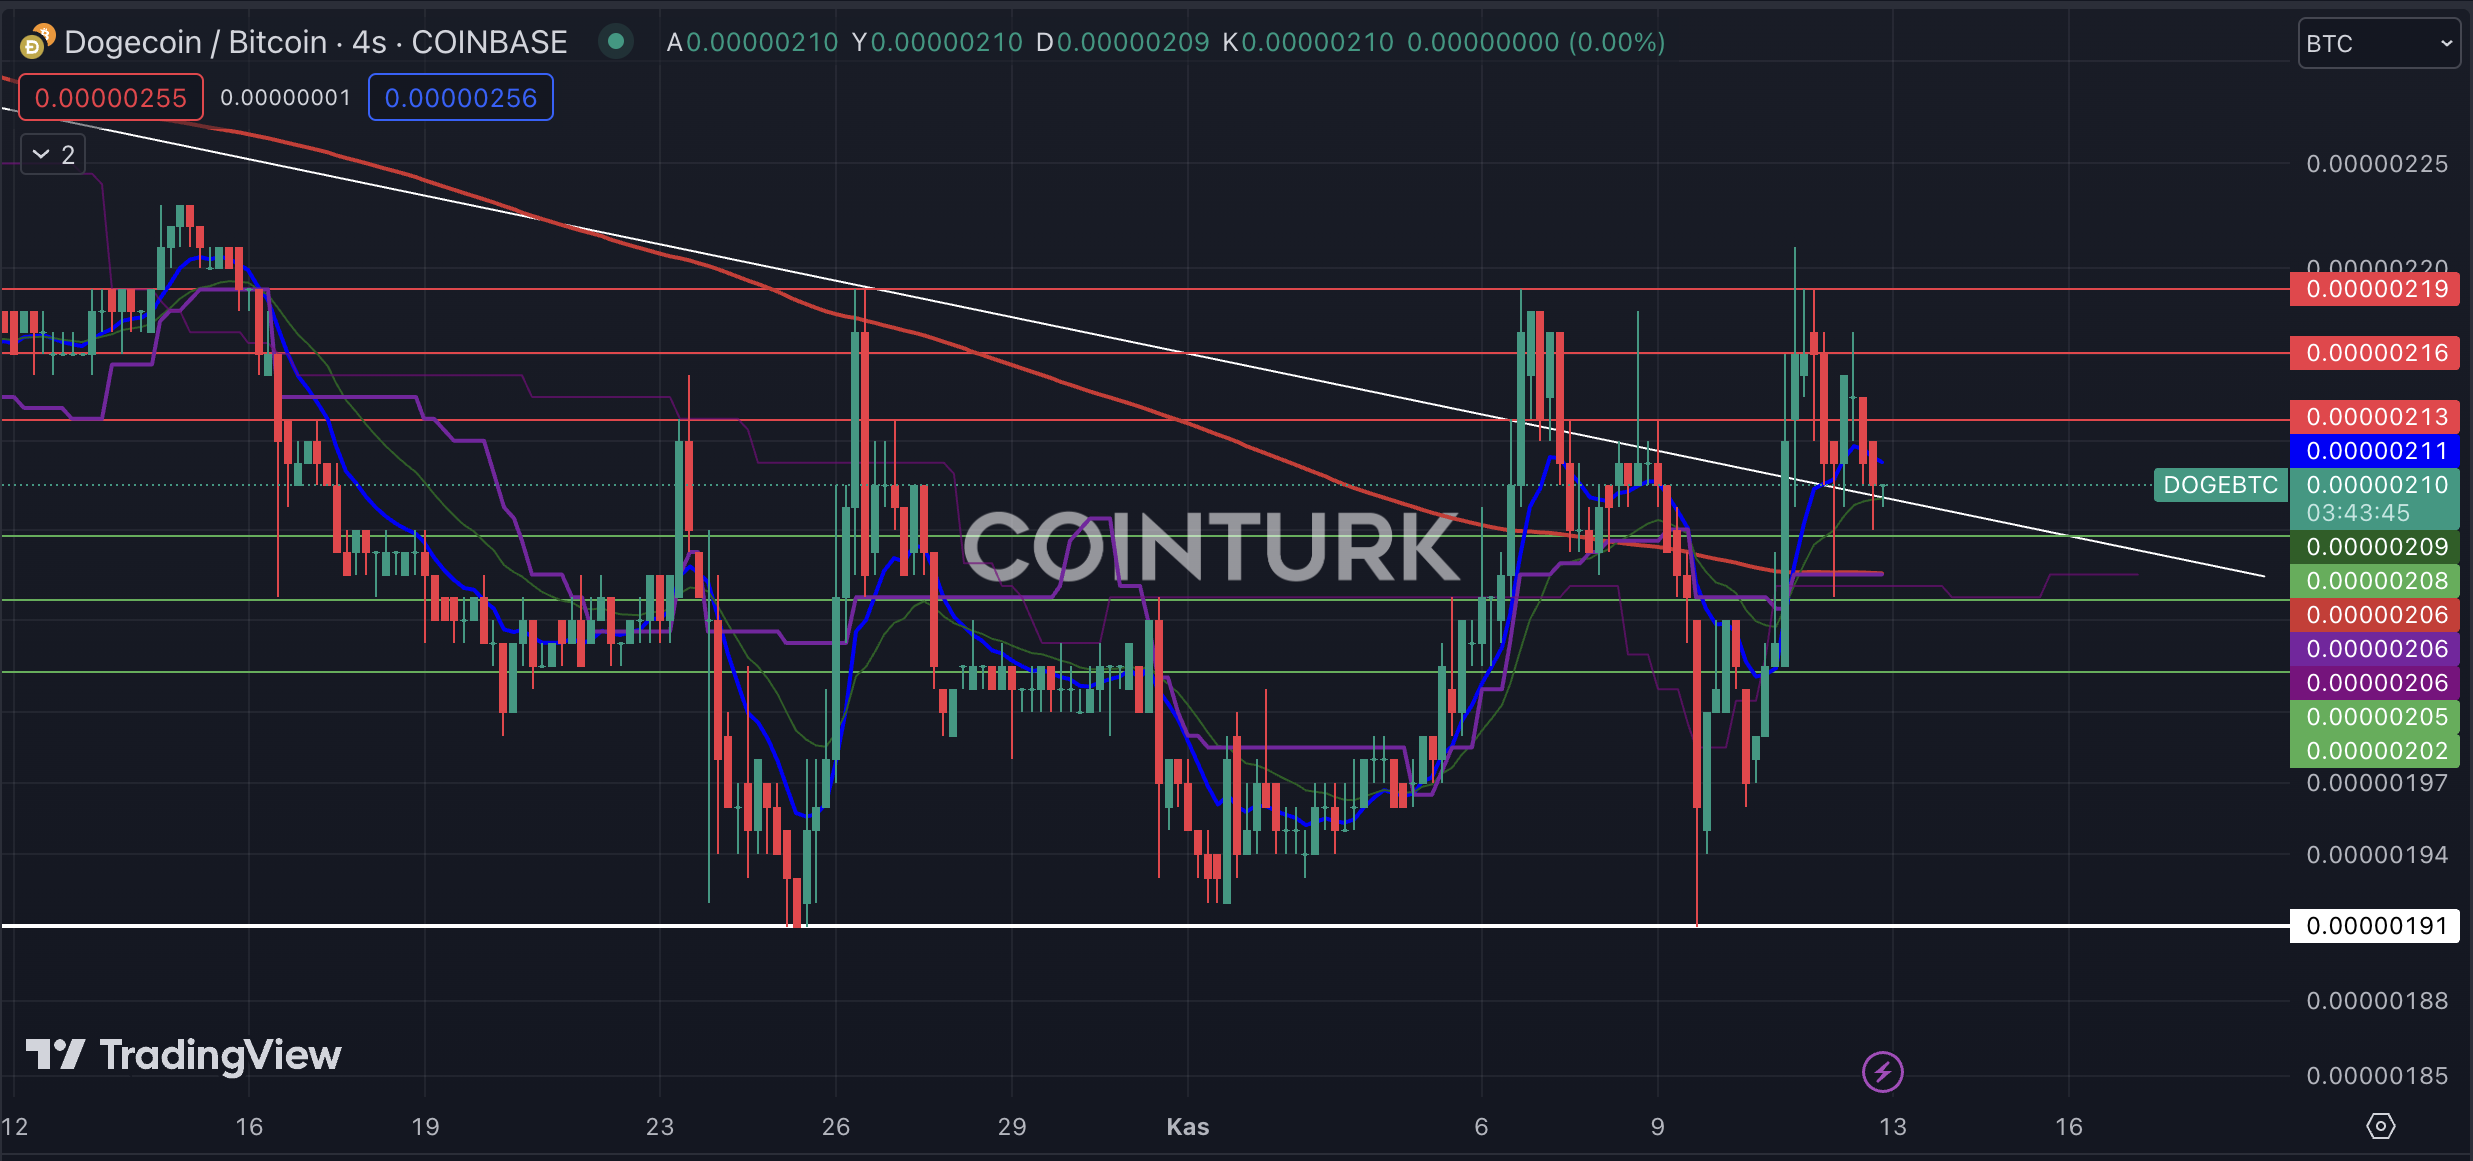
In the DOGE/BTC pair, there has been a recent breakout from a contracting triangle structure. The repeated support provided by the resistance line indicates a consolidation phase for DOGE. The recent support provided by the EMA 200 suggests a significant potential rise in this structure.
The support levels to watch in the DOGE/BTC pair are 0.00000208, 0.00000205, and 0.00000202, respectively. Especially, a close below 0.00000205 could lead to a retracement within the formation and the creation of a structure below the EMA 200 level. In such a case, DOGE would lose value against Bitcoin.
The notable resistance levels to watch in the DOGE/BTC pair are 0.00000213, 0.00000216, and 0.00000219, respectively. In particular, a close above 0.00000219 could trigger a significant upward momentum for DOGE.
DOGE/BTC 쌍에서 주목할만한 저항 수준은 각각 0.00000213, 0.00000216 및 0.00000219입니다. 특히 0.00000219를 넘어서는 마감은 DOGE의 상당한 상승 모멘텀을 촉발할 수 있습니다.

계속 읽기: https://en.coin-turk.com/dogecoin-technical-analytic-key-levels-to-watch/


 DogeHome
 Crypto News Land
 ETHNews
 CFN
CFN U_Today
 Thecoinrepublic.com
 Optimisus
 Optimisus


