Technical analysis plays a crucial role in the cryptocurrency market, especially for investors trading in the futures market. So, what insights does technical analysis provide for Dogecoin, which is currently trading at $0.078? Let’s take a detailed look at the charts, important support and resistance levels.
テクニカル分析は、暗号通貨市場、特に先物市場で取引する投資家にとって重要な役割を果たします。では、テクニカル分析は、現在0.078ドルで取引されているドージコインに対してどのような洞察を提供するのでしょうか?チャート、重要なサポートレベルとレジスタンスレベルを詳しく見てみましょう。
Dogecoin Daily Chart Analysis
ドージコイン日足チャート分析
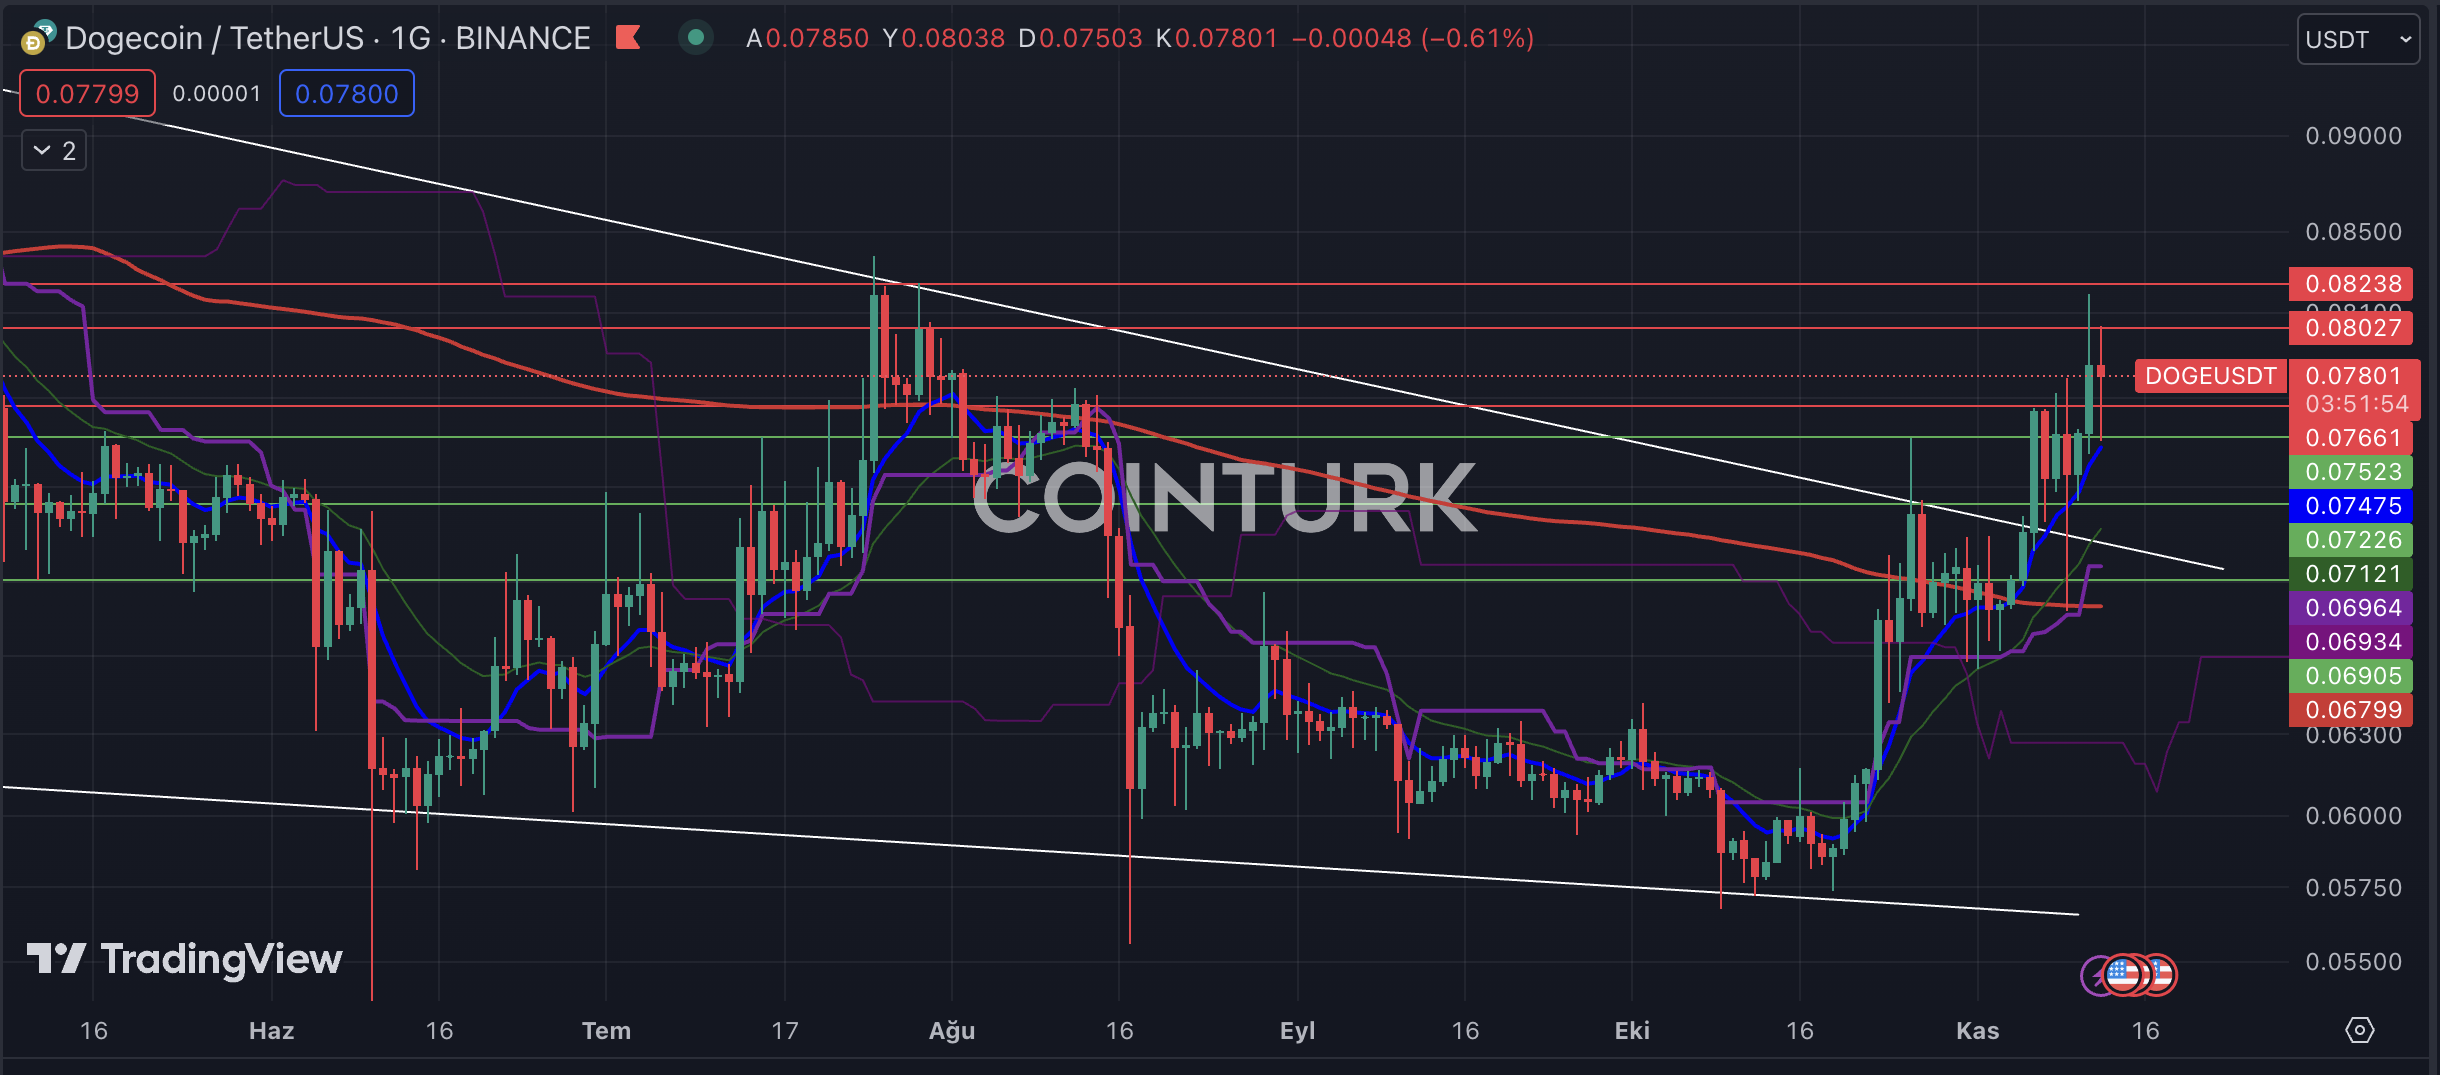
The Dogecoin daily chart reveals a notable breakout from a descending wedge formation, and after working as support, the resistance line led to a significant rise in DOGE. Additionally, the support provided by the EMA 200 (red line) during the drop on November 9 is a positive indicator for the DOGE price.
ドージコインの日足チャートは、下降ウェッジ形成からの顕著なブレイクアウトを明らかにしており、サポートとして機能した後、レジスタンスラインがDOGEの大幅な上昇につながりました。さらに、11月9日の下落中にEMA 200(赤い線)によってもたらされたサポートは、DOGE価格にとってポジティブな指標です。
The support levels to watch on the daily chart for DOGE are $0.07523, $0.07226, and $0.06905, respectively. A daily close below $0.06905 could lead to a significant decline in this area. In such a scenario, the support level at $0.05750 may come into play.
DOGEの日足チャートで注目すべきサポートレベルは、それぞれ0.07523ドル、0.07226ドル、0.06905ドルです。一日の終値が0.06905ドルを下回ると、この地域での大幅な下落につながる可能性がある。このようなシナリオでは、0.05750ドルのサポートレベルが機能する可能性があります。
The notable resistance levels to watch on the daily chart for DOGE are $0.08027, $0.08238, and $0.08500, respectively. In particular, breaking the unbroken $0.08238 resistance level in the recent rally could trigger a potential bullish rally for DOGE. This, of course, can also be seen with the positive impact of news flow.
DOGEの日足チャートで注目すべき抵抗レベルは、それぞれ0.08027ドル、0.08238ドル、0.08500ドルです。特に、最近の上昇で途切れることのない0.08238ドルの抵抗レベルを突破すると、DOGEの潜在的な強気上昇を引き起こす可能性があります。もちろん、これはニュースの流れのプラスの影響からも見ることができます。

DOGE/BTC Chart Analysis
DOGE/BTCチャート分析
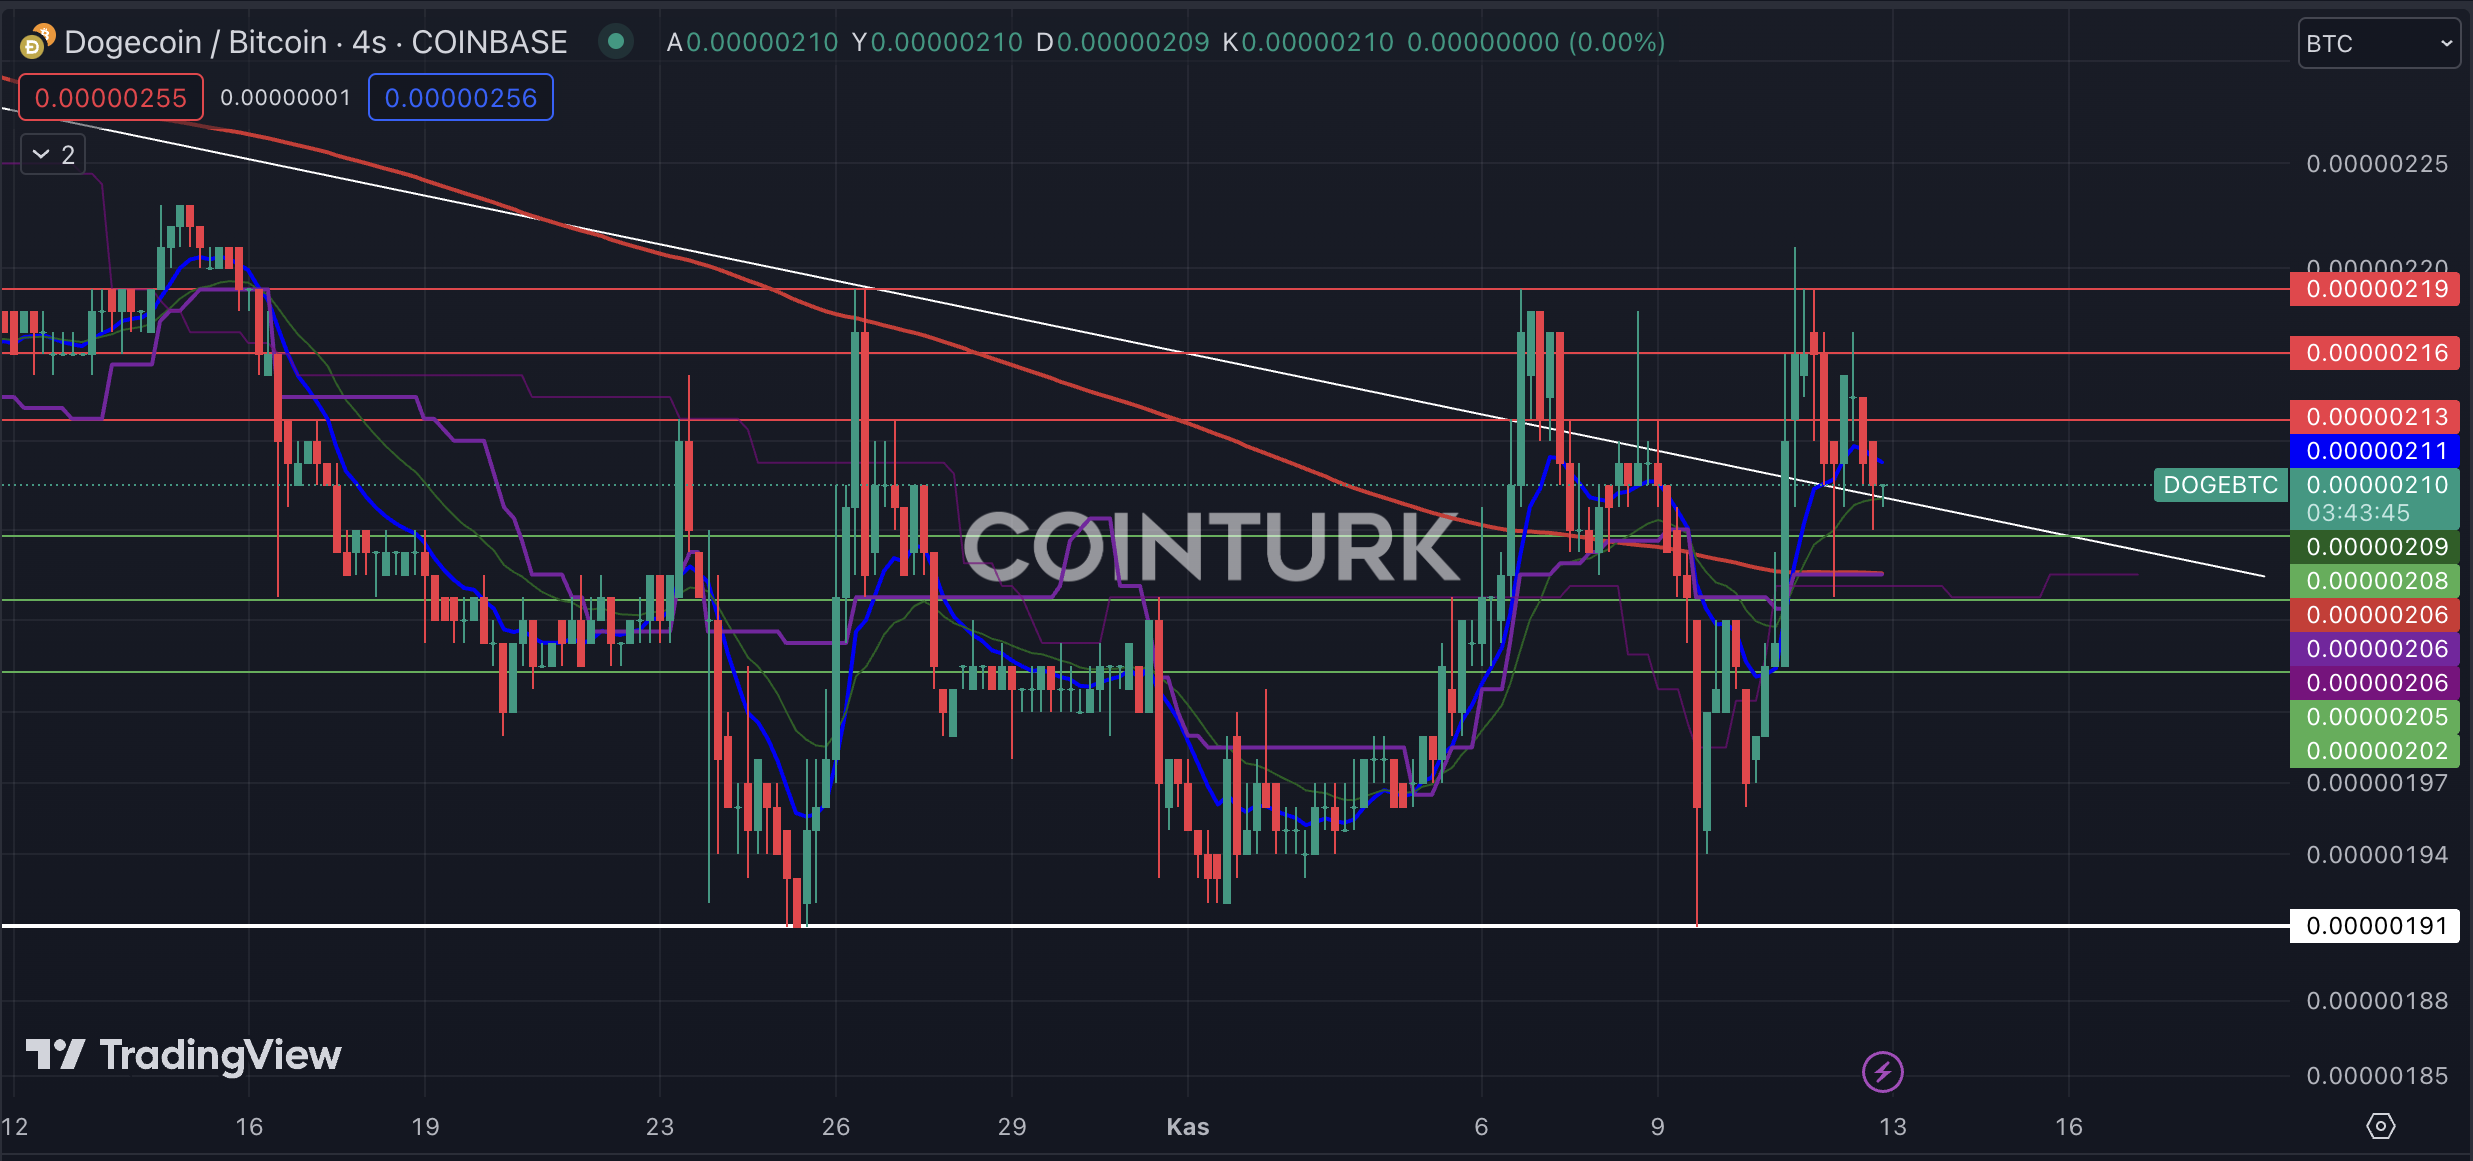
In the DOGE/BTC pair, there has been a recent breakout from a contracting triangle structure. The repeated support provided by the resistance line indicates a consolidation phase for DOGE. The recent support provided by the EMA 200 suggests a significant potential rise in this structure.
DOGE/BTC ペアでは、最近、縮小している三角構造からのブレイクアウトが見られます。レジスタンスラインによって繰り返し提供されるサポートは、DOGE の値固め段階を示しています。 EMA 200 によって提供された最近のサポートは、この構造が大幅に上昇する可能性を示唆しています。
The support levels to watch in the DOGE/BTC pair are 0.00000208, 0.00000205, and 0.00000202, respectively. Especially, a close below 0.00000205 could lead to a retracement within the formation and the creation of a structure below the EMA 200 level. In such a case, DOGE would lose value against Bitcoin.
DOGE/BTCペアで注目すべきサポートレベルは、それぞれ0.00000208、0.00000205、0.00000202です。特に、0.00000205を下回る終値は、フォーメーション内のリトレースメントとEMA 200レベルを下回る構造の作成につながる可能性があります。そのような場合、DOGEはビットコインに対して価値を失うことになります。
The notable resistance levels to watch in the DOGE/BTC pair are 0.00000213, 0.00000216, and 0.00000219, respectively. In particular, a close above 0.00000219 could trigger a significant upward momentum for DOGE.
DOGE/BTCペアで注目すべき抵抗レベルは、それぞれ0.00000213、0.00000216、0.00000219です。特に、0.00000219を超える終値はDOGEの大幅な上昇の勢いを引き起こす可能性があります。

続きを読む: https://en.coin-turk.com/dogecoin-technical-analysis-key-levels-to-watch/


 Cryptopolitan
 DogeHome
 crypto.ro English
 Crypto News Land
 ETHNews
 CFN
CFN U_Today
 Thecoinrepublic.com


