


The abrupt decline in the value of Bitcoin has taken many investors by surprise, prompting questions about the potential for further decreases in the future.
La abrupta caída del valor de Bitcoin ha tomado por sorpresa a muchos inversores, generando dudas sobre la posibilidad de nuevas caídas en el futuro.
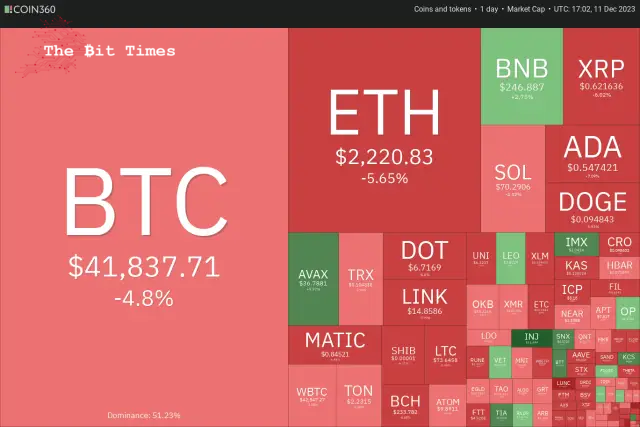
Bitcoin (BTC) concluded the previous week with a notable gain of 9.55%. However, the beginning of the new week saw a significant weakening as it dropped to nearly $40,500. This substantial downturn in Bitcoin’s value also led to liquidations in various alternative cryptocurrencies. Data from CoinGlass reveals that cross-crypto long liquidations on December 11 exceeded $300 million.
Bitcoin (BTC) concluyó la semana anterior con una notable ganancia del 9,55%. Sin embargo, al comienzo de la nueva semana se produjo un debilitamiento significativo, ya que cayó a casi 40.500 dólares. Esta importante caída del valor de Bitcoin también provocó liquidaciones de varias criptomonedas alternativas. Los datos de CoinGlass revelan que las liquidaciones largas entre criptomonedas el 11 de diciembre superaron los 300 millones de dólares.
It’s important to note that this sharp decline should not be seen as a departure from the prevailing trend in both Bitcoin and alternative cryptocurrencies. Corrections like this are an expected part of any upward trend. Rapid surges in value are typically followed by significant pullbacks, which weed out less resilient investors and create opportunities for long-term investors to purchase assets at lower prices.
Es importante señalar que esta fuerte caída no debe verse como una desviación de la tendencia predominante tanto en Bitcoin como en las criptomonedas alternativas. Correcciones como esta son una parte esperada de cualquier tendencia alcista. Los rápidos aumentos de valor suelen ir seguidos de importantes retrocesos, que eliminan a los inversores menos resilientes y crean oportunidades para que los inversores a largo plazo compren activos a precios más bajos.
The corrections are unlikely to stretch longer due to several bullish catalysts in 2024. Analysts expect one or more Bitcoin exchange-traded funds to receive regulatory approval in January, which could be a game changer. That will be followed by Bitcoin halving in April, and finally, expectations of a rate cut by the United States Federal Reserve could boost risky assets. Goldman Sachs anticipates the Fed will start cutting rates in the third quarter of 2024.
Es poco probable que las correcciones se prolonguen más debido a varios catalizadores alcistas en 2024. Los analistas esperan que uno o más fondos cotizados en bolsa de Bitcoin reciban la aprobación regulatoria en enero, lo que podría cambiar las reglas del juego. A esto le seguirá la reducción a la mitad de Bitcoin en abril y, finalmente, las expectativas de un recorte de tipos por parte de la Reserva Federal de los Estados Unidos podrían impulsar los activos de riesgo. Goldman Sachs anticipa que la Reserva Federal comenzará a recortar las tasas en el tercer trimestre de 2024.
What critical levels could arrest the fall in Bitcoin and altcoins? Let’s’ analyze the charts to find out.
¿Qué niveles críticos podrían frenar la caída de Bitcoin y altcoins? Analicemos los gráficos para averiguarlo.
S&P 500 Index (SPX) price analysis
Análisis de precios del índice S&P 500 (SPX)
The bulls have held the S&P 500 Index above the breakout level of 4,541 for several days. This suggests that the buyers are trying to flip the level into support.
Los alcistas han mantenido el índice S&P 500 por encima del nivel de ruptura de 4.541 durante varios días. Esto sugiere que los compradores están intentando convertir el nivel en soporte.
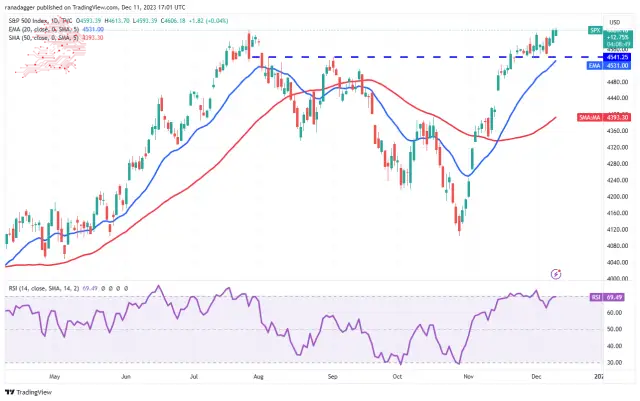
The upsloping 20-day exponential moving average (4,531) and the relative strength index (RSI) near the overbought zone indicate that the path of least resistance is to the upside. If buyers pierce the overhead resistance at 4,650, the index could increase momentum and surge to 4,800.
La media móvil exponencial ascendente de 20 días (4.531) y el índice de fuerza relativa (RSI) cerca de la zona de sobrecompra indican que el camino de menor resistencia es al alza. Si los compradores perforan la resistencia superior en 4.650, el índice podría aumentar su impulso y subir a 4.800.
This bullish view will be invalidated soon if the price turns down and plunges below the 20-day EMA. That will indicate aggressive selling at higher levels. The index may then tumble to the 50-day simple moving average (4,393).
Esta visión alcista quedará invalidada pronto si el precio baja y cae por debajo de la EMA de 20 días. Eso indicará ventas agresivas en niveles más altos. El índice podría entonces caer hasta la media móvil simple de 50 días (4.393).
U.S. Dollar Index (DXY) price analysis
Análisis de precios del índice del dólar estadounidense (DXY)
The U.S. Dollar Index bounced off the 61.8% Fibonacci retracement level of 102.55 on November 29, indicating buying at lower levels.
El índice del dólar estadounidense rebotó en el nivel de retroceso de Fibonacci del 61,8% de 102,55 el 29 de noviembre, lo que indica compras en niveles más bajos.
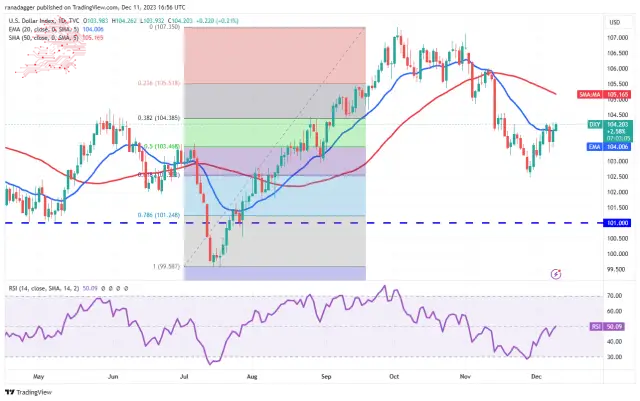
The relief rally has reached the 20-day EMA (104), where bears mount a stiff defence. A minor positive in favour of the bulls is that they have not allowed the price to dip much below the 20-day EMA.
El repunte del alivio ha llegado a la EMA de 20 días (104), donde los bajistas montan una dura defensa. Un pequeño aspecto positivo a favor de los alcistas es que no han permitido que el precio caiga muy por debajo de la EMA de 20 días.
There is a minor resistance at 104.50, but if this level is scaled, the index could rise to the 50-day SMA (105). The flattening 20-day EMA and the RSI near the midpoint suggest a range formation in the near term. The strong support on the downside is at 102.46.
Hay una resistencia menor en 104,50, pero si se escala este nivel, el índice podría subir hasta la SMA de 50 días (105). El aplanamiento de la EMA de 20 días y el RSI cerca del punto medio sugieren una formación de rango en el corto plazo. El fuerte soporte a la baja está en 102,46.
Bitcoin (BTC) price analysis
Análisis de precios de Bitcoin (BTC)
Bitcoin’s’ tight consolidation near $44,700 resolved to the downside on December 11. The failure to resume the up-move may have attracted selling by the traders.
La estrecha consolidación de Bitcoin cerca de $ 44,700 se resolvió a la baja el 11 de diciembre. La imposibilidad de reanudar el movimiento ascendente puede haber atraído ventas por parte de los comerciantes.
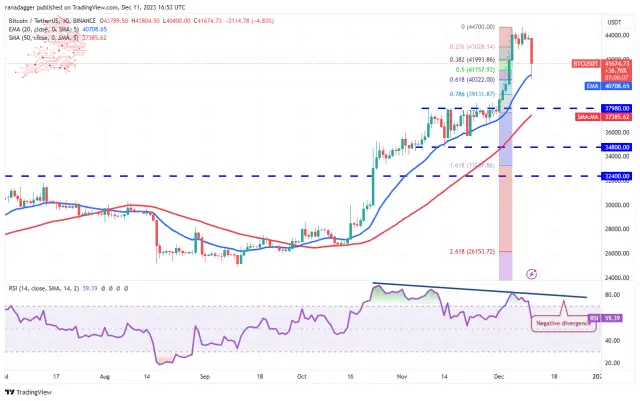
A minor positive in favour of the bulls is that the price rebounded off the 20-day EMA ($40,708), as seen from the long tail on the candlestick. Buyers will once again try to shove the BTC/USDT pair above $44,700, but the bears may not give up easily. The negative divergence on the RSI cautions that the bullish momentum is slowing down.
Un aspecto positivo menor a favor de los alcistas es que el precio se recuperó de la EMA de 20 días ($40,708), como se ve desde la cola larga de la vela. Los compradores intentarán una vez más empujar el par BTC/USDT por encima de los $44,700, pero es posible que los bajistas no se rindan fácilmente. La divergencia negativa del RSI advierte que el impulso alcista se está desacelerando.
If the price skids below the 20-day EMA, the correction could deepen to the breakout level of $37,980. This level is likely to attract solid buying by the bulls. On the upside, a break and close above $44,700 will indicate that the bulls are back in the driver’s seat.
Si el precio cae por debajo de la EMA de 20 días, la corrección podría profundizarse hasta el nivel de ruptura de $37,980. Es probable que este nivel atraiga compras sólidas por parte de los alcistas. Por el lado positivo, una ruptura y un cierre por encima de 44.700 dólares indicarán que los alcistas han vuelto a tomar el control.
Ethereum (ETH) price analysis
Análisis de precios de Ethereum (ETH)
Ethereum turned down from $2,403 on December 9 and plunged below the breakout level of $2,200 on December 11. This suggests that the bulls are rushing to the exit.
Ethereum bajó desde 2.403 dólares el 9 de diciembre y cayó por debajo del nivel de ruptura de 2.200 dólares el 11 de diciembre. Esto sugiere que los alcistas se apresuran hacia la salida.
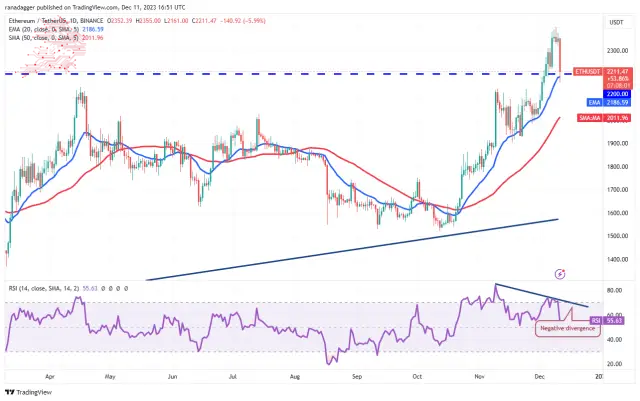
The price action of the past few days has formed a negative divergence on the RSI, indicating that the bullish momentum is weakening. Still, the bulls are vigorously trying to defend the 20-day EMA ($2,186).
La acción del precio de los últimos días ha formado una divergencia negativa en el RSI, lo que indica que el impulso alcista se está debilitando. Aun así, los alcistas están intentando vigorosamente defender la EMA de 20 días (2.186 dólares).
If the price bounces off the current level, the bulls will again try to resume the uptrend by pushing the ETH/USDT pair above $2,403. If they do that, the pair could rally to $2,500 and later to $3,000.
Si el precio rebota en el nivel actual, los alcistas volverán a intentar reanudar la tendencia alcista empujando el par ETH/USDT por encima de los $2,403. Si lo hacen, el par podría subir a 2.500 dólares y luego a 3.000 dólares.
This optimistic view will be invalidated if the price closes below the 20-day EMA. That may deepen the correction to the 50-day SMA ($2,012).
Esta visión optimista quedará invalidada si el precio cierra por debajo de la EMA de 20 días. Eso puede profundizar la corrección a la SMA de 50 días ($2,012).
BNB price analysis
Análisis de precios de BNB
BNB fue testigo de un patrón de velas exteriores el 11 de diciembre, lo que indica una dura batalla entre los alcistas y los bajistas.
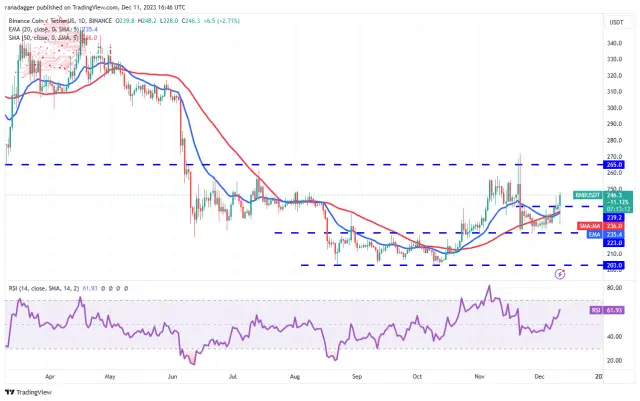
The long tail on the day’s candlestick shows aggressive buying at lower levels. If the price maintains above $239.2, the BNB/USDT pair will likely pick up momentum and soar to $265. This level may be difficult to cross, but if the buyers succeed, the pair will complete a bullish inverse head-and-shoulders pattern.
La cola larga de la vela del día muestra compras agresivas en niveles más bajos. Si el precio se mantiene por encima de $239,2, el par BNB/USDT probablemente tomará impulso y se disparará a $265. Este nivel puede ser difícil de cruzar, pero si los compradores tienen éxito, el par completará un patrón alcista inverso de cabeza y hombros.
The trend will favour the bears if they sink and sustain the price below $223. The pair may then slump to the pivotal support at $203.
La tendencia favorecerá a los bajistas si se hunden y mantienen el precio por debajo de 223 dólares. Luego, el par podría caer hasta el soporte fundamental de 203 dólares.
XRP price analysis
Análisis de precios XRP
XRP rose above the $0.67 resistance on December 8, but the bulls could not build upon this breakout on December 9. This suggests selling at higher levels.
XRP superó la resistencia de 0,67 dólares el 8 de diciembre, pero los alcistas no pudieron aprovechar esta ruptura del 9 de diciembre. Esto sugiere ventas a niveles más altos.
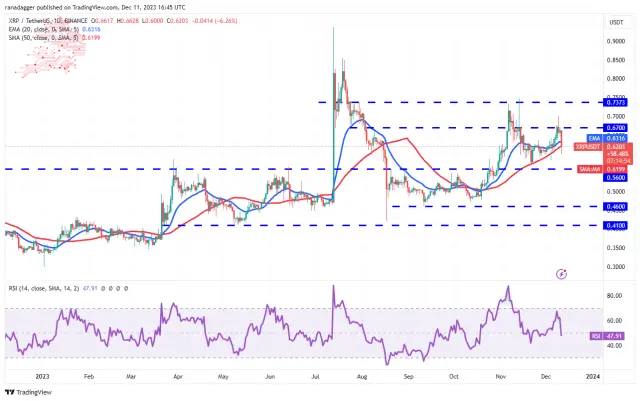
The bulls again tried to drive the price above $0.67 on December 10, but the bears held their ground. This started a sharp pullback, which dipped below the 50-day SMA ($0.62) on December 11. If the price closes below the 50-day SMA, the XRP/USDT pair could drop to the crucial support at $0.56.
Los alcistas volvieron a intentar llevar el precio por encima de 0,67 dólares el 10 de diciembre, pero los bajistas se mantuvieron firmes. Esto inició un fuerte retroceso, que cayó por debajo de la SMA de 50 días ($0,62) el 11 de diciembre. Si el precio cierra por debajo de la SMA de 50 días, el par XRP/USDT podría caer al soporte crucial de $0,56.
If the price rises from the current level, it will signal buying on dips. The bulls will then again try to overcome the obstacle at $0.67. If they do that, the pair may travel to $0.74, where the bears are expected to mount a strong defence.
Si el precio sube desde el nivel actual, indicará que se está comprando en las caídas. Los alcistas intentarán nuevamente superar el obstáculo de 0,67 dólares. Si lo hacen, el par puede subir a 0,74 dólares, donde se espera que los bajistas monten una fuerte defensa.
Solana (SOL) price analysis
Análisis de precios de Solana (SOL)
Solana is facing selling at the overhead hurdle of $78. The failure to scale this level may have started the pullback on December 11.
Solana se enfrenta a la venta con un obstáculo general de 78 dólares. La imposibilidad de escalar este nivel puede haber iniciado el retroceso el 11 de diciembre.
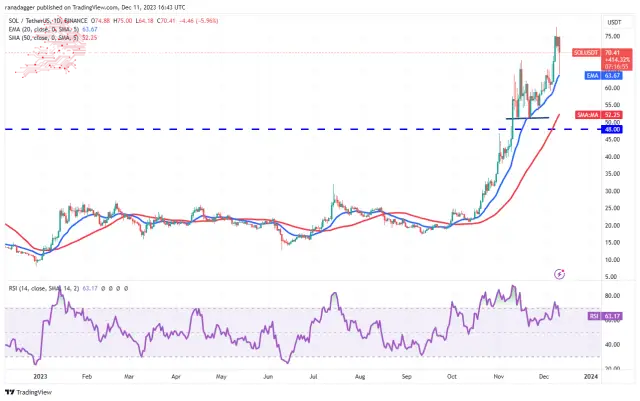
The SOL/USDT pair is finding support at the 20-day EMA ($63), indicating that lower levels continue to attract buyers. If bulls sustain the rebound, the pair could retest the high at $78. A break and close above this level could open the doors for a potential rally to the psychological level of $100.
El par SOL/USDT encuentra soporte en la EMA de 20 días ($63), lo que indica que los niveles más bajos continúan atrayendo compradores. Si los alcistas mantienen el rebote, el par podría volver a probar el máximo de 78 dólares. Una ruptura y un cierre por encima de este nivel podrían abrir las puertas a un posible repunte hasta el nivel psicológico de 100 dólares.
Bears must drag the price below the 20-day EMA if they want to prevent the rally. That may start a deeper correction toward the crucial support at $51.
Los bajistas deben arrastrar el precio por debajo de la EMA de 20 días si quieren evitar el repunte. Eso puede iniciar una corrección más profunda hacia el soporte crucial de 51 dólares.
Cardano (ADA) price analysis
Análisis de precios de Cardano (ADA)
Buyers pushed Cardano above the overhead resistance of $0.60 on Dec. 9 and 10 but could not maintain the higher levels.
Los compradores empujaron a Cardano por encima de la resistencia superior de 0,60 dólares los días 9 y 10 de diciembre, pero no pudieron mantener los niveles más altos.
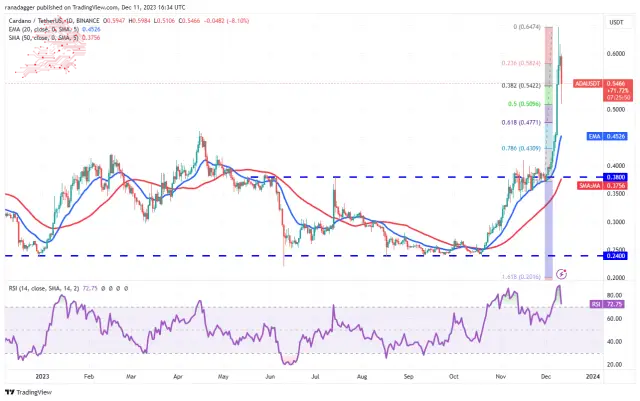
The up-move of the past few days propelled the RSI deep into the overbought zone, indicating that the rally was overextended in the near term. That may have tempted short-term bulls to book out on their positions, which started the pullback on December 11.
El movimiento alcista de los últimos días impulsó al RSI profundamente hacia la zona de sobrecompra, lo que indica que el repunte se extendió demasiado en el corto plazo. Esto puede haber tentado a los alcistas a corto plazo a reservar sus posiciones, lo que inició el retroceso el 11 de diciembre.
The ADA/USDT pair is trying to find support at the 50% Fibonacci retracement level of $0.51. If the level holds, buyers will again try to push the price to the local high of $0.65. On the other hand, a break below $0.51 could sink the pair to the 20-day EMA ($0.45).
El par ADA/USDT está tratando de encontrar soporte en el nivel de retroceso de Fibonacci del 50% de $0,51. Si el nivel se mantiene, los compradores intentarán nuevamente llevar el precio al máximo local de 0,65 dólares. Por otro lado, una ruptura por debajo de USD 0,51 podría hundir el par hasta la EMA de 20 días (USD 0,45).
Dogecoin (DOGE) price analysis
Análisis de precios de Dogecoin (DOGE)
The bears pose a solid challenge for Dogecoin’s rally at $0.11, as seen from the long wick on the December 11 candlestick.
Los bajistas representan un sólido desafío para el repunte de Dogecoin a 0,11 dólares, como se ve desde la mecha larga de la vela del 11 de diciembre.
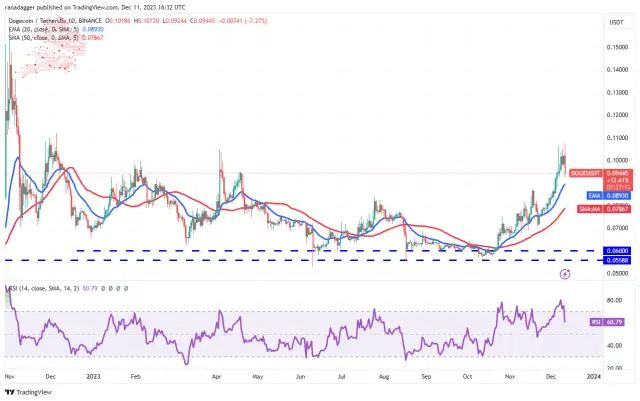
The price can pull down to the 20-day EMA ($0.09), a necessary level to watch out for. A strong bounce off the 20-day EMA will suggest that the sentiment remains positive and traders buy the dips. That increases the possibility of a break above $0.11. The DOGE/USDT pair may jump to $0.15 if that happens.
El precio puede caer hasta la EMA de 20 días ($0,09), un nivel necesario al que hay que prestar atención. Un fuerte rebote en la EMA de 20 días sugerirá que el sentimiento sigue siendo positivo y los operadores compran en las caídas. Eso aumenta la posibilidad de una ruptura por encima de 0,11 dólares. El par DOGE/USDT puede saltar a $0,15 si eso sucede.
On the contrary, a drop below the 20-day EMA will suggest that traders are aggressively booking profits. The pair may extend the decline to the 50-day SMA ($0.08).
Por el contrario, una caída por debajo de la EMA de 20 días sugerirá que los operadores están reservando ganancias de manera agresiva. El par puede extender la caída hasta la SMA de 50 días ($0,08).
Avalanche (AVAX) price analysis
Análisis de precios de Avalancha (AVAX)
Avalanche has been in a strong uptrend for the past several days. Buyers quickly cleared the barrier at $31 on December 9 and reached $38 on December 10.
Avalanche ha estado en una fuerte tendencia alcista durante los últimos días. Los compradores superaron rápidamente la barrera de 31 dólares el 9 de diciembre y alcanzaron los 38 dólares el 10 de diciembre.
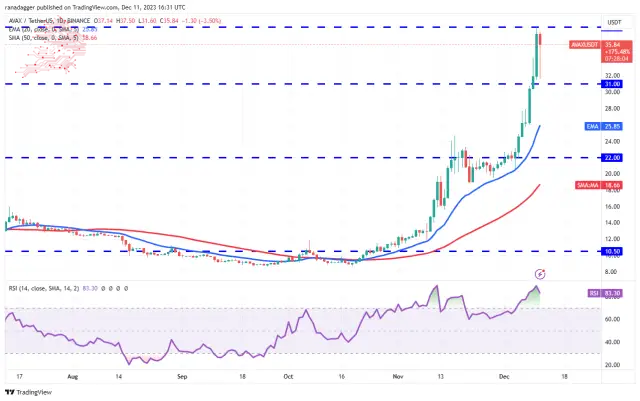
The vertical rally pushed the RSI deep into the overbought territory, signalling that a correction or consolidation is possible soon. The price pulled back on December 11, indicating that the short-term traders may be booking profits.
El repunte vertical empujó al RSI profundamente hacia el territorio de sobrecompra, lo que indica que pronto es posible una corrección o consolidación. El precio retrocedió el 11 de diciembre, lo que indica que los operadores a corto plazo pueden estar obteniendo ganancias.
If buyers do not allow the price to slip below $31, it will increase the likelihood of a rally above $38. The AVAX/USDT pair could climb to $46 and later to $50. Instead, if the price turns down and plummets below $31, it will suggest the start of a deeper correction to the 20-day EMA ($25.85).
Si los compradores no permiten que el precio caiga por debajo de 31 dólares, aumentará la probabilidad de un repunte por encima de 38 dólares. El par AVAX/USDT podría subir a $46 y luego a $50. En cambio, si el precio baja y cae por debajo de 31 dólares, sugerirá el inicio de una corrección más profunda en la EMA de 20 días (25,85 dólares).
Source – Rakesh Upadhyay
Fuente - Rakesh Upadhyay
Source: https://thebittimes.com/latest-market-overview-11th-dec-spx-dxy-btc-eth-bnb-xrp-sol-ada-doge-avax-tbt73397.html
Fuente: https://thebittimes.com/latest-market-overview-11th-dec-spx-dxy-btc-eth-bnb-xrp-sol-ada-doge-avax-tbt73397.html
 Crypto Intelligence
 DogeHome
 Crypto News Land
 Crypto Daily™
 Crypto Intelligence
 Crypto Daily™
 CaptainAltcoin
 Thecryptoupdates
 Crypto Intelligence


