The abrupt decline in the value of Bitcoin has taken many investors by surprise, prompting questions about the potential for further decreases in the future.
比特幣價值的突然下跌讓許多投資者感到意外,引發了人們對未來進一步下跌的可能性的質疑。
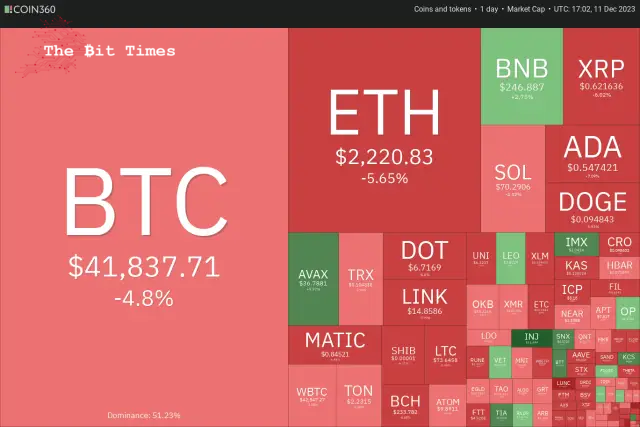
Bitcoin (BTC) concluded the previous week with a notable gain of 9.55%. However, the beginning of the new week saw a significant weakening as it dropped to nearly $40,500. This substantial downturn in Bitcoin’s value also led to liquidations in various alternative cryptocurrencies. Data from CoinGlass reveals that cross-crypto long liquidations on December 11 exceeded $300 million.
比特幣 (BTC) 上週上漲 9.55%。然而,新一周開始,價格大幅走軟,跌至近 40,500 美元。比特幣價值的大幅下跌也導致了各種替代加密貨幣的清算。 CoinGlass 的數據顯示,12 月 11 日跨幣種多頭清算額超過 3 億美元。
It’s important to note that this sharp decline should not be seen as a departure from the prevailing trend in both Bitcoin and alternative cryptocurrencies. Corrections like this are an expected part of any upward trend. Rapid surges in value are typically followed by significant pullbacks, which weed out less resilient investors and create opportunities for long-term investors to purchase assets at lower prices.
值得注意的是,這種大幅下跌不應被視為背離了比特幣和其他加密貨幣的普遍趨勢。像這樣的修正是任何上升趨勢的預期部分。價值快速飆升之後通常會出現大幅回調,從而淘汰掉彈性較差的投資者,並為長期投資者以較低價格購買資產創造機會。
The corrections are unlikely to stretch longer due to several bullish catalysts in 2024. Analysts expect one or more Bitcoin exchange-traded funds to receive regulatory approval in January, which could be a game changer. That will be followed by Bitcoin halving in April, and finally, expectations of a rate cut by the United States Federal Reserve could boost risky assets. Goldman Sachs anticipates the Fed will start cutting rates in the third quarter of 2024.
由於 2024 年出現多種看漲催化劑,修正不太可能持續更長時間。分析師預計,一個或多個比特幣交易所交易基金將在 1 月獲得監管部門的批准,這可能會改變遊戲規則。隨後比特幣將在四月減半,最後,對聯準會降息的預期可能會提振風險資產。高盛預計聯準會將於 2024 年第三季開始降息。
What critical levels could arrest the fall in Bitcoin and altcoins? Let’s’ analyze the charts to find out.
什麼關鍵水平可以阻止比特幣和山寨幣的下跌?讓我們分析一下圖表來找出答案。
S&P 500 Index (SPX) price analysis
標準普爾 500 指數 (SPX) 價格分析
The bulls have held the S&P 500 Index above the breakout level of 4,541 for several days. This suggests that the buyers are trying to flip the level into support.
多頭連續幾天將標準普爾 500 指數保持在 4,541 點的突破位上方。這表明買家正試圖將該水平轉變為支撐位。
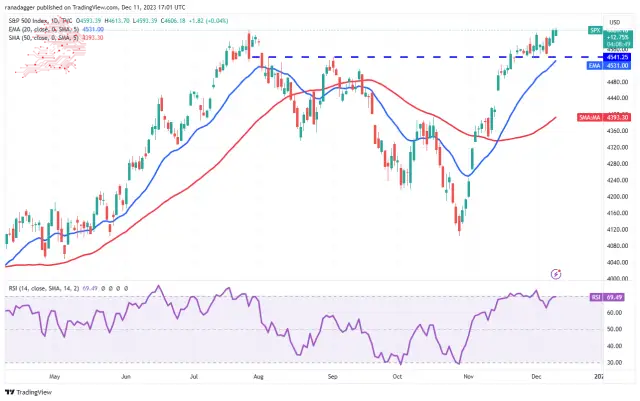
The upsloping 20-day exponential moving average (4,531) and the relative strength index (RSI) near the overbought zone indicate that the path of least resistance is to the upside. If buyers pierce the overhead resistance at 4,650, the index could increase momentum and surge to 4,800.
向上傾斜的 20 天指數移動平均線 (4,531) 和超買區附近的相對強弱指數 (RSI) 顯示阻力最小的路徑是上行。如果買家突破 4,650 點的上方阻力位,該指數可能會增加動力並飆升至 4,800 點。
This bullish view will be invalidated soon if the price turns down and plunges below the 20-day EMA. That will indicate aggressive selling at higher levels. The index may then tumble to the 50-day simple moving average (4,393).
如果價格下跌並跌破 20 日均線,這種看漲觀點很快就會失效。這將表明在更高水平上的激進拋售。隨後該指數可能會跌至 50 日簡單移動平均線(4,393)。
U.S. Dollar Index (DXY) price analysis
美元指數(DXY)價格分析
The U.S. Dollar Index bounced off the 61.8% Fibonacci retracement level of 102.55 on November 29, indicating buying at lower levels.
11月29日,美元指數從61.8%斐波那契回檔位102.55反彈,顯示在較低水準出現買盤。
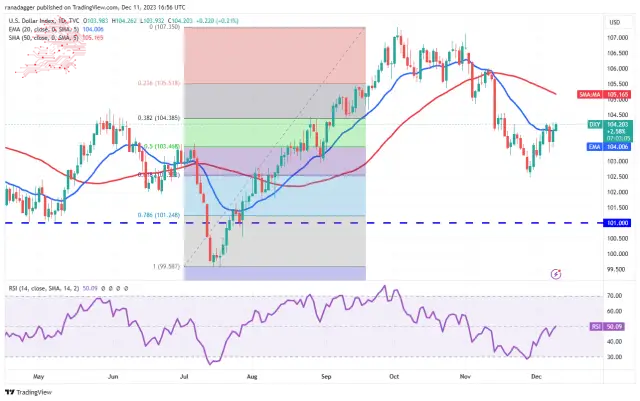
The relief rally has reached the 20-day EMA (104), where bears mount a stiff defence. A minor positive in favour of the bulls is that they have not allowed the price to dip much below the 20-day EMA.
緩解性反彈已觸及 20 日均線(104),空頭在此進行頑強防禦。對多頭有利的一個小積極因素是,他們不允許價格跌破 20 日均線。
There is a minor resistance at 104.50, but if this level is scaled, the index could rise to the 50-day SMA (105). The flattening 20-day EMA and the RSI near the midpoint suggest a range formation in the near term. The strong support on the downside is at 102.46.
104.50 處有一個小阻力,但如果突破該水平,該指數可能會升至 50 日移動平均線 (105)。趨平的 20 日均線和 RSI 接近中點表示近期將形成區間。下行強力支撐位於102.46。
Bitcoin (BTC) price analysis
比特幣(BTC)價格分析
Bitcoin’s’ tight consolidation near $44,700 resolved to the downside on December 11. The failure to resume the up-move may have attracted selling by the traders.
12 月 11 日,比特幣在 44,700 美元附近的緊張盤整最終走向下行。未能恢復上漲可能吸引了交易員的拋售。
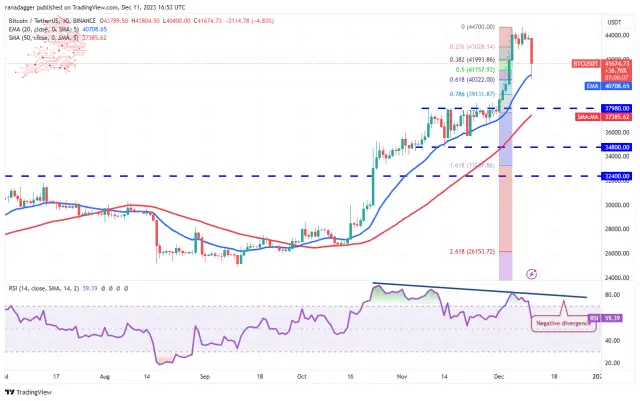
A minor positive in favour of the bulls is that the price rebounded off the 20-day EMA ($40,708), as seen from the long tail on the candlestick. Buyers will once again try to shove the BTC/USDT pair above $44,700, but the bears may not give up easily. The negative divergence on the RSI cautions that the bullish momentum is slowing down.
有利於多頭的一個小利好是,從燭台上的長尾可以看出,價格從 20 日均線(40,708 美元)反彈。買家將再次嘗試將 BTC/USDT 貨幣對推升至 44,700 美元上方,但空頭可能不會輕易放棄。 RSI 的負背離警告看漲勢頭正在放緩。
If the price skids below the 20-day EMA, the correction could deepen to the breakout level of $37,980. This level is likely to attract solid buying by the bulls. On the upside, a break and close above $44,700 will indicate that the bulls are back in the driver’s seat.
如果價格跌破 20 日均線,調整可能會深化至 37,980 美元的突破水準。這一水平可能會吸引多頭的大量買盤。從好的方面來看,突破並收盤於 44,700 美元之上將表明多頭重新佔據主導地位。
Ethereum (ETH) price analysis
以太坊(ETH)價格分析
Ethereum turned down from $2,403 on December 9 and plunged below the breakout level of $2,200 on December 11. This suggests that the bulls are rushing to the exit.
以太坊從 12 月 9 日的 2,403 美元回落,並於 12 月 11 日跌破 2,200 美元的突破水平。這表明多頭正在急於退出。
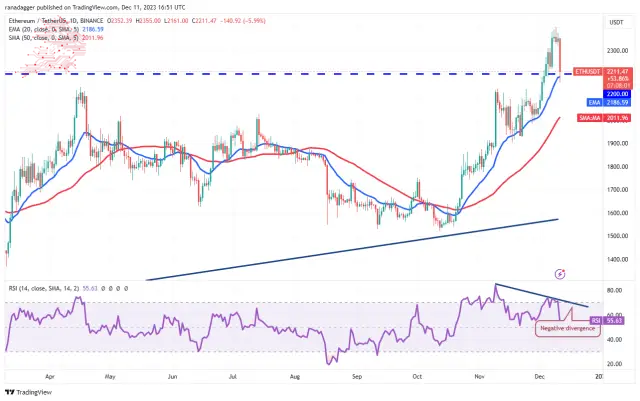
The price action of the past few days has formed a negative divergence on the RSI, indicating that the bullish momentum is weakening. Still, the bulls are vigorously trying to defend the 20-day EMA ($2,186).
過去幾天的價格走勢對RSI形成了負背離,顯示看漲勢頭正在減弱。儘管如此,多頭仍在積極努力捍衛 20 日均線(2,186 美元)。
If the price bounces off the current level, the bulls will again try to resume the uptrend by pushing the ETH/USDT pair above $2,403. If they do that, the pair could rally to $2,500 and later to $3,000.
如果價格從當前水準反彈,多頭將再次嘗試將 ETH/USDT 貨幣對推至 2,403 美元上方,以恢復上升趨勢。如果他們這樣做,該貨幣對可能會反彈至 2,500 美元,然後升至 3,000 美元。
This optimistic view will be invalidated if the price closes below the 20-day EMA. That may deepen the correction to the 50-day SMA ($2,012).
如果價格收盤低於 20 日均線,這種樂觀看法將會失效。這可能會加深對 50 日移動平均線(2,012 美元)的修正。
BNB price analysis
BNB價格分析
BNB 於 12 月 11 日見證了日外燭台形態,表明多頭和空頭之間正在展開一場艱苦的戰鬥。
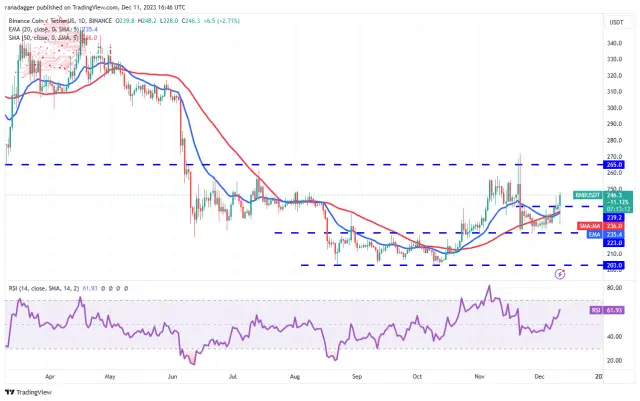
The long tail on the day’s candlestick shows aggressive buying at lower levels. If the price maintains above $239.2, the BNB/USDT pair will likely pick up momentum and soar to $265. This level may be difficult to cross, but if the buyers succeed, the pair will complete a bullish inverse head-and-shoulders pattern.
當天燭台上的長尾顯示出較低水準的激進買盤。如果價格維持在 239.2 美元上方,BNB/USDT 貨幣對可能會加速並飆升至 265 美元。該水平可能難以跨越,但如果買家成功,該貨幣對將完成看漲的反向頭肩形態。
The trend will favour the bears if they sink and sustain the price below $223. The pair may then slump to the pivotal support at $203.
如果空頭下跌並將價格維持在 223 美元以下,趨勢將有利於空頭。隨後該貨幣對可能會跌至關鍵支撐位 203 美元。
XRP price analysis
瑞波幣價格分析
XRP rose above the $0.67 resistance on December 8, but the bulls could not build upon this breakout on December 9. This suggests selling at higher levels.
XRP 於 12 月 8 日昇至 0.67 美元阻力位上方,但多頭無法在 12 月 9 日突破這一突破。這表明在更高水平上拋售。
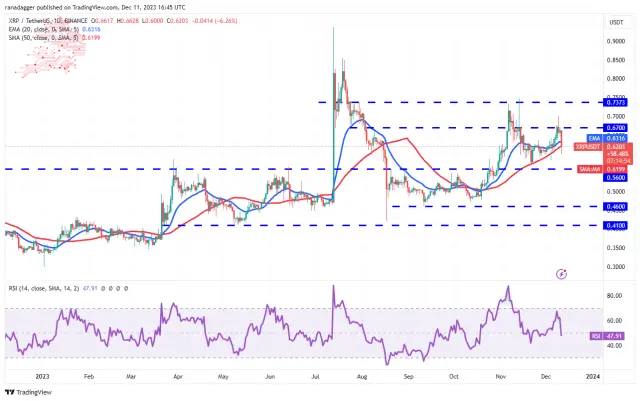
The bulls again tried to drive the price above $0.67 on December 10, but the bears held their ground. This started a sharp pullback, which dipped below the 50-day SMA ($0.62) on December 11. If the price closes below the 50-day SMA, the XRP/USDT pair could drop to the crucial support at $0.56.
12 月 10 日,多頭再次試圖將價格推升至 0.67 美元上方,但空頭堅守陣地。這開始了大幅回調,並於12 月11 日跌破50 日移動平均線(0.62 美元)。如果價格收於50 日移動平均線下方,XRP/USDT 貨幣對可能會跌至0.56 美元的關鍵支撐位。
If the price rises from the current level, it will signal buying on dips. The bulls will then again try to overcome the obstacle at $0.67. If they do that, the pair may travel to $0.74, where the bears are expected to mount a strong defence.
如果價格從目前水準上漲,則將發出逢低買入的訊號。多頭隨後將再次嘗試克服 0.67 美元的障礙。如果他們這樣做,該貨幣對可能會上漲至 0.74 美元,預計空頭將在此進行強有力的防禦。
Solana (SOL) price analysis
Solana (SOL) 價格分析
Solana is facing selling at the overhead hurdle of $78. The failure to scale this level may have started the pullback on December 11.
Solana 面臨著 78 美元的拋售門檻。未能突破這一水平可能是 12 月 11 日開始回調的原因。
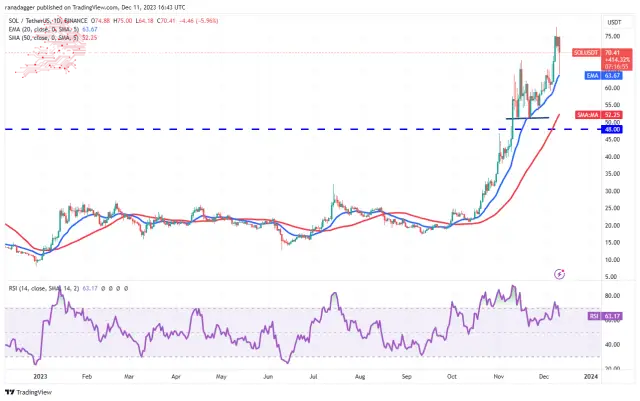
The SOL/USDT pair is finding support at the 20-day EMA ($63), indicating that lower levels continue to attract buyers. If bulls sustain the rebound, the pair could retest the high at $78. A break and close above this level could open the doors for a potential rally to the psychological level of $100.
SOL/USDT 貨幣對在 20 日均線(63 美元)處找到支撐,表明較低水平繼續吸引買家。如果多頭維持反彈,該貨幣對可能會重新測試 78 美元的高點。突破並收盤於該水平之上可能會打開潛在反彈至 100 美元心理水平的大門。
Bears must drag the price below the 20-day EMA if they want to prevent the rally. That may start a deeper correction toward the crucial support at $51.
如果空頭想要阻止反彈,就必須將價格拖至 20 日均線下方。這可能會開始對 51 美元的關鍵支撐位進行更深層的修正。
Cardano (ADA) price analysis
卡爾達諾(ADA)價格分析
Buyers pushed Cardano above the overhead resistance of $0.60 on Dec. 9 and 10 but could not maintain the higher levels.
12 月 9 日和 10 日,買家將卡爾達諾推升至 0.60 美元的上方阻力位,但無法維持較高水準。
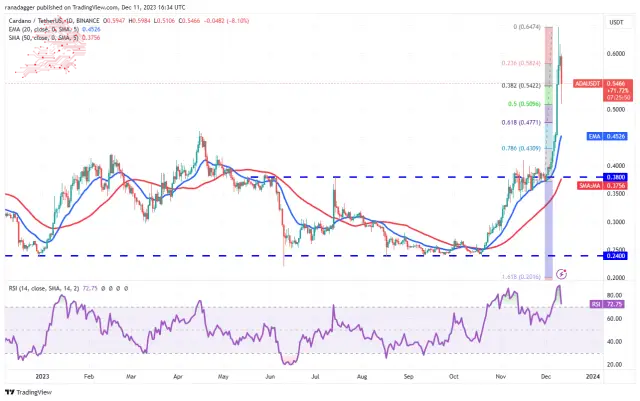
The up-move of the past few days propelled the RSI deep into the overbought zone, indicating that the rally was overextended in the near term. That may have tempted short-term bulls to book out on their positions, which started the pullback on December 11.
過去幾天的上漲推動RSI深入超買區域,顯示近期漲勢過度。這可能會吸引短期多頭結清頭寸,並於 12 月 11 日開始回調。
The ADA/USDT pair is trying to find support at the 50% Fibonacci retracement level of $0.51. If the level holds, buyers will again try to push the price to the local high of $0.65. On the other hand, a break below $0.51 could sink the pair to the 20-day EMA ($0.45).
ADA/USDT 貨幣對正試圖在 50% 斐波那契回檔位 0.51 美元處尋找支撐。如果該水平保持不變,買家將再次嘗試將價格推至局部高點 0.65 美元。另一方面,跌破 0.51 美元可能會使該貨幣對跌至 20 日均線(0.45 美元)。
Dogecoin (DOGE) price analysis
狗狗幣 (DOGE) 價格分析
The bears pose a solid challenge for Dogecoin’s rally at $0.11, as seen from the long wick on the December 11 candlestick.
從 12 月 11 日燭台上的長影線可以看出,空頭對狗狗幣 0.11 美元的反彈構成了堅實的挑戰。
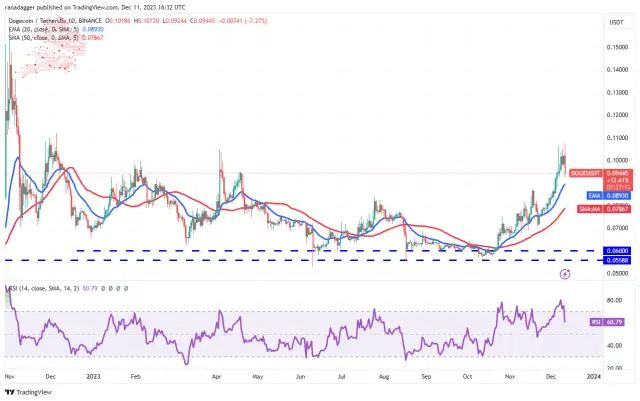
The price can pull down to the 20-day EMA ($0.09), a necessary level to watch out for. A strong bounce off the 20-day EMA will suggest that the sentiment remains positive and traders buy the dips. That increases the possibility of a break above $0.11. The DOGE/USDT pair may jump to $0.15 if that happens.
價格可能會跌至 20 日均線(0.09 美元),這是一個需要警惕的水平。從 20 日均線的強勁反彈將表明市場情緒依然樂觀,交易者逢低買入。這增加了突破 0.11 美元的可能性。如果發生這種情況,DOGE/USDT 貨幣對可能會跳至 0.15 美元。
On the contrary, a drop below the 20-day EMA will suggest that traders are aggressively booking profits. The pair may extend the decline to the 50-day SMA ($0.08).
相反,跌破 20 日均線將表示交易者正在積極獲利了結。該貨幣對可能會延續跌勢至 50 日移動平均線(0.08 美元)。
Avalanche (AVAX) price analysis
雪崩 (AVAX) 價格分析
Avalanche has been in a strong uptrend for the past several days. Buyers quickly cleared the barrier at $31 on December 9 and reached $38 on December 10.
Avalanche 在過去幾天一直處於強勁的上升趨勢。買家在 12 月 9 日迅速突破 31 美元的關口,並於 12 月 10 日達到 38 美元。
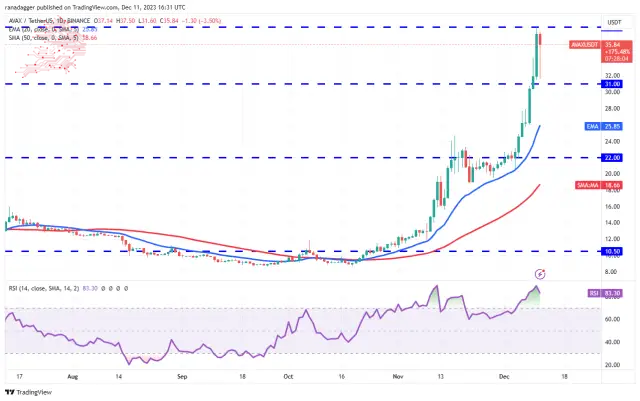
The vertical rally pushed the RSI deep into the overbought territory, signalling that a correction or consolidation is possible soon. The price pulled back on December 11, indicating that the short-term traders may be booking profits.
垂直反彈將 RSI 推入超買區域,表示可能很快就會出現調整或盤整。 12月11日價格回調,顯示短線交易者可能正在獲利了結。
If buyers do not allow the price to slip below $31, it will increase the likelihood of a rally above $38. The AVAX/USDT pair could climb to $46 and later to $50. Instead, if the price turns down and plummets below $31, it will suggest the start of a deeper correction to the 20-day EMA ($25.85).
如果買家不允許價格跌破 31 美元,那麼反彈至 38 美元以上的可能性就會增加。 AVAX/USDT 貨幣對可能會攀升至 46 美元,隨後升至 50 美元。相反,如果價格下跌並跌破 31 美元,則表示 20 日均線(25.85 美元)將開始深度修正。
Source – Rakesh Upadhyay
來源——Rakesh Upadhyay
Source: https://thebittimes.com/latest-market-overview-11th-dec-spx-dxy-btc-eth-bnb-xrp-sol-ada-doge-avax-tbt73397.html
資料來源:https://thebittimes.com/latest-market-overview-11th-dec-spx-dxy-btc-eth-bnb-xrp-sol-ada-doge-avax-tbt73397.html


 Optimisus
 Crypto News Land
 Optimisus
 Cryptopolitan_News
 DogeHome
 Cryptopolitan
 crypto.ro English


