


The abrupt decline in the value of Bitcoin has taken many investors by surprise, prompting questions about the potential for further decreases in the future.
비트코인 가치의 급격한 하락은 많은 투자자들을 놀라게 했으며, 향후 추가 하락 가능성에 대한 의문을 불러일으켰습니다.
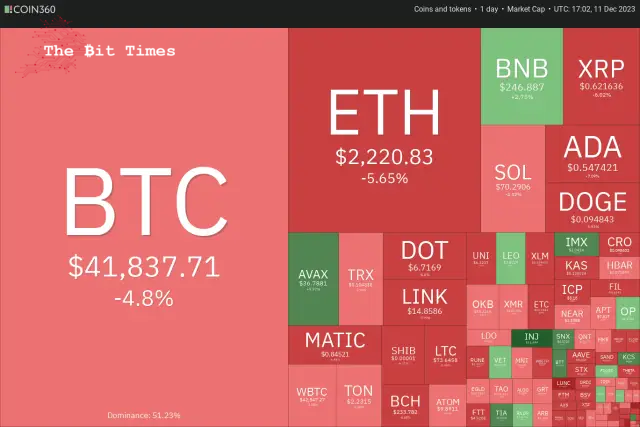
Bitcoin (BTC) concluded the previous week with a notable gain of 9.55%. However, the beginning of the new week saw a significant weakening as it dropped to nearly $40,500. This substantial downturn in Bitcoin’s value also led to liquidations in various alternative cryptocurrencies. Data from CoinGlass reveals that cross-crypto long liquidations on December 11 exceeded $300 million.
It’s important to note that this sharp decline should not be seen as a departure from the prevailing trend in both Bitcoin and alternative cryptocurrencies. Corrections like this are an expected part of any upward trend. Rapid surges in value are typically followed by significant pullbacks, which weed out less resilient investors and create opportunities for long-term investors to purchase assets at lower prices.
이러한 급격한 하락을 비트코인과 대체 암호화폐 모두의 일반적인 추세에서 벗어난 것으로 보아서는 안 된다는 점에 유의하는 것이 중요합니다. 이와 같은 조정은 상승 추세에서 예상되는 부분입니다. 급속한 가치 급등은 일반적으로 상당한 하락세로 이어지며, 이는 탄력성이 떨어지는 투자자를 제거하고 장기 투자자가 더 낮은 가격에 자산을 구매할 수 있는 기회를 창출합니다.
The corrections are unlikely to stretch longer due to several bullish catalysts in 2024. Analysts expect one or more Bitcoin exchange-traded funds to receive regulatory approval in January, which could be a game changer. That will be followed by Bitcoin halving in April, and finally, expectations of a rate cut by the United States Federal Reserve could boost risky assets. Goldman Sachs anticipates the Fed will start cutting rates in the third quarter of 2024.
What critical levels could arrest the fall in Bitcoin and altcoins? Let’s’ analyze the charts to find out.
비트코인과 알트코인의 하락을 막을 수 있는 중요한 수준은 무엇입니까? 알아보기 위해 차트를 분석해 보겠습니다.
S&P 500 Index (SPX) price analysis
The bulls have held the S&P 500 Index above the breakout level of 4,541 for several days. This suggests that the buyers are trying to flip the level into support.
강세론자들은 S&P 500 지수를 며칠 동안 돌파 수준인 4,541 이상으로 유지했습니다. 이는 구매자가 수준을 지지 수준으로 바꾸려고 노력하고 있음을 나타냅니다.
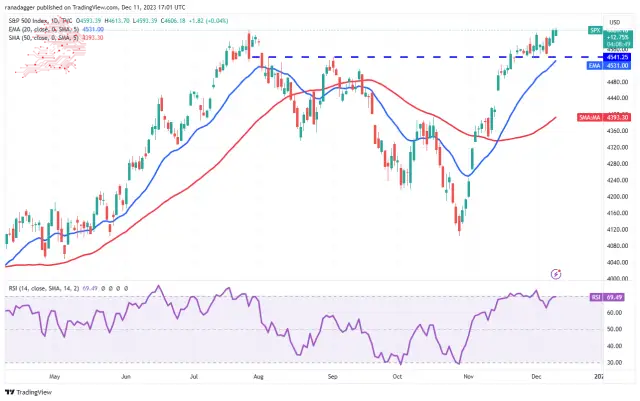
The upsloping 20-day exponential moving average (4,531) and the relative strength index (RSI) near the overbought zone indicate that the path of least resistance is to the upside. If buyers pierce the overhead resistance at 4,650, the index could increase momentum and surge to 4,800.
This bullish view will be invalidated soon if the price turns down and plunges below the 20-day EMA. That will indicate aggressive selling at higher levels. The index may then tumble to the 50-day simple moving average (4,393).
가격이 하락하고 20일 EMA 아래로 떨어지면 이러한 강세 전망은 곧 무효화됩니다. 이는 더 높은 수준에서 공격적인 매도를 의미합니다. 이후 지수는 50일 단순 이동 평균(4,393)까지 하락할 수 있습니다.
U.S. Dollar Index (DXY) price analysis
The U.S. Dollar Index bounced off the 61.8% Fibonacci retracement level of 102.55 on November 29, indicating buying at lower levels.
미국 달러 지수는 11월 29일 61.8% 피보나치 되돌림 수준인 102.55에서 반등하여 더 낮은 수준에서 매수했음을 나타냅니다.
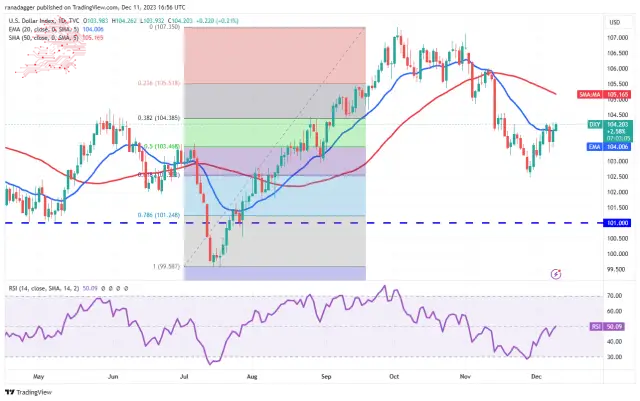
The relief rally has reached the 20-day EMA (104), where bears mount a stiff defence. A minor positive in favour of the bulls is that they have not allowed the price to dip much below the 20-day EMA.
안도랠리가 20일간의 EMA(104)에 도달했는데, 여기서 곰은 강세를 보이고 있습니다. 강세에 유리한 작은 긍정적인 점은 가격이 20일 EMA 아래로 크게 떨어지는 것을 허용하지 않았다는 것입니다.
There is a minor resistance at 104.50, but if this level is scaled, the index could rise to the 50-day SMA (105). The flattening 20-day EMA and the RSI near the midpoint suggest a range formation in the near term. The strong support on the downside is at 102.46.
Bitcoin (BTC) price analysis
비트코인(BTC) 가격 분석
Bitcoin’s’ tight consolidation near $44,700 resolved to the downside on December 11. The failure to resume the up-move may have attracted selling by the traders.
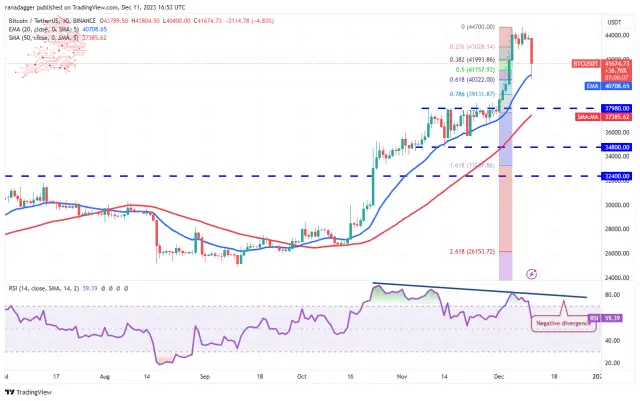
A minor positive in favour of the bulls is that the price rebounded off the 20-day EMA ($40,708), as seen from the long tail on the candlestick. Buyers will once again try to shove the BTC/USDT pair above $44,700, but the bears may not give up easily. The negative divergence on the RSI cautions that the bullish momentum is slowing down.
If the price skids below the 20-day EMA, the correction could deepen to the breakout level of $37,980. This level is likely to attract solid buying by the bulls. On the upside, a break and close above $44,700 will indicate that the bulls are back in the driver’s seat.
가격이 20일 EMA 아래로 미끄러지면 조정은 $37,980의 돌파 수준까지 심화될 수 있습니다. 이 수준은 황소의 견고한 매수를 유도할 가능성이 높습니다. 긍정적인 측면에서는 $44,700를 넘는 돌파 및 종가는 상승세가 다시 주도권을 잡았다는 것을 의미합니다.
Ethereum (ETH) price analysis
Ethereum turned down from $2,403 on December 9 and plunged below the breakout level of $2,200 on December 11. This suggests that the bulls are rushing to the exit.
이더리움은 12월 9일 2,403달러에서 하락했고 12월 11일에는 돌파 수준인 2,200달러 아래로 떨어졌습니다. 이는 상승세가 출구로 돌진하고 있음을 시사합니다.
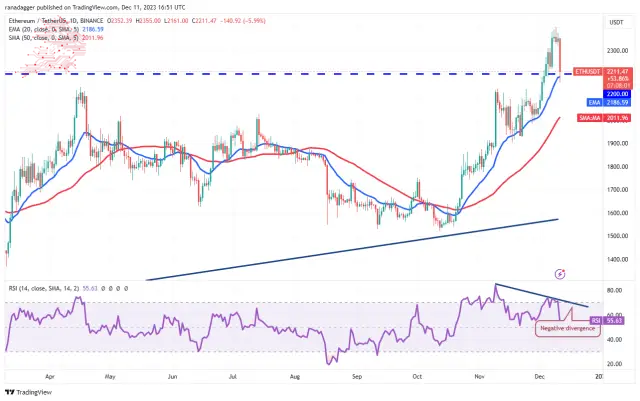
The price action of the past few days has formed a negative divergence on the RSI, indicating that the bullish momentum is weakening. Still, the bulls are vigorously trying to defend the 20-day EMA ($2,186).
If the price bounces off the current level, the bulls will again try to resume the uptrend by pushing the ETH/USDT pair above $2,403. If they do that, the pair could rally to $2,500 and later to $3,000.
가격이 현재 수준에서 반등하면 강세론자들은 ETH/USDT 쌍을 $2,403 이상으로 올려 상승 추세를 재개하려고 다시 시도할 것입니다. 그렇게 한다면 그 쌍은 $2,500까지 상승할 수 있고 나중에는 $3,000까지 상승할 수 있습니다.
This optimistic view will be invalidated if the price closes below the 20-day EMA. That may deepen the correction to the 50-day SMA ($2,012).
가격이 20일 EMA 아래로 마감되면 이러한 낙관적인 견해는 무효화됩니다. 이는 50일 SMA(2,012달러)에 대한 조정을 심화시킬 수 있습니다.
BNB price analysis
BNB 가격 분석
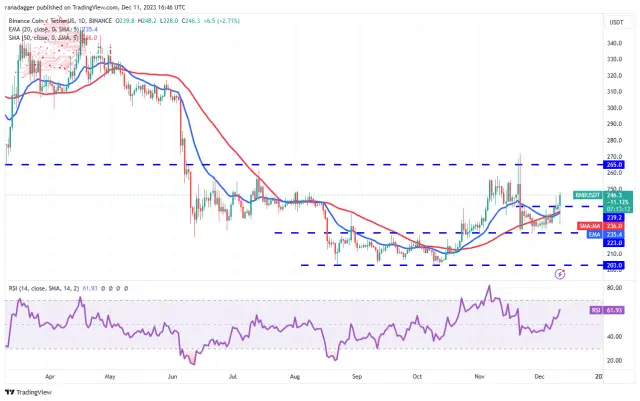
The long tail on the day’s candlestick shows aggressive buying at lower levels. If the price maintains above $239.2, the BNB/USDT pair will likely pick up momentum and soar to $265. This level may be difficult to cross, but if the buyers succeed, the pair will complete a bullish inverse head-and-shoulders pattern.
당일 캔들의 긴 꼬리는 낮은 수준에서 공격적인 매수를 보여줍니다. 가격이 $239.2 이상으로 유지된다면 BNB/USDT 쌍은 탄력을 받아 $265까지 급등할 가능성이 높습니다. 이 수준은 교차하기 어려울 수 있지만 구매자가 성공하면 쌍은 강세 역 헤드앤숄더 패턴을 완성하게 됩니다.
The trend will favour the bears if they sink and sustain the price below $223. The pair may then slump to the pivotal support at $203.
XRP price analysis
XRP rose above the $0.67 resistance on December 8, but the bulls could not build upon this breakout on December 9. This suggests selling at higher levels.
XRP는 12월 8일에 0.67달러 저항선을 넘어섰지만 12월 9일의 이러한 돌파를 기반으로 상승세는 이어지지 못했습니다. 이는 더 높은 수준의 매도를 의미합니다.
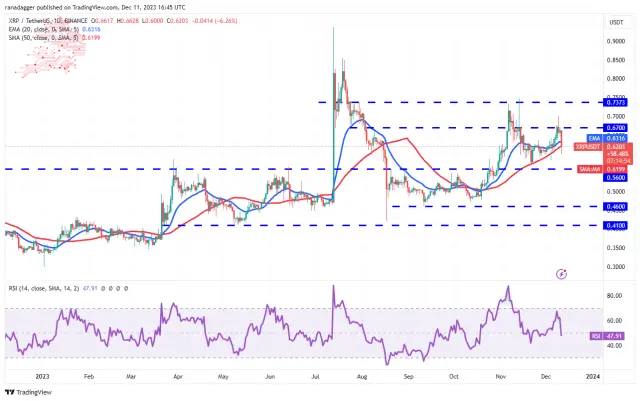
The bulls again tried to drive the price above $0.67 on December 10, but the bears held their ground. This started a sharp pullback, which dipped below the 50-day SMA ($0.62) on December 11. If the price closes below the 50-day SMA, the XRP/USDT pair could drop to the crucial support at $0.56.
If the price rises from the current level, it will signal buying on dips. The bulls will then again try to overcome the obstacle at $0.67. If they do that, the pair may travel to $0.74, where the bears are expected to mount a strong defence.
가격이 현재 수준에서 상승하면 하락 시 매수 신호가 됩니다. 그런 다음 상승세는 $0.67에서 다시 장애물을 극복하려고 시도할 것입니다. 그렇게 하면 하락세가 강력한 방어력을 발휘할 것으로 예상되는 $0.74까지 이동할 수 있습니다.
Solana (SOL) price analysis
솔라나(SOL) 가격 분석
Solana is facing selling at the overhead hurdle of $78. The failure to scale this level may have started the pullback on December 11.
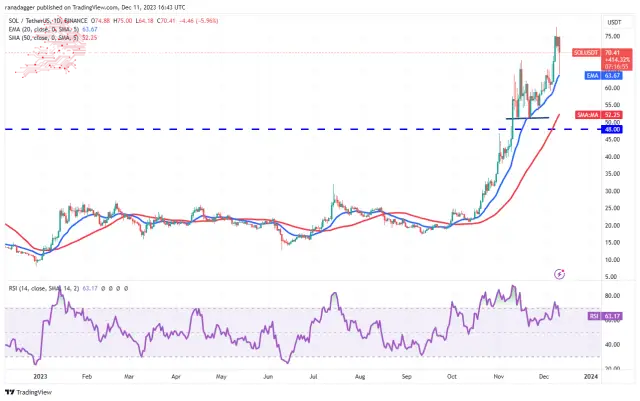
The SOL/USDT pair is finding support at the 20-day EMA ($63), indicating that lower levels continue to attract buyers. If bulls sustain the rebound, the pair could retest the high at $78. A break and close above this level could open the doors for a potential rally to the psychological level of $100.
SOL/USDT 쌍은 20일 EMA(63달러)에서 지지를 받고 있으며, 이는 낮은 수준이 계속해서 구매자를 끌어들이고 있음을 나타냅니다. 황소가 반등을 지속한다면 쌍은 $78의 최고치를 다시 테스트할 수 있습니다. 이 수준을 넘어 종가를 형성하면 심리적 수준인 100달러까지 상승할 수 있는 문이 열릴 수 있습니다.
Bears must drag the price below the 20-day EMA if they want to prevent the rally. That may start a deeper correction toward the crucial support at $51.
Cardano (ADA) price analysis
Buyers pushed Cardano above the overhead resistance of $0.60 on Dec. 9 and 10 but could not maintain the higher levels.
구매자들은 12월 9일과 10일에 Cardano를 간접 저항인 $0.60 위로 밀어붙였으나 더 높은 수준을 유지하지 못했습니다.
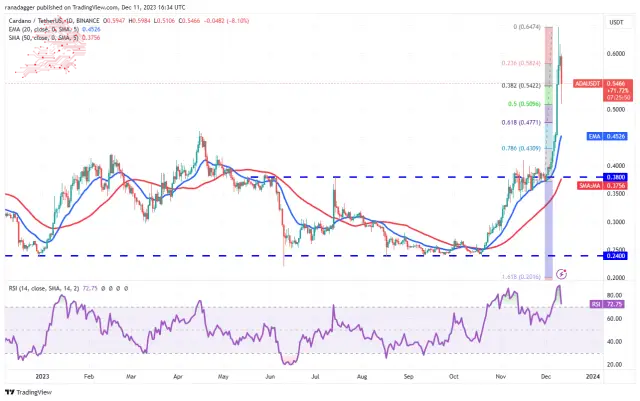
The up-move of the past few days propelled the RSI deep into the overbought zone, indicating that the rally was overextended in the near term. That may have tempted short-term bulls to book out on their positions, which started the pullback on December 11.
지난 며칠 동안의 상승세로 인해 RSI가 과매수 영역 깊숙이 들어섰고, 이는 단기적으로 랠리가 과도하게 확장되었음을 나타냅니다. 이는 단기 강세자들이 12월 11일 하락세를 시작한 포지션을 포기하도록 유혹했을 수도 있습니다.
The ADA/USDT pair is trying to find support at the 50% Fibonacci retracement level of $0.51. If the level holds, buyers will again try to push the price to the local high of $0.65. On the other hand, a break below $0.51 could sink the pair to the 20-day EMA ($0.45).
Dogecoin (DOGE) price analysis
도지코인(DOGE) 가격 분석
The bears pose a solid challenge for Dogecoin’s rally at $0.11, as seen from the long wick on the December 11 candlestick.
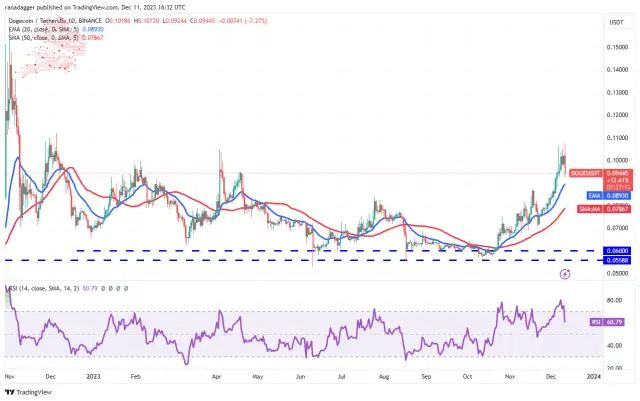
The price can pull down to the 20-day EMA ($0.09), a necessary level to watch out for. A strong bounce off the 20-day EMA will suggest that the sentiment remains positive and traders buy the dips. That increases the possibility of a break above $0.11. The DOGE/USDT pair may jump to $0.15 if that happens.
가격은 주의해야 할 수준인 20일 EMA($0.09)까지 하락할 수 있습니다. 20일 EMA의 강력한 반등은 정서가 여전히 긍정적이고 트레이더가 하락세를 매수한다는 것을 의미합니다. 이는 $0.11 이상의 휴식 가능성을 증가시킵니다. 그런 일이 발생하면 DOGE/USDT 쌍이 0.15달러로 점프할 수 있습니다.
On the contrary, a drop below the 20-day EMA will suggest that traders are aggressively booking profits. The pair may extend the decline to the 50-day SMA ($0.08).
Avalanche (AVAX) price analysis
Avalanche(AVAX) 가격 분석
Avalanche has been in a strong uptrend for the past several days. Buyers quickly cleared the barrier at $31 on December 9 and reached $38 on December 10.
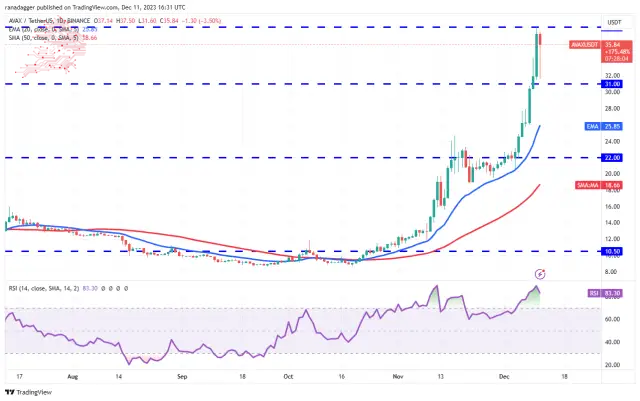
The vertical rally pushed the RSI deep into the overbought territory, signalling that a correction or consolidation is possible soon. The price pulled back on December 11, indicating that the short-term traders may be booking profits.
수직 랠리로 인해 RSI가 과매수 영역 깊숙이 들어가면서 곧 조정이나 횡보가 가능함을 알렸습니다. 12월 11일 가격이 하락하여 단기 거래자들이 이익을 얻을 수 있음을 나타냅니다.
If buyers do not allow the price to slip below $31, it will increase the likelihood of a rally above $38. The AVAX/USDT pair could climb to $46 and later to $50. Instead, if the price turns down and plummets below $31, it will suggest the start of a deeper correction to the 20-day EMA ($25.85).
Source – Rakesh Upadhyay
Source: https://thebittimes.com/latest-market-overview-11th-dec-spx-dxy-btc-eth-bnb-xrp-sol-ada-doge-avax-tbt73397.html
출처: https://thebittimes.com/latest-market-overview-11th-dec-spx-dxy-btc-eth-bnb-xrp-sol-ada-doge-avax-tbt73397.html
 Crypto News Land
 Optimisus
 Cryptopolitan_News
 DogeHome
 Cryptopolitan
 crypto.ro English
 Crypto News Land


