The abrupt decline in the value of Bitcoin has taken many investors by surprise, prompting questions about the potential for further decreases in the future.
ビットコインの価値の突然の下落は多くの投資家を驚かせ、将来さらに下落する可能性についての疑問を引き起こしています。
Bitcoin (BTC) concluded the previous week with a notable gain of 9.55%. However, the beginning of the new week saw a significant weakening as it dropped to nearly $40,500. This substantial downturn in Bitcoin’s value also led to liquidations in various alternative cryptocurrencies. Data from CoinGlass reveals that cross-crypto long liquidations on December 11 exceeded $300 million.
ビットコイン(BTC)は9.55%の顕著な上昇で前週を終えた。しかし、新しい週の初めには大幅な下落が見られ、40,500ドル近くまで下落しました。このビットコイン価値の大幅な下落は、さまざまな代替仮想通貨の清算にもつながりました。 CoinGlassのデータによると、12月11日の仮想通貨間のロング清算額が3億ドルを超えたことが明らかになった。
It’s important to note that this sharp decline should not be seen as a departure from the prevailing trend in both Bitcoin and alternative cryptocurrencies. Corrections like this are an expected part of any upward trend. Rapid surges in value are typically followed by significant pullbacks, which weed out less resilient investors and create opportunities for long-term investors to purchase assets at lower prices.
この急激な下落は、ビットコインと代替仮想通貨の両方の一般的なトレンドから逸脱したものとみなされるべきではないことに注意することが重要です。このような調整は上昇傾向の一部として予想されます。通常、価値の急騰の後には大幅な下落が起こり、回復力の弱い投資家が淘汰され、長期投資家がより低い価格で資産を購入する機会が生まれます。
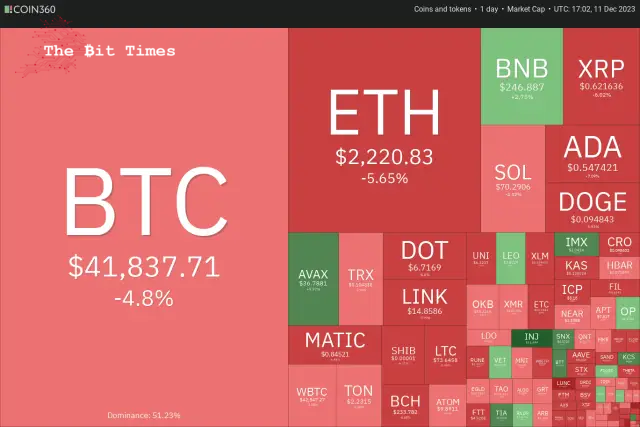
The corrections are unlikely to stretch longer due to several bullish catalysts in 2024. Analysts expect one or more Bitcoin exchange-traded funds to receive regulatory approval in January, which could be a game changer. That will be followed by Bitcoin halving in April, and finally, expectations of a rate cut by the United States Federal Reserve could boost risky assets. Goldman Sachs anticipates the Fed will start cutting rates in the third quarter of 2024.
2024年にいくつかの強気のきっかけがあったため、調整がさらに長期化する可能性は低い。アナリストらは、1月に1つ以上のビットコイン上場投資信託が規制当局の承認を受けると予想しており、それがゲームチェンジャーとなる可能性がある。それに続いて4月にはビットコインが半減し、最後に米連邦準備制度理事会による利下げ期待がリスク資産を押し上げる可能性がある。ゴールドマン・サックスは、FRBが2024年の第3四半期に利下げを開始すると予想しています。
What critical levels could arrest the fall in Bitcoin and altcoins? Let’s’ analyze the charts to find out.
ビットコインとアルトコインの下落を阻止できる重大なレベルは何でしょうか?チャートを分析して調べてみましょう。
S&P 500 Index (SPX) price analysis
S&P 500 インデックス (SPX) 価格分析
The bulls have held the S&P 500 Index above the breakout level of 4,541 for several days. This suggests that the buyers are trying to flip the level into support.
強気派はここ数日間、S&P 500指数をブレイクアウトレベルの4,541を上回って維持している。これは、買い手がレベルをサポートに反転させようとしていることを示唆しています。
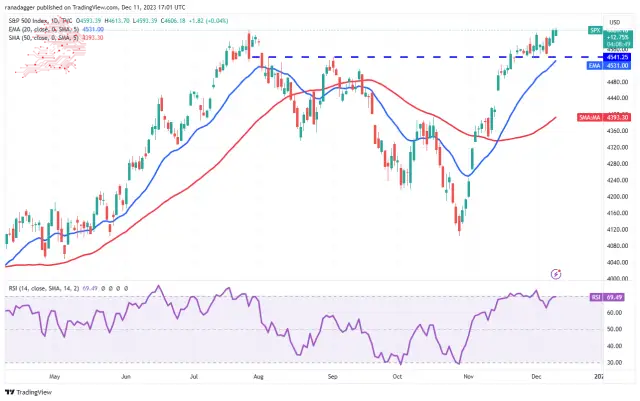
The upsloping 20-day exponential moving average (4,531) and the relative strength index (RSI) near the overbought zone indicate that the path of least resistance is to the upside. If buyers pierce the overhead resistance at 4,650, the index could increase momentum and surge to 4,800.
上昇傾向の 20 日間指数移動平均 (4,531) と買われ過ぎゾーン付近の相対力指数 (RSI) は、抵抗が最も少ない経路が上値に向かうことを示しています。買い手が4,650の頭上の抵抗線を突破すれば、指数は勢いを増し4,800まで急上昇する可能性がある。
This bullish view will be invalidated soon if the price turns down and plunges below the 20-day EMA. That will indicate aggressive selling at higher levels. The index may then tumble to the 50-day simple moving average (4,393).
価格が下落して20日間EMAを下回ると、この強気の見方はすぐに無効になるだろう。それはより高いレベルでの積極的な売りを示唆するでしょう。その後、指数は 50 日単純移動平均 (4,393) まで下落する可能性があります。
U.S. Dollar Index (DXY) price analysis
米ドルインデックス (DXY) 価格分析
The U.S. Dollar Index bounced off the 61.8% Fibonacci retracement level of 102.55 on November 29, indicating buying at lower levels.
米ドル指数は11月29日の61.8%フィボナッチ・リトレースメント水準102.55から反発し、より低い水準での買いが入っていることを示している。
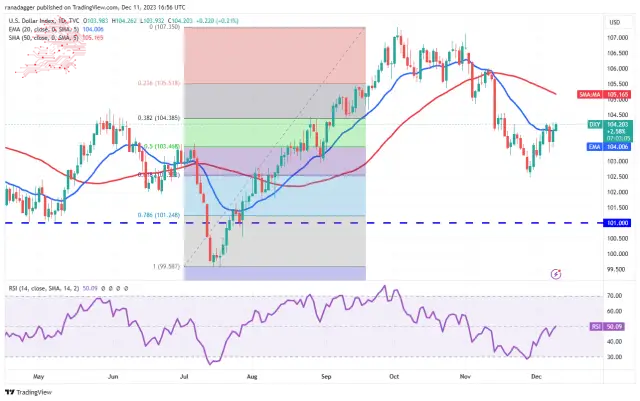
The relief rally has reached the 20-day EMA (104), where bears mount a stiff defence. A minor positive in favour of the bulls is that they have not allowed the price to dip much below the 20-day EMA.
救済の回復は20日間EMA(104)に達しており、クマは堅固な防御を敷いている。強気派に有利なわずかなプラスは、価格が20日間EMAを大幅に下回ることを許容していないことだ。
There is a minor resistance at 104.50, but if this level is scaled, the index could rise to the 50-day SMA (105). The flattening 20-day EMA and the RSI near the midpoint suggest a range formation in the near term. The strong support on the downside is at 102.46.
104.50に小さな抵抗線がありますが、このレベルが調整される場合、指数は50日SMA(105)まで上昇する可能性があります。平坦化している 20 日間 EMA と中間点付近の RSI は、短期的にレンジが形成されることを示唆しています。下値支持線は102.46にある。
Bitcoin (BTC) price analysis
ビットコイン(BTC)価格分析
Bitcoin’s’ tight consolidation near $44,700 resolved to the downside on December 11. The failure to resume the up-move may have attracted selling by the traders.
ビットコインの44,700ドル付近での厳しい値固めは12月11日に下値に解消された。上昇を再開できなかったことがトレーダーらの売りを引き付けた可能性がある。
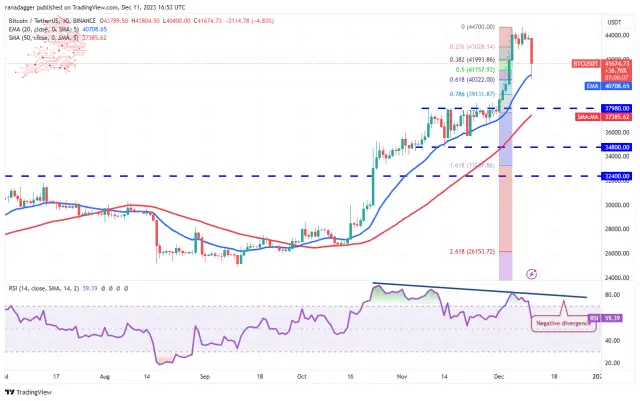
A minor positive in favour of the bulls is that the price rebounded off the 20-day EMA ($40,708), as seen from the long tail on the candlestick. Buyers will once again try to shove the BTC/USDT pair above $44,700, but the bears may not give up easily. The negative divergence on the RSI cautions that the bullish momentum is slowing down.
強気派に有利なわずかなプラスは、ローソク足のロングテールから分かるように、価格が20日間EMA(4万708ドル)から反発したことだ。買い手は再びBTC/USDTペアを44,700ドル以上に押し上げようとするだろうが、弱気派は簡単には諦めないかもしれない。 RSIのマイナスの乖離は、強気の勢いが鈍化しつつあることを警告しています。
If the price skids below the 20-day EMA, the correction could deepen to the breakout level of $37,980. This level is likely to attract solid buying by the bulls. On the upside, a break and close above $44,700 will indicate that the bulls are back in the driver’s seat.
価格が20日間EMAを下回った場合、調整は37,980ドルのブレイクアウトレベルまで深まる可能性があります。この水準は強気派による堅調な買いを呼び込む可能性が高い。上値としては、44,700ドルを超えて終値を迎えることは、強気派が主導権を握ったことを示すだろう。
Ethereum (ETH) price analysis
イーサリアム(ETH)価格分析
Ethereum turned down from $2,403 on December 9 and plunged below the breakout level of $2,200 on December 11. This suggests that the bulls are rushing to the exit.
イーサリアムは12月9日の2,403ドルから下落し、12月11日にはブレイクアウトレベルの2,200ドルを下回りました。これは強気派が出口に急いでいることを示唆しています。
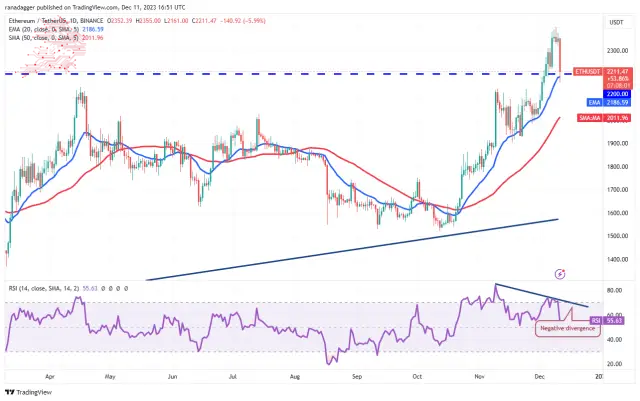
The price action of the past few days has formed a negative divergence on the RSI, indicating that the bullish momentum is weakening. Still, the bulls are vigorously trying to defend the 20-day EMA ($2,186).
過去数日間の価格動向はRSIにマイナスのダイバージェンスを形成しており、強気の勢いが弱まっていることを示しています。それでも、強気派は20日間EMA(2,186ドル)を守ろうと精力的に努めている。
If the price bounces off the current level, the bulls will again try to resume the uptrend by pushing the ETH/USDT pair above $2,403. If they do that, the pair could rally to $2,500 and later to $3,000.
価格が現在の水準から反発した場合、強気派はETH/USDTペアを2,403ドル以上に押し上げることで再び上昇トレンドを再開しようとするだろう。そうすれば、ペアは2,500ドルまで上昇し、その後は3,000ドルまで上昇する可能性がある。
This optimistic view will be invalidated if the price closes below the 20-day EMA. That may deepen the correction to the 50-day SMA ($2,012).
価格が20日間EMAを下回って終了した場合、この楽観的な見方は無効になります。これにより、50日SMA(2,012ドル)への調整がさらに深まる可能性がある。
BNB price analysis
BNB価格分析
BNB は 12 月 11 日に場外のローソク足パターンを目撃し、強気派と弱気派の間の厳しい戦いを示しました。
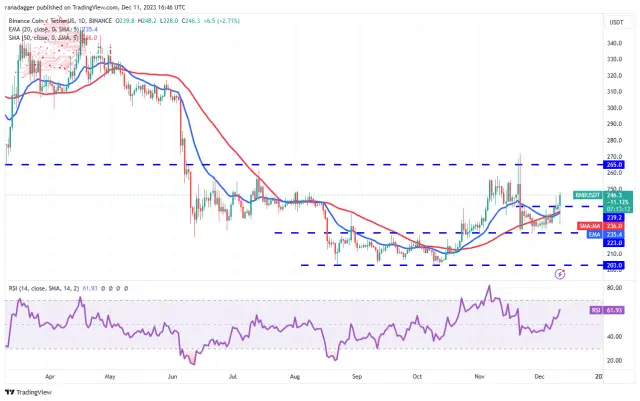
The long tail on the day’s candlestick shows aggressive buying at lower levels. If the price maintains above $239.2, the BNB/USDT pair will likely pick up momentum and soar to $265. This level may be difficult to cross, but if the buyers succeed, the pair will complete a bullish inverse head-and-shoulders pattern.
その日のローソク足のロングテールは、より低いレベルでの積極的な買いを示しています。価格が239.2ドルを超えて維持されれば、BNB/USDTペアは勢いを増し、265ドルまで急騰する可能性がある。このレベルを超えるのは難しいかもしれないが、買い手が成功すれば、ペアは強気の逆ヘッドアンドショルダーパターンを完成させるだろう。
The trend will favour the bears if they sink and sustain the price below $223. The pair may then slump to the pivotal support at $203.
弱気派が価格を下げて223ドル以下を維持すれば、傾向は弱気派に有利となるだろう。その後、通貨ペアは重要なサポートである203ドルまで下落する可能性がある。
XRP price analysis
XRP価格分析
XRP rose above the $0.67 resistance on December 8, but the bulls could not build upon this breakout on December 9. This suggests selling at higher levels.
XRPは12月8日の0.67ドルの抵抗線を超えて上昇しましたが、強気派は12月9日のこのブレイクアウトをさらに発展させることができませんでした。これは、より高いレベルでの売りを示唆しています。
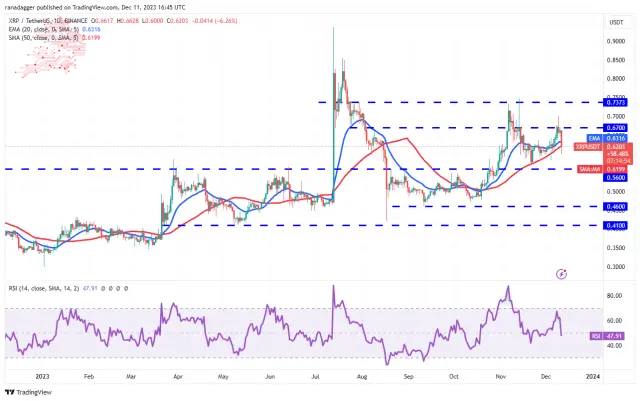
The bulls again tried to drive the price above $0.67 on December 10, but the bears held their ground. This started a sharp pullback, which dipped below the 50-day SMA ($0.62) on December 11. If the price closes below the 50-day SMA, the XRP/USDT pair could drop to the crucial support at $0.56.
強気派は12月10日にも価格を0.67ドル以上に押し上げようとしたが、弱気派は踏みとどまった。これにより急激な反落が始まり、12月11日には50日SMA(0.62ドル)を下回りました。価格が50日SMAを下回って終了した場合、XRP/USDTペアは重要なサポートである0.56ドルまで下落する可能性があります。
If the price rises from the current level, it will signal buying on dips. The bulls will then again try to overcome the obstacle at $0.67. If they do that, the pair may travel to $0.74, where the bears are expected to mount a strong defence.
価格が現在のレベルから上昇した場合は、押し目買いのシグナルとなります。その後、強気派は再び0.67ドルの障害を乗り越えようとするだろう。そうなれば、通貨ペアは0.74ドルまで上昇する可能性があり、弱気派は強力な防御を築くと予想される。
Solana (SOL) price analysis
ソラナ (SOL) 価格分析
Solana is facing selling at the overhead hurdle of $78. The failure to scale this level may have started the pullback on December 11.
ソラナは78ドルという諸経費のハードルで売りに直面している。この水準を拡大できなかったことが、12月11日の反落を始めた可能性がある。
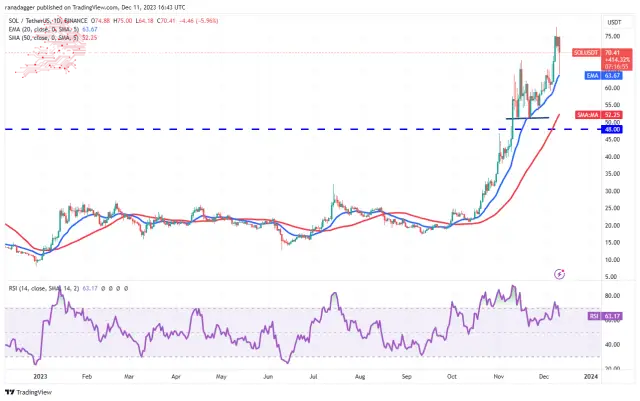
The SOL/USDT pair is finding support at the 20-day EMA ($63), indicating that lower levels continue to attract buyers. If bulls sustain the rebound, the pair could retest the high at $78. A break and close above this level could open the doors for a potential rally to the psychological level of $100.
SOL/USDT ペアは 20 日間 EMA (63 ドル) でサポートされており、より低いレベルが引き続き買い手を引き付けていることを示しています。強気派が反発を維持すれば、78ドルの高値を再試す可能性がある。このレベルを上抜けて引ければ、心理的レベルである100ドルへの上昇の扉が開く可能性がある。
Bears must drag the price below the 20-day EMA if they want to prevent the rally. That may start a deeper correction toward the crucial support at $51.
弱気派は上昇を阻止したい場合、価格を20日間EMA以下に引き下げる必要がある。これにより、51ドルの重要なサポートに向けてより深い調整が始まる可能性があります。
Cardano (ADA) price analysis
カルダノ (ADA) 価格分析
Buyers pushed Cardano above the overhead resistance of $0.60 on Dec. 9 and 10 but could not maintain the higher levels.
買い手は12月9日と10日にカルダノを0.60ドルの直上抵抗線を超えて押し上げたが、より高い水準を維持することはできなかった。
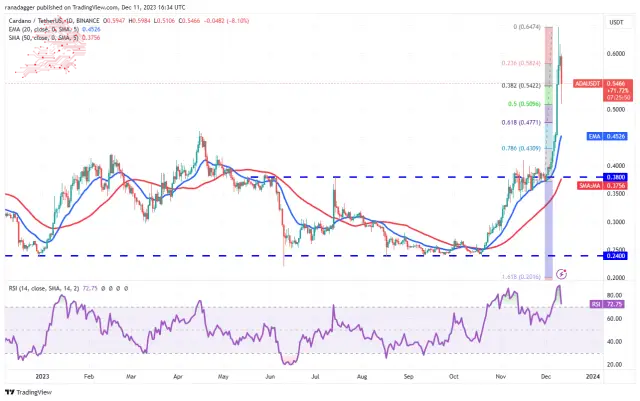
The up-move of the past few days propelled the RSI deep into the overbought zone, indicating that the rally was overextended in the near term. That may have tempted short-term bulls to book out on their positions, which started the pullback on December 11.
過去数日間の上昇によりRSIは買われ過ぎゾーンに深く入り込み、短期的には上昇幅が拡大しすぎたことを示している。これが短期強気派にポジションを予約するよう促した可能性があり、12月11日に反落が始まった。
The ADA/USDT pair is trying to find support at the 50% Fibonacci retracement level of $0.51. If the level holds, buyers will again try to push the price to the local high of $0.65. On the other hand, a break below $0.51 could sink the pair to the 20-day EMA ($0.45).
ADA/USDTペアは50%フィボナッチリトレースメントレベルの0.51ドルでサポートを見つけようとしている。この水準が維持されれば、買い手は再び価格を現地高値の0.65ドルまで押し上げようとするだろう。一方、0.51ドルを下回ると、ペアは20日間EMA(0.45ドル)まで下落する可能性がある。
Dogecoin (DOGE) price analysis
ドージコイン (DOGE) 価格分析
The bears pose a solid challenge for Dogecoin’s rally at $0.11, as seen from the long wick on the December 11 candlestick.
12月11日のローソク足の長い芯からわかるように、弱気派はドージコインの0.11ドルの上昇に確実な挑戦をもたらしている。
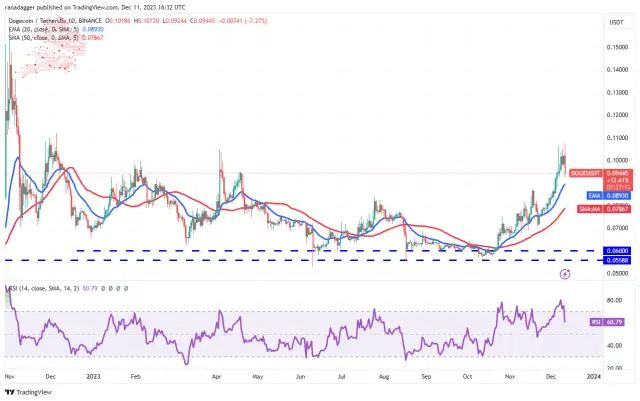
The price can pull down to the 20-day EMA ($0.09), a necessary level to watch out for. A strong bounce off the 20-day EMA will suggest that the sentiment remains positive and traders buy the dips. That increases the possibility of a break above $0.11. The DOGE/USDT pair may jump to $0.15 if that happens.
価格は20日間EMA(0.09ドル)まで下落する可能性があり、注意が必要な水準だ。 20日間EMAからの力強い反発は、センチメントが引き続きポジティブであり、トレーダーが押し目買いをしていることを示唆している。これにより、0.11ドルを突破する可能性が高まる。そうなれば、DOGE/USDTペアは0.15ドルに跳ね上がる可能性がある。
On the contrary, a drop below the 20-day EMA will suggest that traders are aggressively booking profits. The pair may extend the decline to the 50-day SMA ($0.08).
逆に、20日間EMAを下回る下落は、トレーダーが積極的に利益を確保していることを示唆しています。下落幅は50日間SMA(0.08ドル)まで拡大する可能性がある。
Avalanche (AVAX) price analysis
アバランチ (AVAX) 価格分析
Avalanche has been in a strong uptrend for the past several days. Buyers quickly cleared the barrier at $31 on December 9 and reached $38 on December 10.
Avalanche はここ数日間、強い上昇傾向にあります。買い手は12月9日に31ドルの壁をすぐに突破し、12月10日には38ドルに達した。
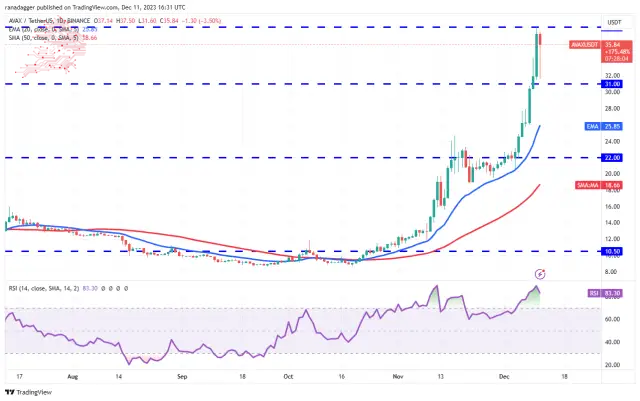
The vertical rally pushed the RSI deep into the overbought territory, signalling that a correction or consolidation is possible soon. The price pulled back on December 11, indicating that the short-term traders may be booking profits.
垂直上昇はRSIを買われ過ぎの領域に深く押し込み、近いうちに調整または保ち合いが可能であることを示唆した。 12月11日には価格が反落しており、短期トレーダーが利益を確定している可能性があることを示している。
If buyers do not allow the price to slip below $31, it will increase the likelihood of a rally above $38. The AVAX/USDT pair could climb to $46 and later to $50. Instead, if the price turns down and plummets below $31, it will suggest the start of a deeper correction to the 20-day EMA ($25.85).
買い手が価格が31ドルを下回ることを許さなければ、38ドルを超える上昇の可能性が高まるだろう。 AVAX/USDTペアは46ドルまで上昇し、その後は50ドルまで上昇する可能性がある。むしろ、価格が下落に転じて31ドルを下回ると、20日間EMA(25.85ドル)のさらなる調整が始まることを示唆することになる。
Source – Rakesh Upadhyay
出典 – ラケシュ・ウパディヤイ
Source: https://thebittimes.com/latest-market-overview-11th-dec-spx-dxy-btc-eth-bnb-xrp-sol-ada-doge-avax-tbt73397.html
出典: https://thebittimes.com/latest-market-overview-11th-dec-spx-dxy-btc-eth-bnb-xrp-sol-ada-doge-avax-tbt73397.html


 Optimisus
 Crypto News Land
 Optimisus
 Cryptopolitan_News
 DogeHome
 Cryptopolitan
 crypto.ro English


