


Bitcoin’s (BTC) market value has faced challenges in stabilising above the $52,000 mark, yet this stabilisation period might prove advantageous for other cryptocurrencies.
El valor de mercado de Bitcoin (BTC) ha enfrentado desafíos para estabilizarse por encima de la marca de los 52.000 dólares, pero este período de estabilización podría resultar ventajoso para otras criptomonedas.
The S&P 500 Index saw its five-week streak of gains end, dropping 0.42% the previous week, triggered by the U.S. Consumer Price Index and Producer Price Index for January exceeding forecasts. The unexpected rise in inflation metrics fueled worries that the Federal Reserve might postpone interest rate reductions until later in the year, contrary to earlier predictions of a cut by March.
El índice S&P 500 vio terminar su racha de cinco semanas de ganancias, cayendo un 0,42% la semana anterior, provocada por el índice de precios al consumidor y el índice de precios al productor de EE. UU. de enero que superaron las previsiones. El aumento inesperado de los indicadores de inflación alimentó la preocupación de que la Reserva Federal pudiera posponer las reducciones de las tasas de interés hasta más adelante en el año, contrariamente a las predicciones anteriores de un recorte para marzo.
Despite these negative economic indicators, Bitcoin experienced an 8% surge, closing the week at $52,137, marking its highest weekly closure since November 2021. The recent persistence of $52,000 as a point of resistance has not prompted quick profit-taking among Bitcoin investors, indicating continued long-term optimism within the market.
A pesar de estos indicadores económicos negativos, Bitcoin experimentó un aumento del 8%, cerrando la semana en $52,137, marcando su cierre semanal más alto desde noviembre de 2021. La reciente persistencia de $52,000 como punto de resistencia no ha provocado una rápida toma de ganancias entre los inversores de Bitcoin, lo que indica optimismo continuo a largo plazo dentro del mercado.
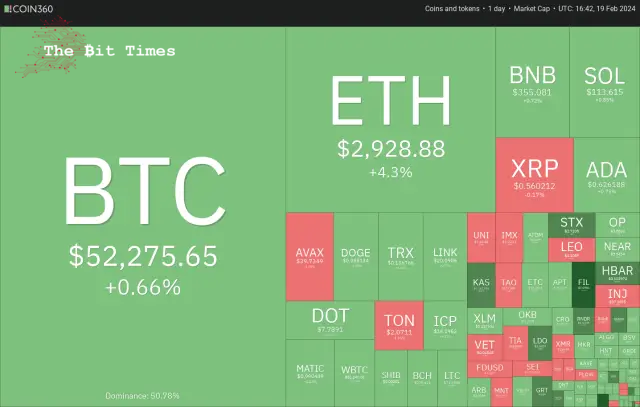
Another positive in favour of Bitcoin is that outflows from the Grayscale Bitcoin Trust (GBTC) have been slowing down. After bleeding $5.64 billion in January, the outflows from GBTC have slowed to $1.37 billion in February.
Otro aspecto positivo a favor de Bitcoin es que las salidas de Grayscale Bitcoin Trust (GBTC) se han ido desacelerando. Después de sangrar 5.640 millones de dólares en enero, las salidas de GBTC se han reducido a 1.370 millones de dólares en febrero.
Could Bitcoin start the next leg of the uptrend, pulling select altcoins higher? Let’s analyze the charts to find out.
¿Podría Bitcoin iniciar el siguiente tramo de la tendencia alcista, impulsando al alza algunas altcoins? Analicemos los gráficos para averiguarlo.
S&P 500 Index (SPX) Market Analysis
Análisis de mercado del índice S&P 500 (SPX)
The S&P 500 Index rebounded off the 20-day exponential moving average (4,940) on Feb. 13, indicating an uptrend.
El índice S&P 500 se recuperó del promedio móvil exponencial de 20 días (4940) el 13 de febrero, lo que indica una tendencia alcista.
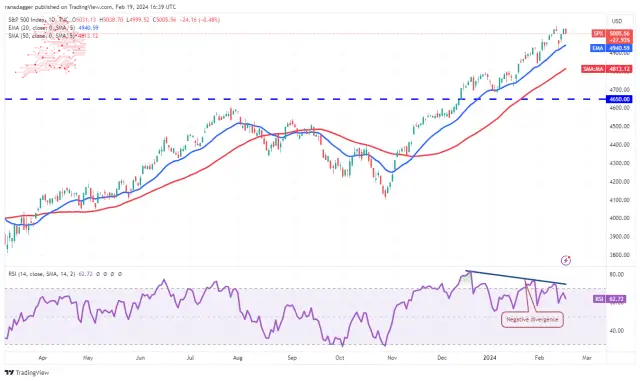
However, the bears are not ready to give up easily and are trying to protect the overhead resistance 5,048. The negative divergence on the relative strength index (RSI) cautions of a possible correction or consolidation in the short term.
Sin embargo, los bajistas no están dispuestos a darse por vencidos fácilmente y están tratando de proteger la resistencia superior 5.048. La divergencia negativa en el índice de fuerza relativa (RSI) advierte de una posible corrección o consolidación en el corto plazo.
A break below the 20-day EMA will indicate the start of a deeper correction. The index could then drop to the 50-day simple moving average (4,813) and 4,650.
Una ruptura por debajo de la EMA de 20 días indicará el inicio de una corrección más profunda. El índice podría entonces caer hasta la media móvil simple de 50 días (4.813) y 4.650.
Contrary to this assumption, if the index continues higher and breaks above 5,048, it will signal the resumption of the uptrend. The index could then surge toward 5,200.
Contrariamente a esta suposición, si el índice continúa subiendo y supera los 5.048, señalará la reanudación de la tendencia alcista. El índice podría entonces subir hasta los 5.200.
U.S. Dollar Index (DXY) Market Analysis
Análisis de mercado del índice del dólar estadounidense (DXY)
The U.S. dollar Index attempted to start an up move on Feb. 13, but the rally met with intense selling pressure near 105.
El índice del dólar estadounidense intentó iniciar un movimiento alcista el 13 de febrero, pero el repunte se encontró con una intensa presión de venta cerca de 105.
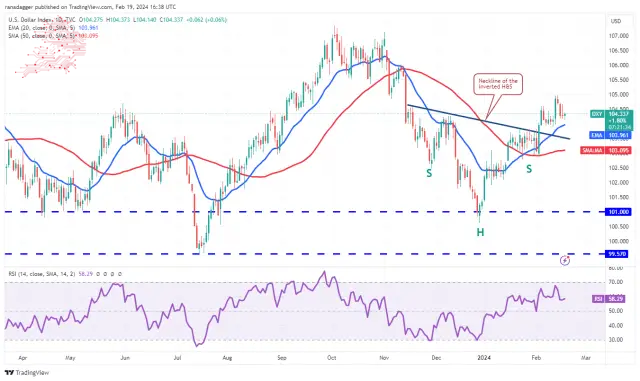
The price turned down and reached the 20-day EMA (104), a necessary support to watch out for. If the price rebounds off the 20-day EMA, the bulls will make one more attempt to propel the index to 106 and then to 107.
El precio bajó y alcanzó la EMA de 20 días (104), un soporte necesario al que prestar atención. Si el precio rebota en la EMA de 20 días, los alcistas harán un intento más de impulsar el índice a 106 y luego a 107.
Conversely, if the index breaks below the 20-day EMA, it will indicate that higher levels continue to attract selling by the bears. The index may then slump to the 50-day SMA (103), likely attracting buyers.
Por el contrario, si el índice cae por debajo de la EMA de 20 días, indicará que los niveles más altos continúan atrayendo ventas por parte de los bajistas. Luego, el índice podría caer hasta la SMA de 50 días (103), lo que probablemente atraería compradores.
Bitcoin (BTC) Market Analysis
Análisis del mercado de Bitcoin (BTC)
Bitcoin is consolidating in an uptrend. The bears are trying to stall the rally at $52,000, but the bulls have kept up the pressure.
Bitcoin se está consolidando en una tendencia alcista. Los bajistas están tratando de detener el repunte en 52.000 dólares, pero los alcistas han mantenido la presión.
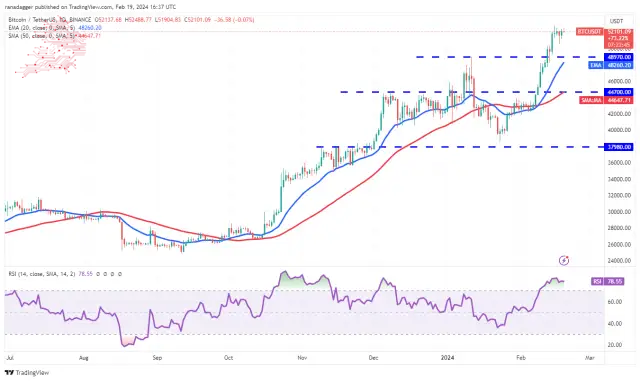
A tight consolidation near a crucial resistance generally resolves to the upside. If the bulls shove and maintain the price above $52,000, it will indicate the start of the next leg of the uptrend. The BTC/USDT pair could then surge toward $60,000.
Una consolidación estrecha cerca de una resistencia crucial generalmente se resuelve al alza. Si los alcistas empujan y mantienen el precio por encima de los 52.000 dólares, indicará el inicio del siguiente tramo de la tendencia alcista. El par BTC/USDT podría entonces subir hacia los $60,000.
If bears want to prevent the move, they must quickly drag the price below the 20-day EMA ($48,260). If they do that, the stops of several short-term traders may get hit. The pair could then plunge to the 50-day SMA ($44,647).
Si los bajistas quieren evitar el movimiento, deben arrastrar rápidamente el precio por debajo de la EMA de 20 días ($48,260). Si lo hacen, las paradas de varios operadores a corto plazo pueden verse afectadas. Luego, el par podría caer hasta la SMA de 50 días ($44,647).
Ether (ETH) Price Analysis
Análisis de precios de éter (ETH)
Ether rebounded off $2,717 on Feb. 17, indicating that the bulls are trying to flip the level into support.
El éter se recuperó desde los 2.717 dólares el 17 de febrero, lo que indica que los alcistas están intentando convertir el nivel en soporte.
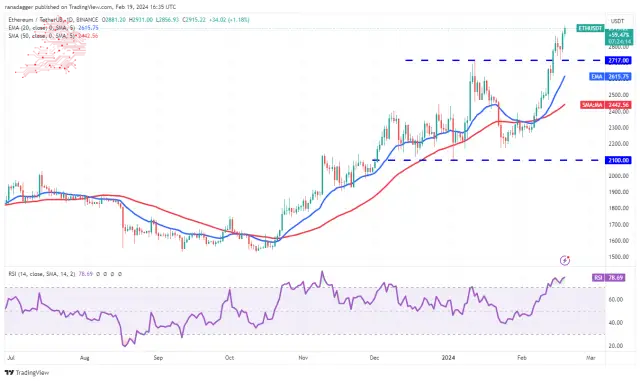
The ETH/USDT pair rose above the immediate resistance of $2,868 on Feb. 18, indicating the resumption of the uptrend. Buyers will try to maintain the momentum and kick the price to $ the psychologically critical level of $3,000.
El par ETH/USDT superó la resistencia inmediata de $2,868 el 18 de febrero, lo que indica la reanudación de la tendencia alcista. Los compradores intentarán mantener el impulso y elevar el precio hasta el nivel psicológicamente crítico de 3.000 dólares.
The rally of the past few days has sent the RSI above 78, indicating the possibility of a minor correction or consolidation in the near term. Sellers must tug the price below the 20-day EMA ($2,615) to signal a short-term top.
El repunte de los últimos días ha enviado el RSI por encima de 78, lo que indica la posibilidad de una corrección o consolidación menor en el corto plazo. Los vendedores deben bajar el precio por debajo de la EMA de 20 días ($2,615) para señalar un máximo a corto plazo.
BNB Price Analysis
Análisis de precios de BNB
BNB ha retrocedido en una tendencia alcista, lo que sugiere que los operadores a corto plazo están reservando ganancias. Generalmente, los retrocesos no duran más de tres días en una fuerte tendencia alcista.
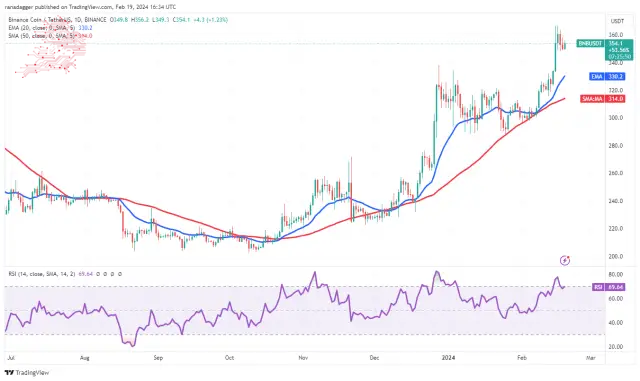
The rising 20-day EMA ($330) and the RSI near the overbought territory indicate that the bulls are in control. If the price turns up and breaks above $367, it will suggest that the uptrend has resumed. The BNB/USDT pair could then attempt a rally to $400.
La EMA de 20 días en ascenso ($330) y el RSI cerca del territorio de sobrecompra indican que los alcistas tienen el control. Si el precio sube y supera los 367 dólares, sugerirá que la tendencia alcista se ha reanudado. El par BNB/USDT podría entonces intentar subir hasta los $400.
Instead, if the price continues lower and slips below $348, the pair may reach the 20-day EMA. This level may again attract buyers, but if the bears prevail, the pair may plummet to the 50-day SMA ($314).
En cambio, si el precio continúa bajando y cae por debajo de $ 348, el par puede alcanzar la EMA de 20 días. Este nivel puede atraer nuevamente a los compradores, pero si los bajistas prevalecen, el par puede caer a la SMA de 50 días ($314).
XRP Price Analysis
Análisis de precios XRP
XRP has been stuck between the downtrend line and the 20-day EMA ($0.54) for the past few days, indicating indecision between the bulls and the bears.
XRP ha estado atrapado entre la línea de tendencia bajista y la EMA de 20 días ($0,54) durante los últimos días, lo que indica indecisión entre los alcistas y los bajistas.
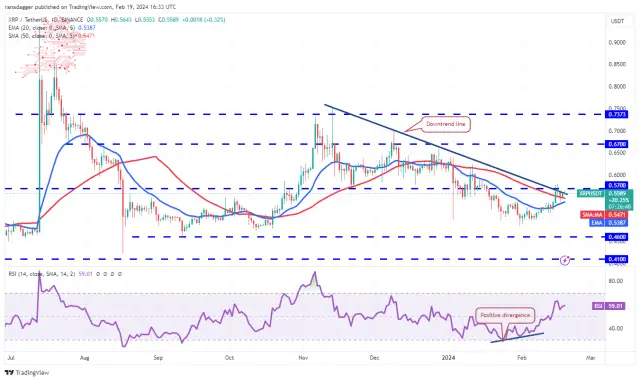
The 20-day EMA has started to turn gradually, and the RSI has risen into the positive zone, indicating that the bulls have the upper hand. If the price breaks and closes above the downtrend line, it will suggest that the correction may be over. The XRP/USDT pair will then attempt a rally to $0.67.
La EMA de 20 días ha comenzado a girar gradualmente y el RSI ha subido a la zona positiva, lo que indica que los alcistas tienen la ventaja. Si el precio se rompe y cierra por encima de la línea de tendencia bajista, sugerirá que la corrección puede haber terminado. El par XRP/USDT intentará subir a USD 0,67.
On the contrary, if the price turns sharply from the downtrend line and plunges below the 20-day EMA, it will indicate that bears remain in command. The pair may then descend to $0.50.
Por el contrario, si el precio se aleja bruscamente de la línea de tendencia bajista y cae por debajo de la EMA de 20 días, indicará que los bajistas siguen al mando. Luego, el par puede descender a 0,50 dólares.
Solana (SOL) Price Analysis
Solana pulled back to the neckline of the inverse head-and-shoulders pattern on Feb. 17, and the bulls held their ground.
Análisis de precios de Solana (SOL) Solana regresó al escote del patrón inverso de cabeza y hombros el 17 de febrero, y los alcistas se mantuvieron firmes.
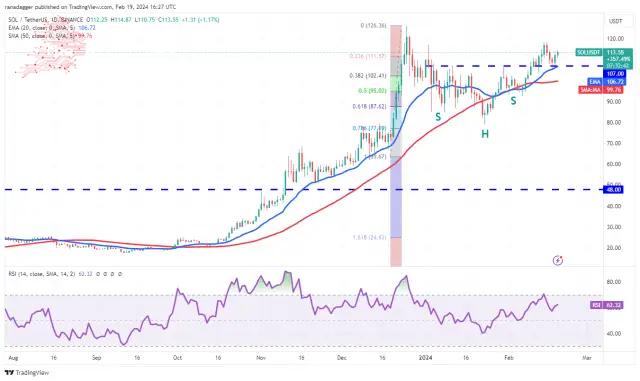
The upsloping 20-day EMA ($106) and the RSI above 62 indicate that the bulls have the upper hand. There is a minor resistance at $119, but that is likely to be crossed. The SOL/USDT pair could retest the stiff overhead resistance of $127. If this level is scaled, the pair may reach the pattern target of $135.
La EMA de 20 días ($ 106) alcista y el RSI por encima de 62 indican que los alcistas tienen la ventaja. Hay una resistencia menor en 119 dólares, pero es probable que se supere. El par SOL/USDT podría volver a probar la rígida resistencia superior de $127. Si se escala este nivel, el par puede alcanzar el objetivo del patrón de $135.
This optimistic view will be negated soon if the price turns down and dives below the 20-day EMA. That may result in long liquidations, pulling the pair to the 50-day SMA ($100).
Esta visión optimista se verá anulada pronto si el precio baja y cae por debajo de la EMA de 20 días. Esto puede resultar en liquidaciones largas, llevando al par a la SMA de 50 días ($100).
Cardano (AVAX) Price Analysis
Cardano’s long tail on the Feb. 17 candlestick shows that the bulls continue to view dips to the 20-day EMA ($0.56) as a buying opportunity.
Cardano (AVAX) Análisis de precios La larga cola de Cardano en la vela del 17 de febrero muestra que los alcistas continúan viendo las caídas en la EMA de 20 días ($0,56) como una oportunidad de compra.
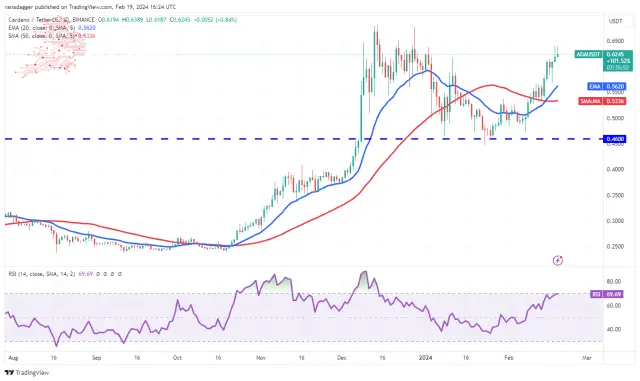
The bulls are trying to maintain the price above the immediate resistance of $0.62. If they manage to do that, the ADA/USDT pair could rally to the vital resistance at $0.68. This level may witness a tough battle between the bulls and the bears, but if the buyers prevail, the next stop is expected to be $0.90.
Los alcistas están tratando de mantener el precio por encima de la resistencia inmediata de 0,62 dólares. Si logran hacer eso, el par ADA/USDT podría subir a la resistencia vital de $0,68. Este nivel puede ser testigo de una dura batalla entre los alcistas y los bajistas, pero si los compradores prevalecen, se espera que la próxima parada sea de 0,90 dólares.
On the contrary, if the price turns sharply from $0.68, it will indicate that the bears vigorously defend the level. A break below the 20-day EMA will suggest that the bullish momentum has weakened.
Por el contrario, si el precio cambia bruscamente desde 0,68 dólares, indicará que los bajistas defienden vigorosamente el nivel. Una ruptura por debajo de la EMA de 20 días sugerirá que el impulso alcista se ha debilitado.
Avalanche (AVAX) Price Analysis
Análisis de precios de avalancha (AVAX)
Avalanche turned down from the $42 level on Feb. 15, but a positive sign is that the bulls did not allow the price to dip below the 20-day EMA ($38.40).
Avalanche bajó desde el nivel de 42 dólares el 15 de febrero, pero una señal positiva es que los alcistas no permitieron que el precio cayera por debajo de la EMA de 20 días (38,40 dólares).
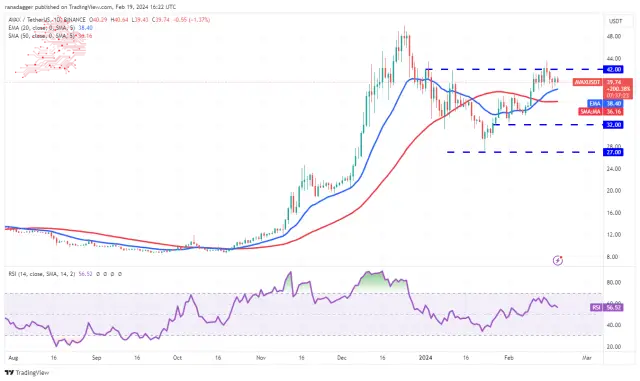
The bulls will again try to clear the obstacle at $42, and if they succeed, the AVAX/USDT pair will complete an inverse H&S pattern. The pair may then skyrocket to $50, a difficult barrier to cross.
Los alcistas intentarán nuevamente superar el obstáculo de $42 y, si lo logran, el par AVAX/USDT completará un patrón H&S inverso. El par podría entonces dispararse hasta los 50 dólares, una barrera difícil de cruzar.
On the downside, the 20-day EMA is the crucial support to watch out for. If this level cracks, the pair may slip to the 50-day SMA ($36.16). Such a move will suggest that the pair may oscillate between $32 and $42 for some time.
En el lado negativo, la EMA de 20 días es el soporte crucial al que hay que prestar atención. Si este nivel se rompe, el par puede caer hasta la SMA de 50 días ($36,16). Tal movimiento sugerirá que el par puede oscilar entre $32 y $42 durante algún tiempo.
Dogecoin (DOGE) Price Analysis
The bears tried to pull Dogecoin back into the symmetrical triangle pattern on Feb. 17, but the bulls protected the level aggressively.
Análisis de precios de Dogecoin (DOGE) Los bajistas intentaron llevar a Dogecoin nuevamente al patrón de triángulo simétrico el 17 de febrero, pero los alcistas protegieron el nivel agresivamente.
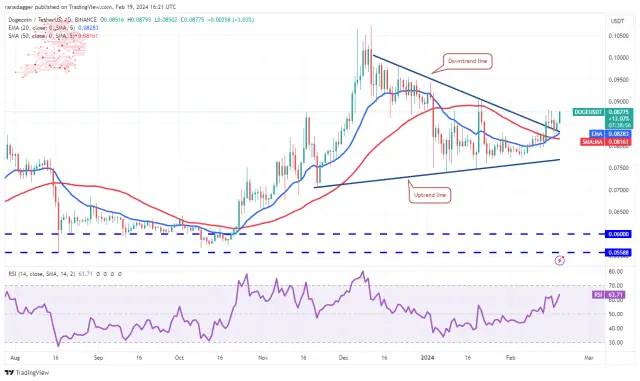
The 20-day EMA ($0.08) has started to turn up gradually, and the RSI is above 63, indicating that the bulls are attempting a comeback. If the bulls clear the hurdle at $0.09, the DOGE/USDT pair could climb to the $0.10 to $0.11 resistance zone.
La EMA de 20 días ($0,08) ha comenzado a subir gradualmente y el RSI está por encima de 63, lo que indica que los alcistas están intentando regresar. Si los alcistas superan el obstáculo de USD 0,09, el par DOGE/USDT podría subir a la zona de resistencia de USD 0,10 a USD 0,11.
This optimistic view will be invalidated soon if the price turns down and collapses below the moving averages. Such a move indicates that bears sell on every minor relief rally. The selling could intensify on a break below the uptrend line.
Esta visión optimista pronto quedará invalidada si el precio baja y colapsa por debajo de las medias móviles. Tal movimiento indica que los bajistas venden en cada pequeño repunte de alivio. Las ventas podrían intensificarse si se rompe por debajo de la línea de tendencia alcista.
Source – Rakesh Upadhyay
Fuente - Rakesh Upadhyay
Source: https://thebittimes.com/latest-market-overview-19th-feb-spx-dxy-btc-eth-bnb-sol-xrp-ada-avax-doge-tbt80262.html
Fuente: https://thebittimes.com/latest-market-overview-19th-feb-spx-dxy-btc-eth-bnb-sol-xrp-ada-avax-doge-tbt80262.html
 Crypto Daily™
 CaptainAltcoin
 Thecryptoupdates
 Crypto Intelligence
 CoinsProbe
 Crypto News Land
 DogeHome
 InsideBitcoin News
 Coin Edition


