


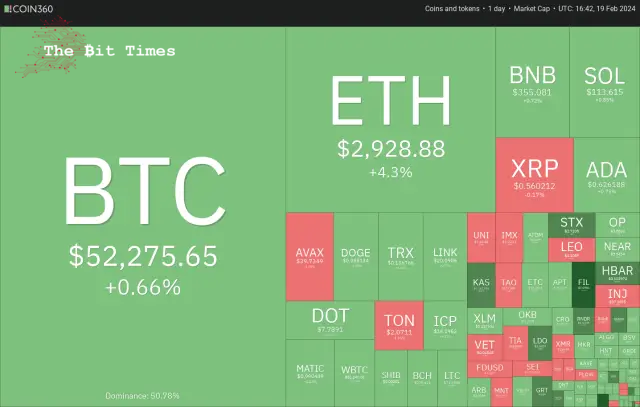
Bitcoin’s (BTC) market value has faced challenges in stabilising above the $52,000 mark, yet this stabilisation period might prove advantageous for other cryptocurrencies.
ビットコイン (BTC) の市場価値は、52,000 ドルを超えて安定するという課題に直面していますが、この安定期間は他の仮想通貨にとって有利になる可能性があります。
The S&P 500 Index saw its five-week streak of gains end, dropping 0.42% the previous week, triggered by the U.S. Consumer Price Index and Producer Price Index for January exceeding forecasts. The unexpected rise in inflation metrics fueled worries that the Federal Reserve might postpone interest rate reductions until later in the year, contrary to earlier predictions of a cut by March.
1月の米国消費者物価指数と生産者物価指数が予想を上回ったことがきっかけとなり、S&P500指数は前週0.42%下落し、5週間の連続上昇に終止符が打たれた。インフレ指標の予想外の上昇を受け、米連邦準備理事会(FRB)が3月までの利下げという当初の予想に反し、利下げを年内に延期するのではないかとの懸念が高まった。
Despite these negative economic indicators, Bitcoin experienced an 8% surge, closing the week at $52,137, marking its highest weekly closure since November 2021. The recent persistence of $52,000 as a point of resistance has not prompted quick profit-taking among Bitcoin investors, indicating continued long-term optimism within the market.
これらのネガティブな経済指標にもかかわらず、ビットコインは8%の急騰を記録し、52,137ドルで週を終え、2021年11月以来最高の週間終値を記録した。レジスタンスポイントとしての最近の52,000ドルの持続は、ビットコイン投資家の間で素早い利益確定を促していないことを示している。市場では長期的な楽観的な見方が続いている。
Another positive in favour of Bitcoin is that outflows from the Grayscale Bitcoin Trust (GBTC) have been slowing down. After bleeding $5.64 billion in January, the outflows from GBTC have slowed to $1.37 billion in February.
ビットコインに有利なもう一つの利点は、グレースケール・ビットコイン・トラスト(GBTC)からの流出が減速していることだ。 1月に56億4,000万ドルの流出があった後、GBTCからの流出は2月には13億7,000万ドルに減速した。
Could Bitcoin start the next leg of the uptrend, pulling select altcoins higher? Let’s analyze the charts to find out.
ビットコインは上昇トレンドの次のレグを開始し、一部のアルトコインをさらに引き上げることができるでしょうか?チャートを分析して調べてみましょう。
S&P 500 Index (SPX) Market Analysis
S&P 500 指数 (SPX) 市場分析
The S&P 500 Index rebounded off the 20-day exponential moving average (4,940) on Feb. 13, indicating an uptrend.
S&P 500指数は2月13日の20日間指数移動平均(4,940)から反発し、上昇傾向を示した。
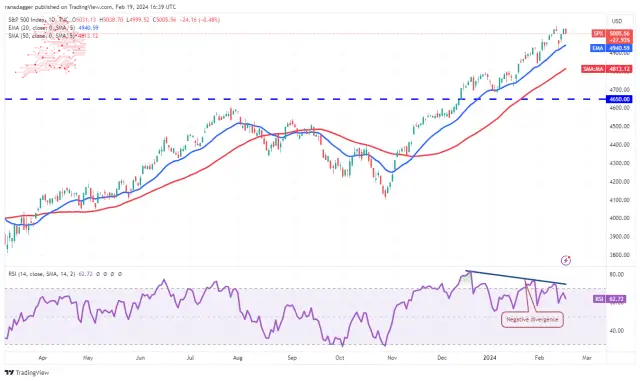
However, the bears are not ready to give up easily and are trying to protect the overhead resistance 5,048. The negative divergence on the relative strength index (RSI) cautions of a possible correction or consolidation in the short term.
しかし、クマたちは簡単に諦めるつもりはなく、頭上の抵抗線5,048を守ろうとしています。相対強度指数 (RSI) のマイナスの乖離は、短期的に調整または統合の可能性を警告しています。
A break below the 20-day EMA will indicate the start of a deeper correction. The index could then drop to the 50-day simple moving average (4,813) and 4,650.
20日間EMAを下回ると、より深い調整が始まることを示します。その後、同指数は50日単純移動平均(4,813)や4,650まで低下する可能性がある。
Contrary to this assumption, if the index continues higher and breaks above 5,048, it will signal the resumption of the uptrend. The index could then surge toward 5,200.
この想定に反して、指数が上昇を続けて 5,048 を超えた場合は、上昇トレンドの再開を示すことになります。その後、同指数は5200に向けて急上昇する可能性がある。
U.S. Dollar Index (DXY) Market Analysis
米ドルインデックス(DXY)市場分析
The U.S. dollar Index attempted to start an up move on Feb. 13, but the rally met with intense selling pressure near 105.
米ドル指数は2月13日に上昇を始めようとしたが、上昇は105付近で激しい売り圧力に遭った。
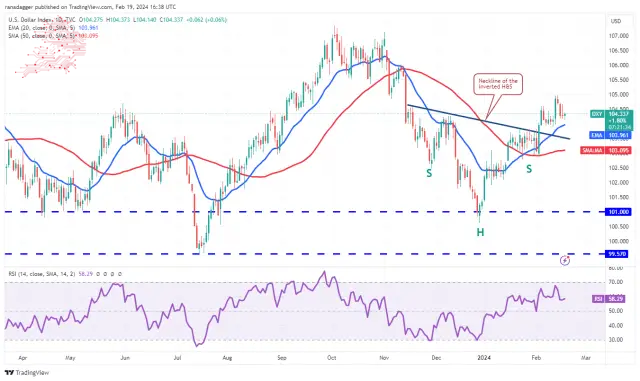
The price turned down and reached the 20-day EMA (104), a necessary support to watch out for. If the price rebounds off the 20-day EMA, the bulls will make one more attempt to propel the index to 106 and then to 107.
価格は下落し、注意が必要なサポートである20日間EMA(104)に達しました。価格が20日間EMAから反発した場合、強気派は指数を106、そして107に押し上げようともう一度試みるだろう。
Conversely, if the index breaks below the 20-day EMA, it will indicate that higher levels continue to attract selling by the bears. The index may then slump to the 50-day SMA (103), likely attracting buyers.
逆に、指数が 20 日間 EMA を下回った場合、より高い水準が引き続き弱気派の売りを引きつけていることを示します。その後、指数は50日間SMA(103)まで下落する可能性があり、買い手が集まる可能性が高い。
Bitcoin (BTC) Market Analysis
ビットコイン(BTC)市場分析
Bitcoin is consolidating in an uptrend. The bears are trying to stall the rally at $52,000, but the bulls have kept up the pressure.
ビットコインは上昇傾向にあります。弱気派は52,000ドルでの上昇を失速させようとしているが、強気派は圧力を続けている。
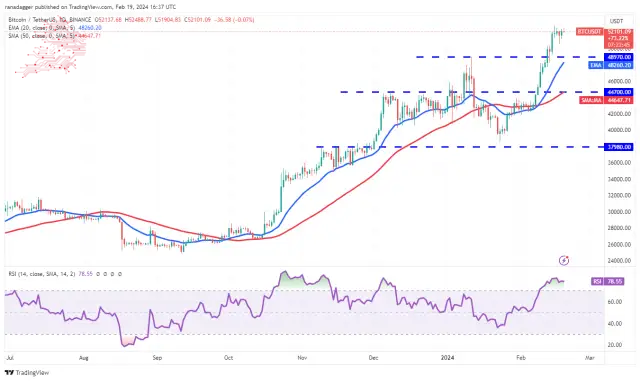
A tight consolidation near a crucial resistance generally resolves to the upside. If the bulls shove and maintain the price above $52,000, it will indicate the start of the next leg of the uptrend. The BTC/USDT pair could then surge toward $60,000.
重要な抵抗線付近での堅調な保ち合いは、一般に上向きに解消されます。強気派が価格を52,000ドル以上に押し上げて維持した場合、それは上昇トレンドの次のレグの開始を示すことになる。その後、BTC/USDTペアは6万ドルに向けて急騰する可能性がある。
If bears want to prevent the move, they must quickly drag the price below the 20-day EMA ($48,260). If they do that, the stops of several short-term traders may get hit. The pair could then plunge to the 50-day SMA ($44,647).
弱気派がこの動きを阻止したい場合は、価格を速やかに20日間EMA(4万8260ドル)以下に引き下げる必要がある。そうすれば、複数の短期トレーダーのストップが打撃を受ける可能性がある。その後、ペアは50日間SMA(44,647ドル)まで急落する可能性がある。
Ether (ETH) Price Analysis
イーサ(ETH)価格分析
Ether rebounded off $2,717 on Feb. 17, indicating that the bulls are trying to flip the level into support.
イーサは2月17日に2,717ドルから反発し、強気派がそのレベルをサポートに反転させようとしていることを示しています。
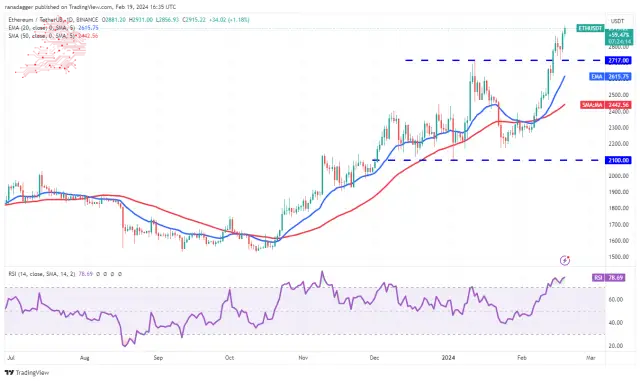
The ETH/USDT pair rose above the immediate resistance of $2,868 on Feb. 18, indicating the resumption of the uptrend. Buyers will try to maintain the momentum and kick the price to $ the psychologically critical level of $3,000.
ETH/USDTペアは2月18日の当面の抵抗線である2,868ドルを上回り、上昇トレンドの再開を示した。買い手はこの勢いを維持し、心理的に重要な水準である3,000ドルまで価格を押し上げようとするだろう。
The rally of the past few days has sent the RSI above 78, indicating the possibility of a minor correction or consolidation in the near term. Sellers must tug the price below the 20-day EMA ($2,615) to signal a short-term top.
過去数日間の上昇でRSIは78を超えており、短期的には小幅な調整や値固めの可能性があることを示している。売り手は短期的な天井を示すために、価格を20日間EMA(2,615ドル)以下に引っ張る必要がある。
BNB Price Analysis
BNB価格分析
BNB は上昇トレンドを後退させており、短期トレーダーによる利益確定を示唆しています。一般に、強い上昇トレンドでは反落が 3 日を超えて続くことはありません。
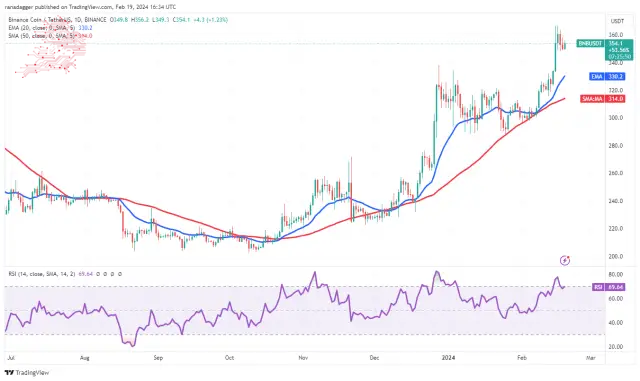
The rising 20-day EMA ($330) and the RSI near the overbought territory indicate that the bulls are in control. If the price turns up and breaks above $367, it will suggest that the uptrend has resumed. The BNB/USDT pair could then attempt a rally to $400.
20日間EMA(330ドル)の上昇と買われ過ぎ領域に近いRSIは、強気派が主導権を握っていることを示している。価格が上昇し、367ドルを超えた場合、上昇トレンドが再開したことを示唆します。その後、BNB/USDTペアは400ドルへの上昇を試みる可能性がある。
Instead, if the price continues lower and slips below $348, the pair may reach the 20-day EMA. This level may again attract buyers, but if the bears prevail, the pair may plummet to the 50-day SMA ($314).
むしろ、価格が下落し続けて348ドルを下回った場合、ペアは20日間EMAに達する可能性があります。この水準は再び買い手を引き付ける可能性があるが、弱気派が優勢であれば、ペアは50日間SMA(314ドル)まで急落する可能性がある。
XRP Price Analysis
XRP価格分析
XRP has been stuck between the downtrend line and the 20-day EMA ($0.54) for the past few days, indicating indecision between the bulls and the bears.
XRPは過去数日間、下降トレンドラインと20日間EMA(0.54ドル)の間に立ち往生しており、強気派と弱気派の間で優柔不断な状態が続いていることを示している。
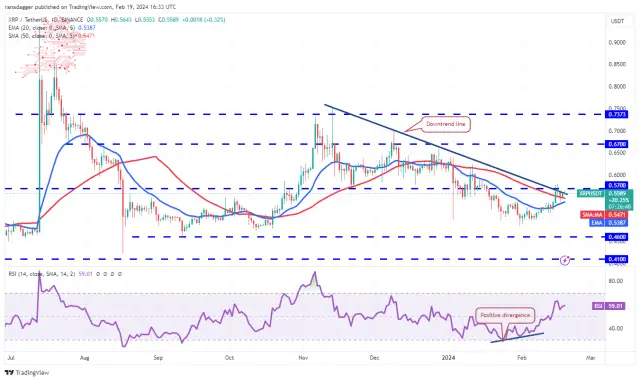
The 20-day EMA has started to turn gradually, and the RSI has risen into the positive zone, indicating that the bulls have the upper hand. If the price breaks and closes above the downtrend line, it will suggest that the correction may be over. The XRP/USDT pair will then attempt a rally to $0.67.
20日間EMAは徐々に反転し始め、RSIはプラスゾーンに上昇し、強気派が優勢であることを示しています。価格が下降トレンドラインを上抜けて終了した場合は、調整が終了した可能性があることを示唆します。その後、XRP/USDTペアは0.67ドルへの上昇を試みるだろう。
On the contrary, if the price turns sharply from the downtrend line and plunges below the 20-day EMA, it will indicate that bears remain in command. The pair may then descend to $0.50.
逆に、価格が下降トレンドラインから急激に変化し、20日間EMAを下回った場合は、弱気派が依然として主導権を握っていることを示します。その後、ペアは0.50ドルまで下落する可能性があります。
Solana (SOL) Price Analysis
Solana pulled back to the neckline of the inverse head-and-shoulders pattern on Feb. 17, and the bulls held their ground.
ソラナ (SOL) 価格分析 ソラナは 2 月 17 日に逆ヘッドアンドショルダー パターンのネックラインに戻り、強気派はその立場を維持しました。
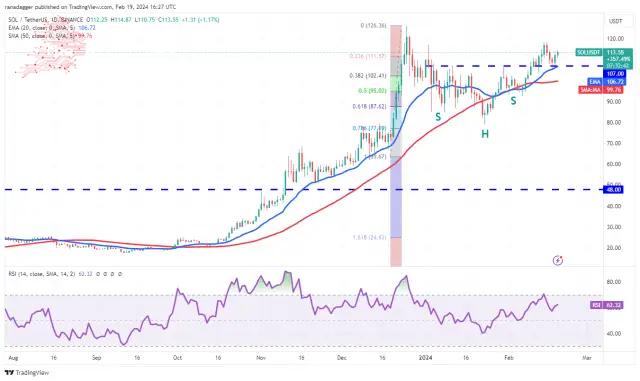
The upsloping 20-day EMA ($106) and the RSI above 62 indicate that the bulls have the upper hand. There is a minor resistance at $119, but that is likely to be crossed. The SOL/USDT pair could retest the stiff overhead resistance of $127. If this level is scaled, the pair may reach the pattern target of $135.
20日間EMA(106ドル)が右肩上がりで、RSIが62を超えていることは、強気派が優勢であることを示している。 119ドルに小さな抵抗線があるが、それは越えられる可能性が高い。 SOL/USDTペアは127ドルの厳しい直上抵抗線を再び試す可能性がある。このレベルが拡大すると、ペアはパターン目標の135ドルに到達する可能性があります。
This optimistic view will be negated soon if the price turns down and dives below the 20-day EMA. That may result in long liquidations, pulling the pair to the 50-day SMA ($100).
価格が下落して20日間EMAを下回れば、この楽観的な見方はすぐに打ち消されるだろう。その結果、長期にわたる清算が必要となり、通貨ペアは50日SMA(100ドル)にまで引き下げられる可能性がある。
Cardano (AVAX) Price Analysis
Cardano’s long tail on the Feb. 17 candlestick shows that the bulls continue to view dips to the 20-day EMA ($0.56) as a buying opportunity.
カルダノ(AVAX)価格分析 2月17日のローソク足におけるカルダノのロングテールは、強気派が引き続き20日間EMA(0.56ドル)への下落を買いの機会とみなしていることを示しています。
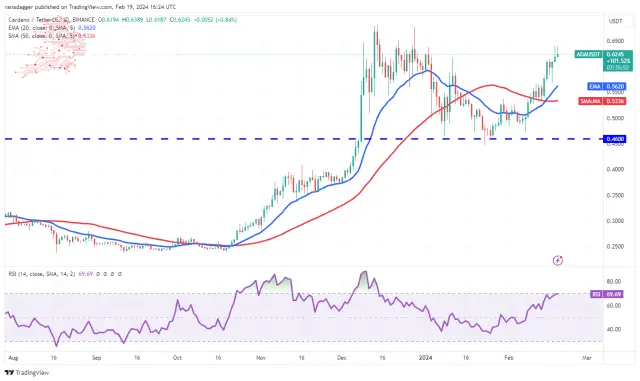
The bulls are trying to maintain the price above the immediate resistance of $0.62. If they manage to do that, the ADA/USDT pair could rally to the vital resistance at $0.68. This level may witness a tough battle between the bulls and the bears, but if the buyers prevail, the next stop is expected to be $0.90.
強気派は当面の抵抗線である0.62ドルを上回る価格を維持しようとしている。それができれば、ADA/USDTペアは0.68ドルの重要な抵抗線まで回復する可能性がある。このレベルでは強気派と弱気派の間の厳しい戦いが見られるかもしれないが、買い方が優勢であれば、次のストップは0.90ドルになると予想される。
On the contrary, if the price turns sharply from $0.68, it will indicate that the bears vigorously defend the level. A break below the 20-day EMA will suggest that the bullish momentum has weakened.
逆に、価格が0.68ドルから急激に変化した場合は、弱気派がその水準を精力的に防衛していることを示します。 20日間EMAを下回った場合は、強気の勢いが弱まったことを示唆します。
Avalanche (AVAX) Price Analysis
アバランチ (AVAX) 価格分析
Avalanche turned down from the $42 level on Feb. 15, but a positive sign is that the bulls did not allow the price to dip below the 20-day EMA ($38.40).
アバランチは2月15日の42ドルの水準から下落したが、強気派が価格が20日間EMA(38.40ドル)を下回ることを許さなかったことは明るい兆しだ。
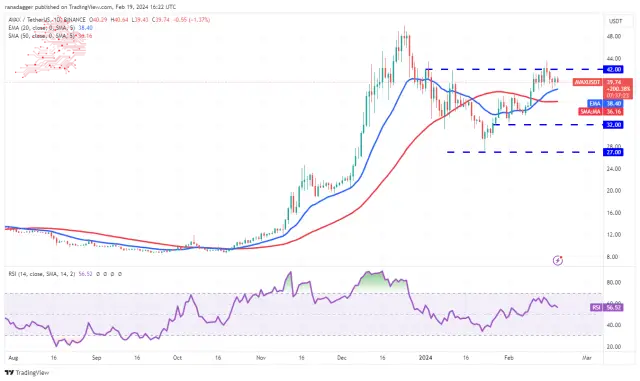
The bulls will again try to clear the obstacle at $42, and if they succeed, the AVAX/USDT pair will complete an inverse H&S pattern. The pair may then skyrocket to $50, a difficult barrier to cross.
強気派は再び42ドルの障害を乗り越えようとし、成功すればAVAX/USDTペアは逆H&Sパターンを完了することになる。その後、ペアは50ドルに急騰する可能性があり、越えるのは困難な壁です。
On the downside, the 20-day EMA is the crucial support to watch out for. If this level cracks, the pair may slip to the 50-day SMA ($36.16). Such a move will suggest that the pair may oscillate between $32 and $42 for some time.
マイナス面としては、20 日間 EMA が注意すべき重要なサポートであることです。このレベルが割れた場合、ペアは50日SMA(36.16ドル)まで下落する可能性がある。このような動きは、通貨ペアがしばらくの間32ドルから42ドルの間で変動する可能性があることを示唆している。
Dogecoin (DOGE) Price Analysis
The bears tried to pull Dogecoin back into the symmetrical triangle pattern on Feb. 17, but the bulls protected the level aggressively.
ドージコイン(DOGE)価格分析 弱気派は2月17日にドージコインを対称的な三角形のパターンに戻そうとしましたが、強気派は積極的にそのレベルを守りました。
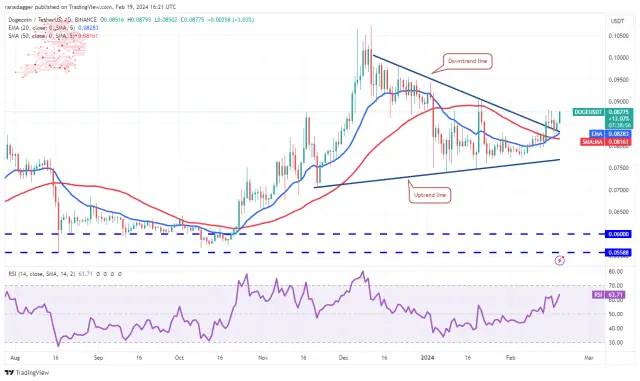
The 20-day EMA ($0.08) has started to turn up gradually, and the RSI is above 63, indicating that the bulls are attempting a comeback. If the bulls clear the hurdle at $0.09, the DOGE/USDT pair could climb to the $0.10 to $0.11 resistance zone.
20日間EMA(0.08ドル)は徐々に上昇し始めており、RSIは63を超えており、強気派が巻き返しを図っていることを示している。強気派が0.09ドルのハードルを越えた場合、DOGE/USDTペアは0.10ドルから0.11ドルのレジスタンスゾーンに上昇する可能性がある。
This optimistic view will be invalidated soon if the price turns down and collapses below the moving averages. Such a move indicates that bears sell on every minor relief rally. The selling could intensify on a break below the uptrend line.
価格が下落して移動平均線を下回れば、この楽観的な見方はすぐに無効になるだろう。このような動きは、弱気派が小規模な救済上昇のたびに売りを出していることを示している。上昇トレンドラインを下抜けると売りが強まる可能性がある。
Source – Rakesh Upadhyay
出典 – ラケシュ・ウパディヤイ
Source: https://thebittimes.com/latest-market-overview-19th-feb-spx-dxy-btc-eth-bnb-sol-xrp-ada-avax-doge-tbt80262.html
出典: https://thebittimes.com/latest-market-overview-19th-feb-spx-dxy-btc-eth-bnb-sol-xrp-ada-avax-doge-tbt80262.html
 ETHNews
 Coin Edition
 DogeHome
 Crypto Daily™
 BlockchainReporter
 Crypto Daily™
 Crypto Daily™
 crypto.news
 CoinPedia News


