


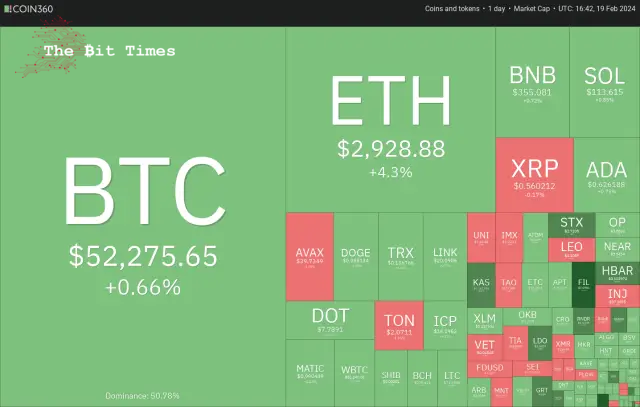
Bitcoin’s (BTC) market value has faced challenges in stabilising above the $52,000 mark, yet this stabilisation period might prove advantageous for other cryptocurrencies.
比特币 (BTC) 的市值在稳定在 52,000 美元大关之上面临着挑战,但这一稳定期可能对其他加密货币有利。
The S&P 500 Index saw its five-week streak of gains end, dropping 0.42% the previous week, triggered by the U.S. Consumer Price Index and Producer Price Index for January exceeding forecasts. The unexpected rise in inflation metrics fueled worries that the Federal Reserve might postpone interest rate reductions until later in the year, contrary to earlier predictions of a cut by March.
受美国 1 月份消费者价格指数和生产者价格指数超出预期的影响,标准普尔 500 指数结束了连续五周的上涨,上周下跌 0.42%。通胀指标的意外上升引发了人们的担忧,即美联储可能会将降息推迟到今年晚些时候,这与早前预测的三月份降息相反。
Despite these negative economic indicators, Bitcoin experienced an 8% surge, closing the week at $52,137, marking its highest weekly closure since November 2021. The recent persistence of $52,000 as a point of resistance has not prompted quick profit-taking among Bitcoin investors, indicating continued long-term optimism within the market.
尽管有这些负面的经济指标,比特币还是上涨了 8%,本周收于 52,137 美元,创下 2021 年 11 月以来的最高单周收盘价。近期持续将 52,000 美元作为阻力位并没有促使比特币投资者迅速获利了结,这表明市场持续的长期乐观情绪。
Another positive in favour of Bitcoin is that outflows from the Grayscale Bitcoin Trust (GBTC) have been slowing down. After bleeding $5.64 billion in January, the outflows from GBTC have slowed to $1.37 billion in February.
有利于比特币的另一个积极因素是灰度比特币信托基金(GBTC)的资金外流一直在放缓。继 1 月份流出 56.4 亿美元之后,GBTC 的资金流出在 2 月份已放缓至 13.7 亿美元。
Could Bitcoin start the next leg of the uptrend, pulling select altcoins higher? Let’s analyze the charts to find out.
比特币能否开启下一阶段的上升趋势,拉动某些山寨币走高?让我们分析一下图表来找出答案。
S&P 500 Index (SPX) Market Analysis
标准普尔 500 指数 (SPX) 市场分析
The S&P 500 Index rebounded off the 20-day exponential moving average (4,940) on Feb. 13, indicating an uptrend.
2 月 13 日,标准普尔 500 指数从 20 日指数移动平均线(4,940 点)反弹,显示出上升趋势。
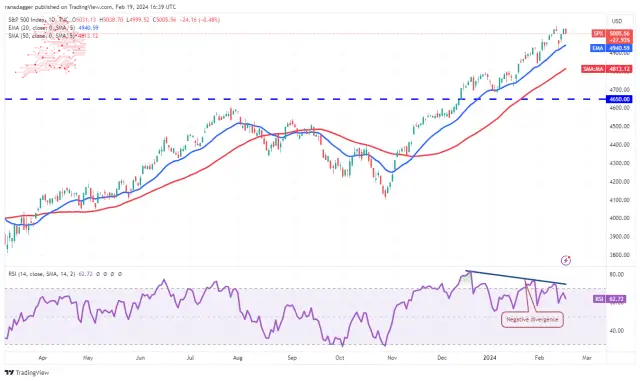
However, the bears are not ready to give up easily and are trying to protect the overhead resistance 5,048. The negative divergence on the relative strength index (RSI) cautions of a possible correction or consolidation in the short term.
然而,空头并不准备轻易放弃,并试图保护上方阻力位 5,048。相对强弱指数(RSI)的负背离警告短期内可能出现调整或盘整。
A break below the 20-day EMA will indicate the start of a deeper correction. The index could then drop to the 50-day simple moving average (4,813) and 4,650.
跌破 20 日均线将表明更深调整的开始。该指数随后可能会跌至 50 日简单移动平均线(4,813)和 4,650。
Contrary to this assumption, if the index continues higher and breaks above 5,048, it will signal the resumption of the uptrend. The index could then surge toward 5,200.
与此假设相反,如果该指数继续走高并突破5,048点,则将预示着上升趋势的恢复。该指数随后可能飙升至 5,200 点。
U.S. Dollar Index (DXY) Market Analysis
美元指数(DXY)市场分析
The U.S. dollar Index attempted to start an up move on Feb. 13, but the rally met with intense selling pressure near 105.
2月13日,美元指数试图开始上涨,但在105附近遭遇强劲抛售压力。
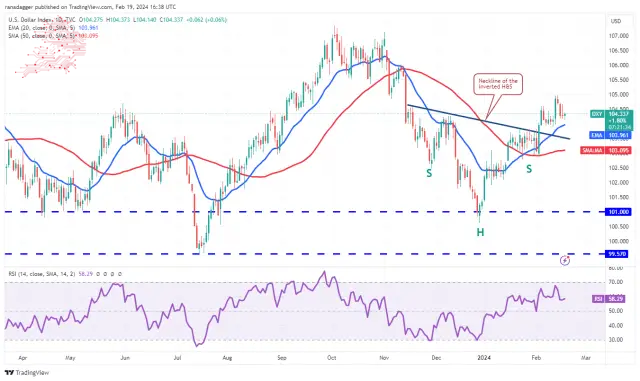
The price turned down and reached the 20-day EMA (104), a necessary support to watch out for. If the price rebounds off the 20-day EMA, the bulls will make one more attempt to propel the index to 106 and then to 107.
价格转向下跌并触及20日均线(104),这是值得留意的必要支撑。如果价格从 20 日均线反弹,多头将再次尝试将指数推升至 106,然后升至 107。
Conversely, if the index breaks below the 20-day EMA, it will indicate that higher levels continue to attract selling by the bears. The index may then slump to the 50-day SMA (103), likely attracting buyers.
相反,如果该指数跌破20日均线,则表明更高水平继续吸引空头抛售。随后该指数可能会跌至 50 日移动平均线(103),这可能会吸引买家。
Bitcoin (BTC) Market Analysis
比特币(BTC)市场分析
Bitcoin is consolidating in an uptrend. The bears are trying to stall the rally at $52,000, but the bulls have kept up the pressure.
比特币正在上涨趋势中巩固。空头试图阻止涨势至 52,000 美元,但多头一直施加压力。
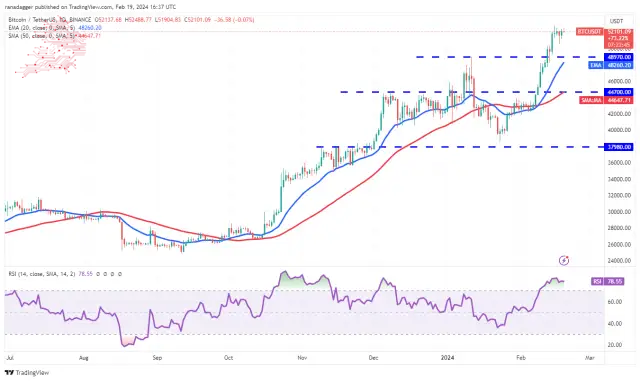
A tight consolidation near a crucial resistance generally resolves to the upside. If the bulls shove and maintain the price above $52,000, it will indicate the start of the next leg of the uptrend. The BTC/USDT pair could then surge toward $60,000.
关键阻力位附近的紧密盘整通常会导致上行。如果多头将价格推高并维持在 52,000 美元以上,则表明下一阶段上升趋势的开始。 BTC/USDT 货币对可能会飙升至 60,000 美元。
If bears want to prevent the move, they must quickly drag the price below the 20-day EMA ($48,260). If they do that, the stops of several short-term traders may get hit. The pair could then plunge to the 50-day SMA ($44,647).
如果空头想要阻止这一走势,他们必须迅速将价格拖至 20 日均线(48,260 美元)下方。如果他们这样做,一些短期交易者的止损可能会受到影响。随后该货币对可能会跌至 50 日移动平均线(44,647 美元)。
Ether (ETH) Price Analysis
以太币(ETH)价格分析
Ether rebounded off $2,717 on Feb. 17, indicating that the bulls are trying to flip the level into support.
以太币于 2 月 17 日从 2,717 美元反弹,表明多头正试图将该水平转变为支撑位。
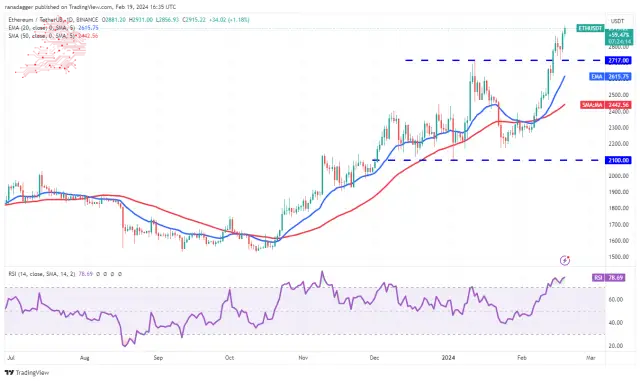
The ETH/USDT pair rose above the immediate resistance of $2,868 on Feb. 18, indicating the resumption of the uptrend. Buyers will try to maintain the momentum and kick the price to $ the psychologically critical level of $3,000.
2 月 18 日,ETH/USDT 货币对升至 2,868 美元的直接阻力位之上,表明上升趋势已恢复。买家将努力保持势头,将价格推至 3,000 美元的心理临界水平。
The rally of the past few days has sent the RSI above 78, indicating the possibility of a minor correction or consolidation in the near term. Sellers must tug the price below the 20-day EMA ($2,615) to signal a short-term top.
过去几天的反弹已使 RSI 突破 78,表明近期可能出现小幅调整或盘整。卖家必须将价格拉低至 20 日均线(2,615 美元)下方,以发出短期顶部信号。
BNB Price Analysis
BNB价格分析
BNB 在上涨趋势中回落,表明短期交易者获利了结。一般来说,在强劲的上升趋势中回调不会持续超过三天。
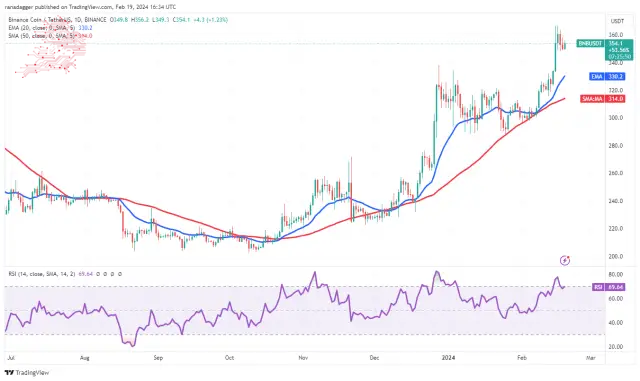
The rising 20-day EMA ($330) and the RSI near the overbought territory indicate that the bulls are in control. If the price turns up and breaks above $367, it will suggest that the uptrend has resumed. The BNB/USDT pair could then attempt a rally to $400.
不断上涨的 20 日均线(330 美元)和 RSI 接近超买区域表明多头处于控制之中。如果价格回升并突破 367 美元,则表明上升趋势已恢复。随后,BNB/USDT 货币对可能会尝试反弹至 400 美元。
Instead, if the price continues lower and slips below $348, the pair may reach the 20-day EMA. This level may again attract buyers, but if the bears prevail, the pair may plummet to the 50-day SMA ($314).
相反,如果价格继续走低并跌破 348 美元,该货币对可能会触及 20 日均线。这一水平可能会再次吸引买家,但如果空头占上风,该货币对可能会暴跌至 50 日移动平均线(314 美元)。
XRP Price Analysis
XRP 价格分析
XRP has been stuck between the downtrend line and the 20-day EMA ($0.54) for the past few days, indicating indecision between the bulls and the bears.
过去几天,XRP 一直徘徊在下降趋势线和 20 日均线(0.54 美元)之间,表明多头和空头之间犹豫不决。
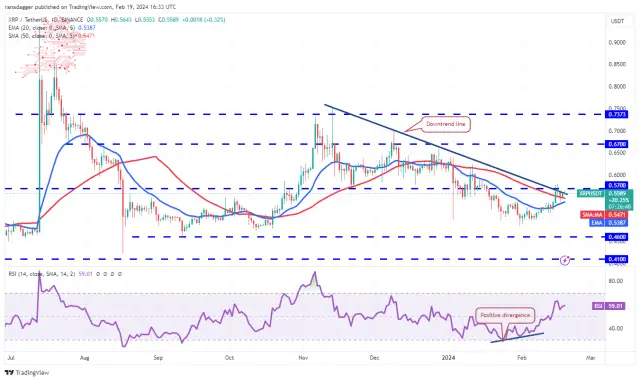
The 20-day EMA has started to turn gradually, and the RSI has risen into the positive zone, indicating that the bulls have the upper hand. If the price breaks and closes above the downtrend line, it will suggest that the correction may be over. The XRP/USDT pair will then attempt a rally to $0.67.
20日均线已开始逐渐转向,RSI已升至正区,表明多头占据上风。如果价格突破并收于下降趋势线上方,则表明调整可能已经结束。随后,XRP/USDT 货币对将尝试反弹至 0.67 美元。
On the contrary, if the price turns sharply from the downtrend line and plunges below the 20-day EMA, it will indicate that bears remain in command. The pair may then descend to $0.50.
相反,如果价格从下降趋势线急剧转向并跌破20日均线,则表明空头仍占主导地位。随后该货币对可能会跌至 0.50 美元。
Solana (SOL) Price Analysis
Solana pulled back to the neckline of the inverse head-and-shoulders pattern on Feb. 17, and the bulls held their ground.
Solana (SOL) 价格分析 Solana 于 2 月 17 日回落至反向头肩形态的颈线,多头坚守阵地。
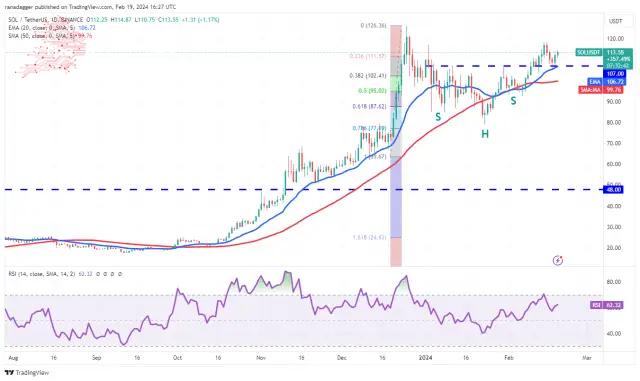
The upsloping 20-day EMA ($106) and the RSI above 62 indicate that the bulls have the upper hand. There is a minor resistance at $119, but that is likely to be crossed. The SOL/USDT pair could retest the stiff overhead resistance of $127. If this level is scaled, the pair may reach the pattern target of $135.
上升的 20 日均线(106 美元)和 RSI 高于 62 表明多头占据上风。 119 美元有一个小阻力,但很可能会被突破。 SOL/USDT 货币对可能会重新测试 127 美元的上方阻力位。如果突破该水平,该货币对可能会达到 135 美元的形态目标。
This optimistic view will be negated soon if the price turns down and dives below the 20-day EMA. That may result in long liquidations, pulling the pair to the 50-day SMA ($100).
如果价格下跌并跌破 20 日均线,这种乐观看法很快就会被否定。这可能会导致多头清算,将货币对拉至 50 日移动平均线(100 美元)。
Cardano (AVAX) Price Analysis
Cardano’s long tail on the Feb. 17 candlestick shows that the bulls continue to view dips to the 20-day EMA ($0.56) as a buying opportunity.
Cardano (AVAX) 价格分析 Cardano 在 2 月 17 日烛台上的长尾表明,多头继续将跌至 20 日均线(0.56 美元)视为买入机会。
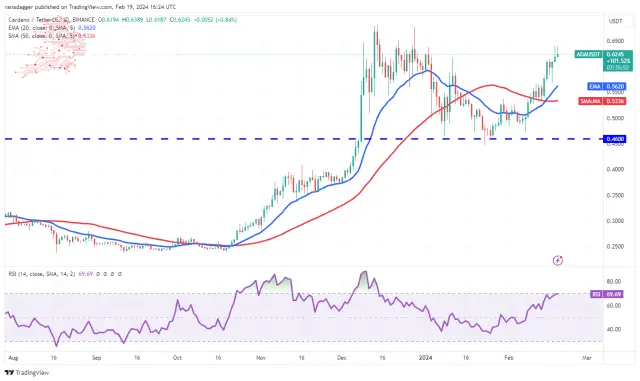
The bulls are trying to maintain the price above the immediate resistance of $0.62. If they manage to do that, the ADA/USDT pair could rally to the vital resistance at $0.68. This level may witness a tough battle between the bulls and the bears, but if the buyers prevail, the next stop is expected to be $0.90.
多头试图将价格维持在 0.62 美元的直接阻力位上方。如果他们成功做到这一点,ADA/USDT 货币对可能会反弹至 0.68 美元的重要阻力位。该水平可能见证多头和空头之间的一场硬仗,但如果买家获胜,下一站预计为 0.90 美元。
On the contrary, if the price turns sharply from $0.68, it will indicate that the bears vigorously defend the level. A break below the 20-day EMA will suggest that the bullish momentum has weakened.
相反,如果价格从 0.68 美元急剧转向,则表明空头正在大力捍卫该水平。跌破 20 日均线将表明看涨势头已经减弱。
Avalanche (AVAX) Price Analysis
雪崩 (AVAX) 价格分析
Avalanche turned down from the $42 level on Feb. 15, but a positive sign is that the bulls did not allow the price to dip below the 20-day EMA ($38.40).
Avalanche 从 2 月 15 日的 42 美元水平回落,但一个积极的迹象是多头不允许价格跌破 20 日均线(38.40 美元)。
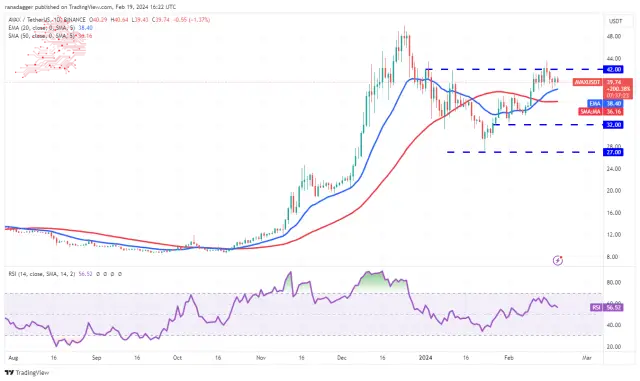
The bulls will again try to clear the obstacle at $42, and if they succeed, the AVAX/USDT pair will complete an inverse H&S pattern. The pair may then skyrocket to $50, a difficult barrier to cross.
多头将再次尝试清除 42 美元的障碍,如果成功,AVAX/USDT 货币对将完成反向 H&S 模式。随后该货币对可能会飙升至 50 美元,这是一个难以跨越的障碍。
On the downside, the 20-day EMA is the crucial support to watch out for. If this level cracks, the pair may slip to the 50-day SMA ($36.16). Such a move will suggest that the pair may oscillate between $32 and $42 for some time.
下行方面,20 日均线是值得关注的关键支撑。如果该水平破裂,该货币对可能会滑向 50 日移动平均线(36.16 美元)。这一举动表明该货币对可能会在 32 美元至 42 美元之间波动一段时间。
Dogecoin (DOGE) Price Analysis
The bears tried to pull Dogecoin back into the symmetrical triangle pattern on Feb. 17, but the bulls protected the level aggressively.
狗狗币 (DOGE) 价格分析 2 月 17 日,空头试图将狗狗币拉回对称三角形形态,但多头积极保护该水平。
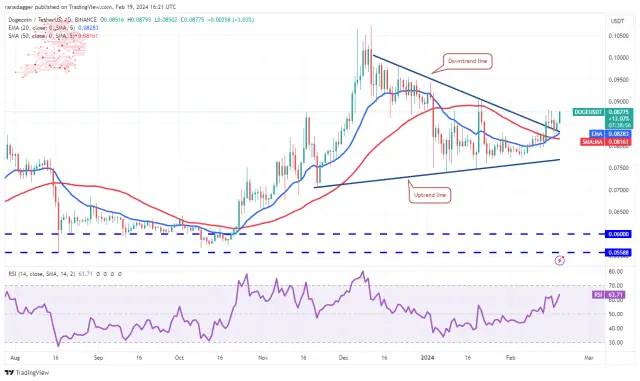
The 20-day EMA ($0.08) has started to turn up gradually, and the RSI is above 63, indicating that the bulls are attempting a comeback. If the bulls clear the hurdle at $0.09, the DOGE/USDT pair could climb to the $0.10 to $0.11 resistance zone.
20日均线(0.08美元)已开始逐渐上升,RSI高于63,表明多头正在尝试卷土重来。如果多头突破 0.09 美元的障碍,DOGE/USDT 货币对可能会攀升至 0.10 美元至 0.11 美元的阻力区。
This optimistic view will be invalidated soon if the price turns down and collapses below the moving averages. Such a move indicates that bears sell on every minor relief rally. The selling could intensify on a break below the uptrend line.
如果价格下跌并跌破移动平均线,这种乐观的看法很快就会失效。这样的举动表明,空头在每次小幅缓解反弹时都会卖出。如果跌破上升趋势线,抛售可能会加剧。
Source – Rakesh Upadhyay
来源——Rakesh Upadhyay
Source: https://thebittimes.com/latest-market-overview-19th-feb-spx-dxy-btc-eth-bnb-sol-xrp-ada-avax-doge-tbt80262.html
资料来源:https://thebittimes.com/latest-market-overview-19th-feb-spx-dxy-btc-eth-bnb-sol-xrp-ada-avax-doge-tbt80262.html
 Crypto Daily™
 BlockchainReporter
 Crypto Daily™
 Crypto Daily™
 crypto.news
 CoinPedia News
 Cryptopolitan_News
 Crypto Daily™
 BSCN
BSCN


