


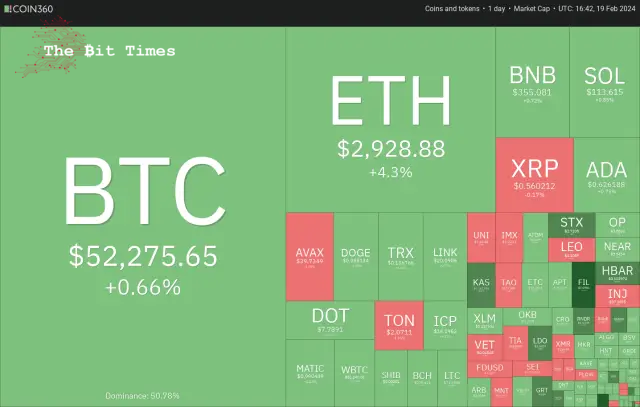
Bitcoin’s (BTC) market value has faced challenges in stabilising above the $52,000 mark, yet this stabilisation period might prove advantageous for other cryptocurrencies.
비트코인(BTC) 시장 가치는 52,000달러 이상으로 안정화하는 데 어려움을 겪었지만, 이 안정화 기간은 다른 암호화폐에 유리한 것으로 입증될 수 있습니다.
The S&P 500 Index saw its five-week streak of gains end, dropping 0.42% the previous week, triggered by the U.S. Consumer Price Index and Producer Price Index for January exceeding forecasts. The unexpected rise in inflation metrics fueled worries that the Federal Reserve might postpone interest rate reductions until later in the year, contrary to earlier predictions of a cut by March.
S&P 500 지수는 미국 소비자 물가 지수와 1월 생산자 물가 지수가 예상치를 상회하면서 지난주 0.42% 하락하며 5주 연속 상승세를 마감했습니다. 인플레이션 지표의 예상치 못한 상승은 연준이 금리 인하를 3월까지 인하할 것이라는 당초 예측과는 달리 올해 말까지 연기할 수도 있다는 우려를 불러일으켰습니다.
Despite these negative economic indicators, Bitcoin experienced an 8% surge, closing the week at $52,137, marking its highest weekly closure since November 2021. The recent persistence of $52,000 as a point of resistance has not prompted quick profit-taking among Bitcoin investors, indicating continued long-term optimism within the market.
이러한 부정적인 경제 지표에도 불구하고 비트코인은 8% 급등을 경험하여 한 주를 52,137달러로 마감하여 2021년 11월 이후 가장 높은 주간 마감을 기록했습니다. 최근 저항 지점으로 52,000달러가 지속되는 상황은 비트코인 투자자들 사이에서 빠른 차익 실현을 촉발하지 못했습니다. 시장 내에서 장기적인 낙관론이 지속되었습니다.
Another positive in favour of Bitcoin is that outflows from the Grayscale Bitcoin Trust (GBTC) have been slowing down. After bleeding $5.64 billion in January, the outflows from GBTC have slowed to $1.37 billion in February.
비트코인에 유리한 또 다른 긍정적인 점은 그레이스케일 비트코인 트러스트(GBTC)의 유출이 둔화되고 있다는 것입니다. GBTC의 유출액은 1월 56억 4천만 달러 이후 2월에는 13억 7천만 달러로 둔화되었습니다.
Could Bitcoin start the next leg of the uptrend, pulling select altcoins higher? Let’s analyze the charts to find out.
비트코인이 상승 추세의 다음 단계를 시작하여 일부 알트코인을 더 높이 끌어올릴 수 있을까요? 알아보기 위해 차트를 분석해 보겠습니다.
S&P 500 Index (SPX) Market Analysis
S&P 500 지수(SPX) 시장 분석
The S&P 500 Index rebounded off the 20-day exponential moving average (4,940) on Feb. 13, indicating an uptrend.
S&P 500 지수는 2월 13일 20일 지수이동평균(4,940)에서 반등하며 상승세를 나타냈다.
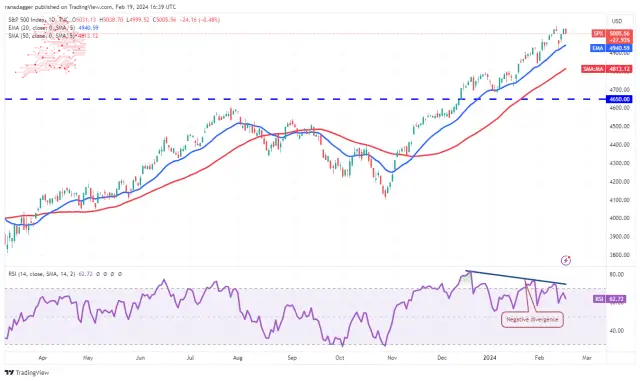
However, the bears are not ready to give up easily and are trying to protect the overhead resistance 5,048. The negative divergence on the relative strength index (RSI) cautions of a possible correction or consolidation in the short term.
하지만 하락세는 쉽게 포기하지 않고 머리 위 저항선인 5,048을 방어하기 위해 노력하고 있습니다. 상대강도지수(RSI)의 마이너스 다이버전스는 단기적으로 조정이나 통합 가능성을 경고합니다.
A break below the 20-day EMA will indicate the start of a deeper correction. The index could then drop to the 50-day simple moving average (4,813) and 4,650.
20일 EMA 아래로 떨어지면 더 깊은 조정이 시작된다는 의미입니다. 그러면 지수는 50일 단순 이동 평균(4,813)과 4,650까지 떨어질 수 있습니다.
Contrary to this assumption, if the index continues higher and breaks above 5,048, it will signal the resumption of the uptrend. The index could then surge toward 5,200.
이러한 가정과 달리 지수가 계속 상승하여 5,048을 넘어서면 상승 추세가 재개된다는 신호입니다. 그러면 지수는 5,200까지 급등할 수 있습니다.
U.S. Dollar Index (DXY) Market Analysis
미국 달러 지수(DXY) 시장 분석
The U.S. dollar Index attempted to start an up move on Feb. 13, but the rally met with intense selling pressure near 105.
미국 달러 지수는 2월 13일 상승을 시도했지만 랠리는 105 근처에서 강한 매도 압력에 부딪혔습니다.
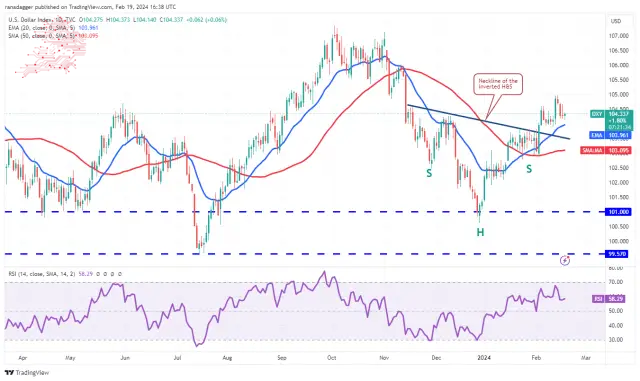
The price turned down and reached the 20-day EMA (104), a necessary support to watch out for. If the price rebounds off the 20-day EMA, the bulls will make one more attempt to propel the index to 106 and then to 107.
가격이 하락하여 주의해야 할 필수 지원인 20일 EMA(104)에 도달했습니다. 가격이 20일 EMA에서 반등하면 강세론자들은 지수를 106으로, 그 다음에는 107로 끌어올리기 위해 한 번 더 시도할 것입니다.
Conversely, if the index breaks below the 20-day EMA, it will indicate that higher levels continue to attract selling by the bears. The index may then slump to the 50-day SMA (103), likely attracting buyers.
반대로, 지수가 20일 EMA 아래로 떨어지면 더 높은 수준이 계속해서 약세의 매도를 유도한다는 것을 나타냅니다. 이후 지수는 50일 SMA(103)까지 하락해 구매자들의 관심을 끌 가능성이 높습니다.
Bitcoin (BTC) Market Analysis
비트코인(BTC) 시장 분석
Bitcoin is consolidating in an uptrend. The bears are trying to stall the rally at $52,000, but the bulls have kept up the pressure.
비트코인은 상승세로 통합되고 있습니다. 하락세는 52,000달러에서 랠리를 지연시키려고 노력하고 있지만 상승세는 계속해서 압력을 가하고 있습니다.
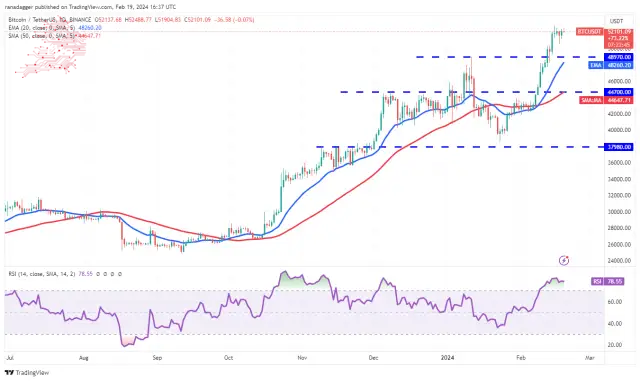
A tight consolidation near a crucial resistance generally resolves to the upside. If the bulls shove and maintain the price above $52,000, it will indicate the start of the next leg of the uptrend. The BTC/USDT pair could then surge toward $60,000.
중요한 저항 근처에서 긴밀한 통합은 일반적으로 상승세로 해소됩니다. 황소가 가격을 $52,000 이상으로 유지하면 다음 상승 추세의 시작을 의미합니다. 그러면 BTC/USDT 쌍이 60,000달러까지 급등할 수 있습니다.
If bears want to prevent the move, they must quickly drag the price below the 20-day EMA ($48,260). If they do that, the stops of several short-term traders may get hit. The pair could then plunge to the 50-day SMA ($44,647).
하락세를 막고 싶다면 가격을 20일 EMA($48,260) 아래로 빠르게 끌어내야 합니다. 그렇게 하면 몇몇 단기 트레이더들의 정지가 타격을 입을 수도 있다. 그러면 통화쌍은 50일 SMA($44,647)까지 급락할 수 있습니다.
Ether (ETH) Price Analysis
이더(ETH) 가격 분석
Ether rebounded off $2,717 on Feb. 17, indicating that the bulls are trying to flip the level into support.
이더리움은 2월 17일에 2,717달러로 반등했는데, 이는 강세장이 지지선으로 반전하려고 노력하고 있음을 나타냅니다.
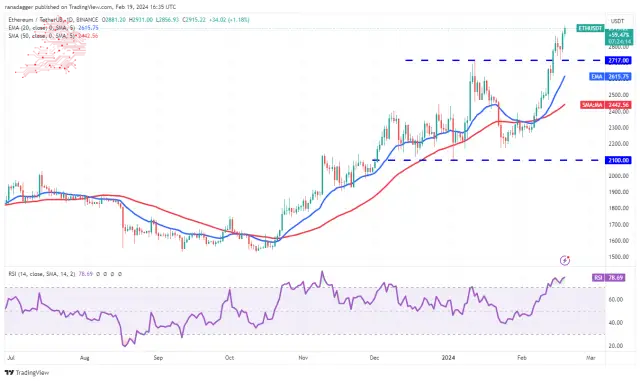
The ETH/USDT pair rose above the immediate resistance of $2,868 on Feb. 18, indicating the resumption of the uptrend. Buyers will try to maintain the momentum and kick the price to $ the psychologically critical level of $3,000.
ETH/USDT 쌍은 2월 18일 즉각적인 저항선인 $2,868를 넘어 상승하여 상승 추세의 재개를 나타냈습니다. 구매자는 추진력을 유지하고 가격을 심리적으로 중요한 수준인 $3,000까지 끌어올리려고 노력할 것입니다.
The rally of the past few days has sent the RSI above 78, indicating the possibility of a minor correction or consolidation in the near term. Sellers must tug the price below the 20-day EMA ($2,615) to signal a short-term top.
지난 며칠 동안의 랠리로 인해 RSI가 78을 넘어섰으며, 이는 단기적으로 소폭의 조정이나 횡보 가능성을 나타냅니다. 판매자는 단기 최고점을 알리기 위해 가격을 20일 EMA($2,615) 아래로 끌어내야 합니다.
BNB Price Analysis
BNB 가격 분석
BNB는 상승 추세에서 후퇴하여 단기 트레이더의 이익 예약을 제안했습니다. 일반적으로 강한 상승 추세에서는 하락세가 3일 이상 지속되지 않습니다.
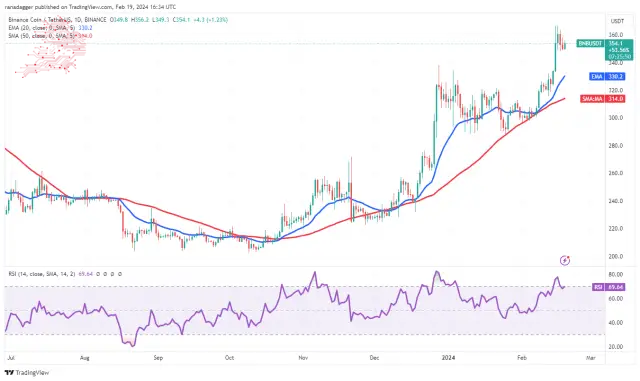
The rising 20-day EMA ($330) and the RSI near the overbought territory indicate that the bulls are in control. If the price turns up and breaks above $367, it will suggest that the uptrend has resumed. The BNB/USDT pair could then attempt a rally to $400.
상승하는 20일 EMA($330)와 과매수 영역 부근의 RSI는 상승세가 통제되고 있음을 나타냅니다. 가격이 상승하여 367달러를 넘어서면 상승 추세가 재개되었음을 의미합니다. 그러면 BNB/USDT 쌍은 400달러까지 상승을 시도할 수 있습니다.
Instead, if the price continues lower and slips below $348, the pair may reach the 20-day EMA. This level may again attract buyers, but if the bears prevail, the pair may plummet to the 50-day SMA ($314).
대신 가격이 계속 낮아지고 $348 아래로 떨어지면 해당 쌍은 20일 EMA에 도달할 수 있습니다. 이 수준에서는 다시 구매자의 관심을 끌 수 있지만 하락세가 우세할 경우 해당 쌍은 50일 SMA($314)까지 급락할 수 있습니다.
XRP Price Analysis
XRP 가격 분석
XRP has been stuck between the downtrend line and the 20-day EMA ($0.54) for the past few days, indicating indecision between the bulls and the bears.
XRP는 지난 며칠 동안 하락 추세선과 20일 EMA(0.54달러) 사이에 갇혀 있어 상승세와 하락세 사이의 우유부단함을 나타냅니다.
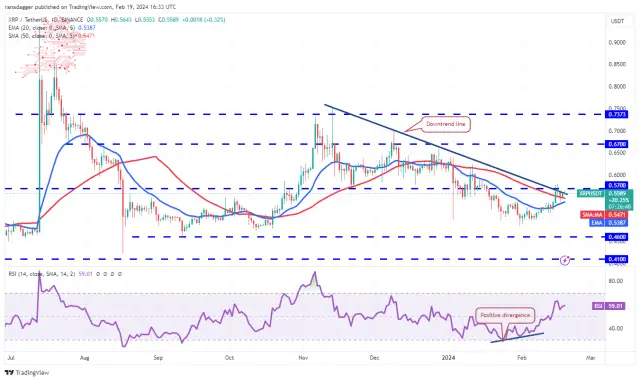
The 20-day EMA has started to turn gradually, and the RSI has risen into the positive zone, indicating that the bulls have the upper hand. If the price breaks and closes above the downtrend line, it will suggest that the correction may be over. The XRP/USDT pair will then attempt a rally to $0.67.
20일 EMA가 점진적으로 반전하기 시작했고 RSI가 플러스 영역으로 상승하여 황소가 우위를 점하고 있음을 나타냅니다. 가격이 하향 추세선 위에서 돌파되고 마감되면 조정이 끝났음을 의미합니다. 그런 다음 XRP/USDT 쌍은 $0.67까지 상승을 시도합니다.
On the contrary, if the price turns sharply from the downtrend line and plunges below the 20-day EMA, it will indicate that bears remain in command. The pair may then descend to $0.50.
반대로, 가격이 하락 추세선에서 급격하게 벗어나 20일 EMA 아래로 떨어지면 하락세가 여전히 강세를 유지하고 있음을 나타냅니다. 그러면 해당 쌍은 $0.50까지 하락할 수 있습니다.
Solana (SOL) Price Analysis
Solana pulled back to the neckline of the inverse head-and-shoulders pattern on Feb. 17, and the bulls held their ground.
솔라나(SOL) 가격 분석 솔라나는 2월 17일 역헤드앤숄더 패턴의 네크라인으로 후퇴했고 상승세는 그 자리를 지켰습니다.
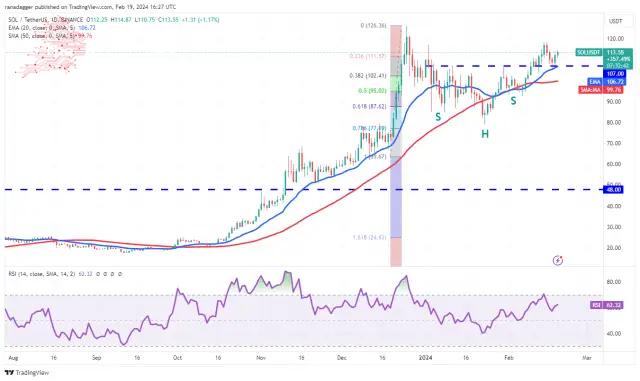
The upsloping 20-day EMA ($106) and the RSI above 62 indicate that the bulls have the upper hand. There is a minor resistance at $119, but that is likely to be crossed. The SOL/USDT pair could retest the stiff overhead resistance of $127. If this level is scaled, the pair may reach the pattern target of $135.
상승세를 보이는 20일 EMA($106)와 62를 넘는 RSI는 황소가 우위를 점하고 있음을 나타냅니다. 119달러에 약간의 저항이 있지만 이를 넘을 가능성이 높습니다. SOL/USDT 쌍은 $127의 견고한 오버헤드 저항을 다시 테스트할 수 있습니다. 이 수준이 조정되면 쌍은 $135의 패턴 목표에 도달할 수 있습니다.
This optimistic view will be negated soon if the price turns down and dives below the 20-day EMA. That may result in long liquidations, pulling the pair to the 50-day SMA ($100).
가격이 하락하고 20일 EMA 아래로 떨어지면 이러한 낙관적인 견해는 곧 무효화될 것입니다. 이로 인해 청산이 길어지고 해당 쌍이 50일 SMA($100)로 끌어올릴 수 있습니다.
Cardano (AVAX) Price Analysis
Cardano’s long tail on the Feb. 17 candlestick shows that the bulls continue to view dips to the 20-day EMA ($0.56) as a buying opportunity.
Cardano(AVAX) 가격 분석 Cardano의 2월 17일 캔들스틱 롱테일은 상승세가 계속해서 20일 EMA(0.56달러) 하락을 매수 기회로 보고 있음을 보여줍니다.
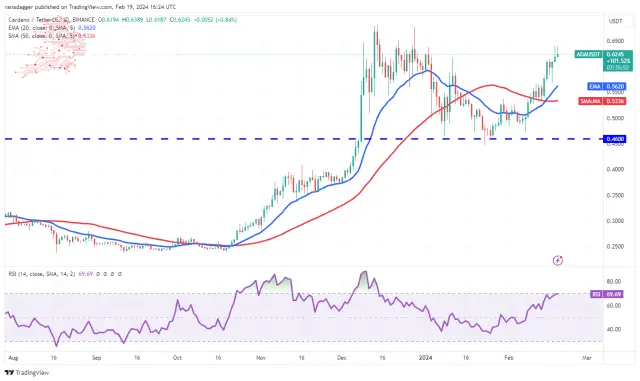
The bulls are trying to maintain the price above the immediate resistance of $0.62. If they manage to do that, the ADA/USDT pair could rally to the vital resistance at $0.68. This level may witness a tough battle between the bulls and the bears, but if the buyers prevail, the next stop is expected to be $0.90.
황소는 즉각적인 저항인 $0.62 이상으로 가격을 유지하려고 노력하고 있습니다. 그렇게 한다면 ADA/USDT 쌍은 $0.68의 중요한 저항선까지 반등할 수 있습니다. 이 수준은 황소와 곰 사이의 힘든 싸움을 목격할 수 있지만 구매자가 승리할 경우 다음 중지점은 $0.90가 될 것으로 예상됩니다.
On the contrary, if the price turns sharply from $0.68, it will indicate that the bears vigorously defend the level. A break below the 20-day EMA will suggest that the bullish momentum has weakened.
반대로 가격이 0.68달러에서 급격하게 변하면 하락세가 강력하게 방어하고 있음을 나타냅니다. 20일 EMA 아래로 떨어지면 강세 모멘텀이 약해졌음을 의미합니다.
Avalanche (AVAX) Price Analysis
눈사태(AVAX) 가격 분석
Avalanche turned down from the $42 level on Feb. 15, but a positive sign is that the bulls did not allow the price to dip below the 20-day EMA ($38.40).
Avalanche는 2월 15일에 $42 수준에서 하락했지만 긍정적인 신호는 가격이 20일 EMA($38.40) 아래로 떨어지는 것을 허용하지 않았다는 것입니다.
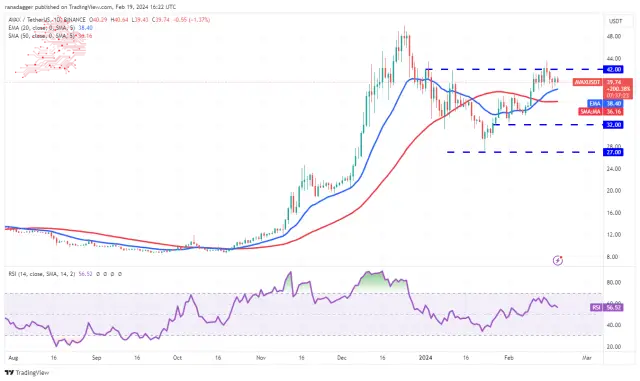
The bulls will again try to clear the obstacle at $42, and if they succeed, the AVAX/USDT pair will complete an inverse H&S pattern. The pair may then skyrocket to $50, a difficult barrier to cross.
강세론자들은 다시 42달러에 장애물을 극복하려고 시도할 것이며, 성공한다면 AVAX/USDT 쌍은 역 H&S 패턴을 완성할 것입니다. 그러면 그 쌍은 넘기 어려운 장벽인 50달러까지 치솟을 수 있습니다.
On the downside, the 20-day EMA is the crucial support to watch out for. If this level cracks, the pair may slip to the 50-day SMA ($36.16). Such a move will suggest that the pair may oscillate between $32 and $42 for some time.
단점이라면 20일 EMA가 주목해야 할 중요한 지지선이라는 것입니다. 이 수준이 깨지면 해당 쌍은 50일 SMA($36.16)로 하락할 수 있습니다. 이러한 움직임은 통화쌍이 한동안 $32에서 $42 사이에서 변동할 수 있음을 의미합니다.
Dogecoin (DOGE) Price Analysis
The bears tried to pull Dogecoin back into the symmetrical triangle pattern on Feb. 17, but the bulls protected the level aggressively.
Dogecoin(DOGE) 가격 분석 하락세는 2월 17일 Dogecoin을 대칭 삼각형 패턴으로 다시 끌어들이려고 시도했지만 상승세는 공격적으로 수준을 보호했습니다.
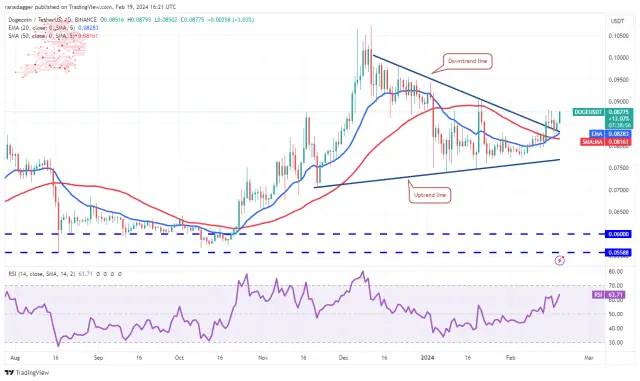
The 20-day EMA ($0.08) has started to turn up gradually, and the RSI is above 63, indicating that the bulls are attempting a comeback. If the bulls clear the hurdle at $0.09, the DOGE/USDT pair could climb to the $0.10 to $0.11 resistance zone.
20일 EMA($0.08)가 점차 상승하기 시작했고 RSI가 63을 넘어 상승세가 회복을 시도하고 있음을 나타냅니다. 황소가 $0.09의 장애물을 통과하면 DOGE/USDT 쌍은 $0.10~$0.11 저항 영역으로 올라갈 수 있습니다.
This optimistic view will be invalidated soon if the price turns down and collapses below the moving averages. Such a move indicates that bears sell on every minor relief rally. The selling could intensify on a break below the uptrend line.
가격이 하락하고 이동 평균 아래로 떨어지면 이러한 낙관적 견해는 곧 무효화됩니다. 이러한 움직임은 모든 소규모 안도 랠리에서 하락세가 매도한다는 것을 나타냅니다. 상승 추세선 아래로 돌파할 경우 매도세가 강화될 수 있습니다.
Source – Rakesh Upadhyay
출처 – Rakesh Upadhyay
Source: https://thebittimes.com/latest-market-overview-19th-feb-spx-dxy-btc-eth-bnb-sol-xrp-ada-avax-doge-tbt80262.html
출처: https://thebittimes.com/latest-market-overview-19th-feb-spx-dxy-btc-eth-bnb-sol-xrp-ada-avax-doge-tbt80262.html
 ETHNews
 Coin Edition
 DogeHome
 Crypto Daily™
 BlockchainReporter
 Crypto Daily™
 Crypto Daily™
 crypto.news
 CoinPedia News


