Bitcoin (BTC) continues to trade within a large range, suggesting indecision about the next trending move. Analysts trying to predict the direction are enthused by the $1.3 billion of USD Coin (USDC) transferred to Coinbase by whale addresses. Expectations are that the funds will be used to buy Bitcoin and Ether (ETH).
Bitcoin (BTC) continúa operando dentro de un amplio rango, lo que sugiere indecisión sobre el próximo movimiento de tendencia. Los analistas que intentan predecir la dirección están entusiasmados con los 1.300 millones de dólares en USD Coin (USDC) transferidos a Coinbase por las direcciones de ballenas. Se espera que los fondos se utilicen para comprar Bitcoin y Ether (ETH).
Large investors are not only buying the top two coins by market capitalization. CoinShares head of research James Butterfill said in a recent report based on a survey of 64 institutional investors that 15% of the respondents had invested in Solana (SOL). In comparison, none of the investors held Solana in the firm’s January survey.
Los grandes inversores no sólo compran las dos monedas principales por capitalización de mercado. El jefe de investigación de CoinShares, James Butterfill, dijo en un informe reciente basado en una encuesta de 64 inversores institucionales que el 15% de los encuestados había invertido en Solana (SOL). En comparación, ninguno de los inversores tenía Solana en la encuesta de enero de la empresa.
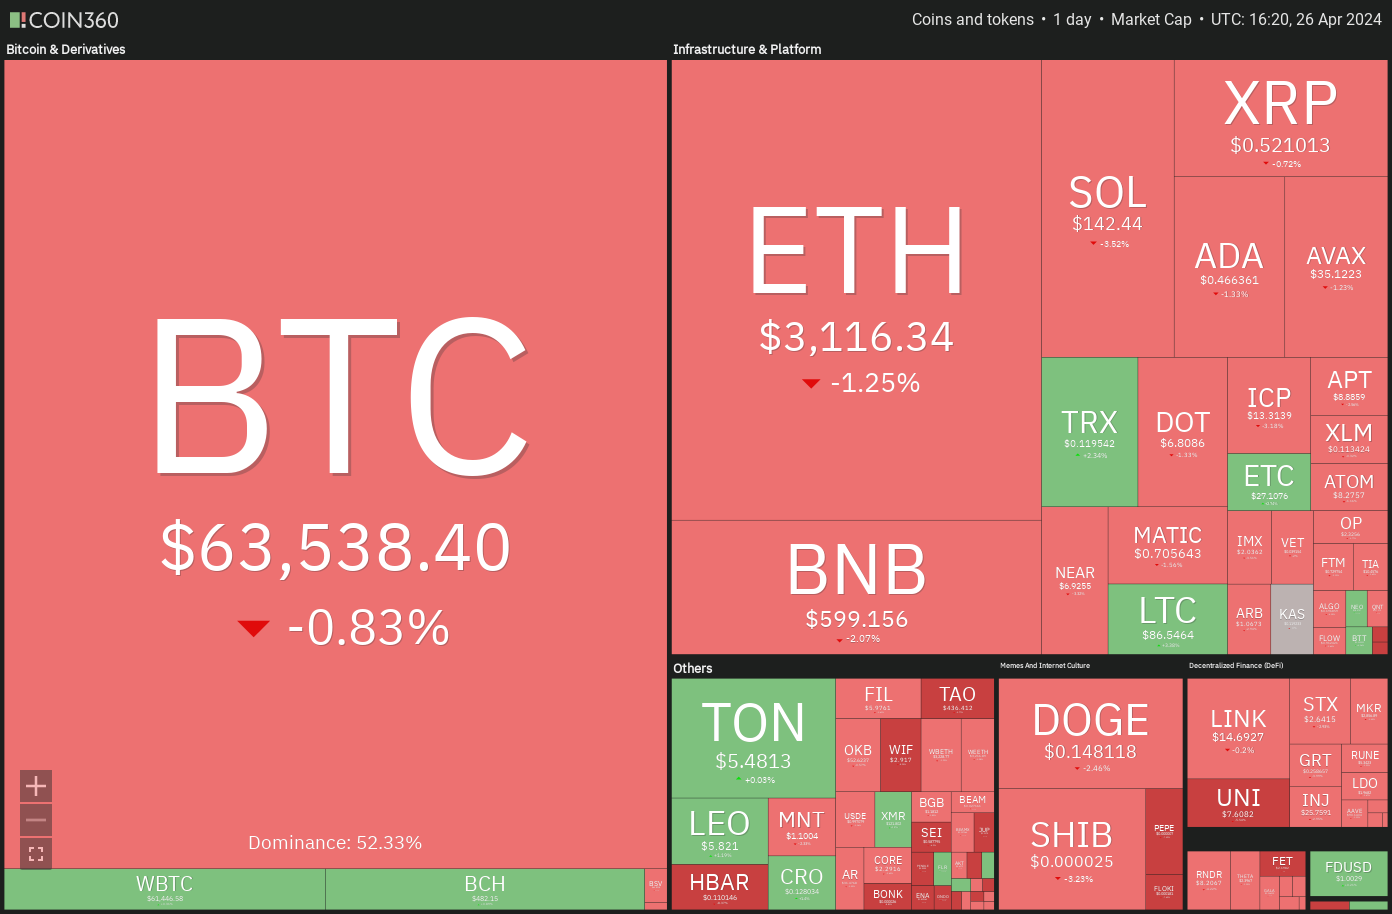
Crypto market data daily view. Source: Coin360
Vista diaria de datos del mercado criptográfico. Fuente: Coin360
Morgan Creek Capital CEO Mark Yusko said in a recent interview with The Wolf Of All Streets podcast that about $300 billion of baby boomers’ wealth is likely to enter into digital assets within 12 months. This inflow could boost the cryptocurrency market capitalization to $6 trillion.
El director ejecutivo de Morgan Creek Capital, Mark Yusko, dijo en una entrevista reciente con el podcast The Wolf Of All Streets que es probable que alrededor de 300 mil millones de dólares de la riqueza de los baby boomers entren en activos digitales dentro de 12 meses. Esta entrada podría aumentar la capitalización del mercado de criptomonedas a 6 billones de dólares.
Can buyers thwart attempts by the bears to deepen the correction in Bitcoin and altcoins? Let’s analyze the charts of the top 10 cryptocurrencies to find out.
¿Pueden los compradores frustrar los intentos de los bajistas de profundizar la corrección en Bitcoin y altcoins? Analicemos los gráficos de las 10 principales criptomonedas para descubrirlo.
Bitcoin price analysis
Análisis de precios de Bitcoin
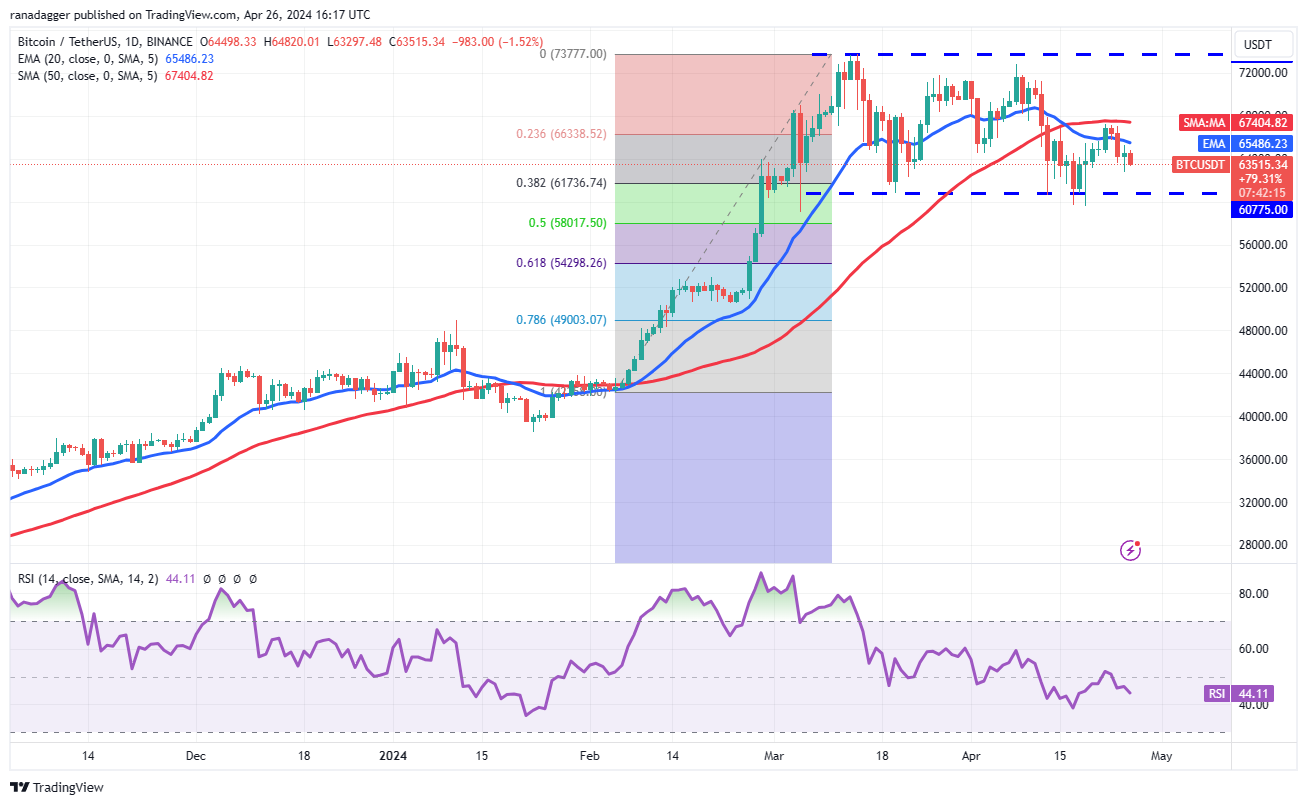
Bitcoin has been trading below the moving averages for the past few days, but the bears are struggling to sink the price to the crucial support at $60,775. This suggests that selling dries up at lower levels.
Bitcoin ha estado cotizando por debajo de los promedios móviles durante los últimos días, pero los bajistas están luchando por bajar el precio hasta el soporte crucial de $60,775. Esto sugiere que las ventas se agotan en niveles más bajos.
BTC/USDT daily chart. Source: TradingView
Gráfico diario BTC/USDT. Fuente: TradingView
The price is stuck between the 50-day simple moving average ($67,404) and the vital support at $60,775. The 20-day exponential moving average ($65,542) has started to turn down and the relative strength index (RSI) is just below the midpoint, indicating a minor advantage to the bears.
El precio está atrapado entre el promedio móvil simple de 50 días ($67,404) y el soporte vital en $60,775. El promedio móvil exponencial de 20 días ($65,542) ha comenzado a bajar y el índice de fuerza relativa (RSI) está justo por debajo del punto medio, lo que indica una ventaja menor para los bajistas.
A break and close below $59,600 could open the doors for a drop to the 61.8% Fibonacci retracement level of $54,298.
Una ruptura y un cierre por debajo de 59.600$ podrían abrir las puertas a una caída hasta el nivel de retroceso de Fibonacci del 61,8% de 54.298$.
This bearish view will be negated in the near term if the price rises above the 50-day SMA. The BTC/USDT pair may then climb to $73,777. This remains the key overhead resistance for the bulls to overcome.
Esta visión bajista quedará anulada en el corto plazo si el precio sube por encima de la SMA de 50 días. El par BTC/USDT podría subir a 73.777 dólares. Esta sigue siendo la principal resistencia clave que los alcistas deben superar.
Ether price analysis
Análisis de precios de éter
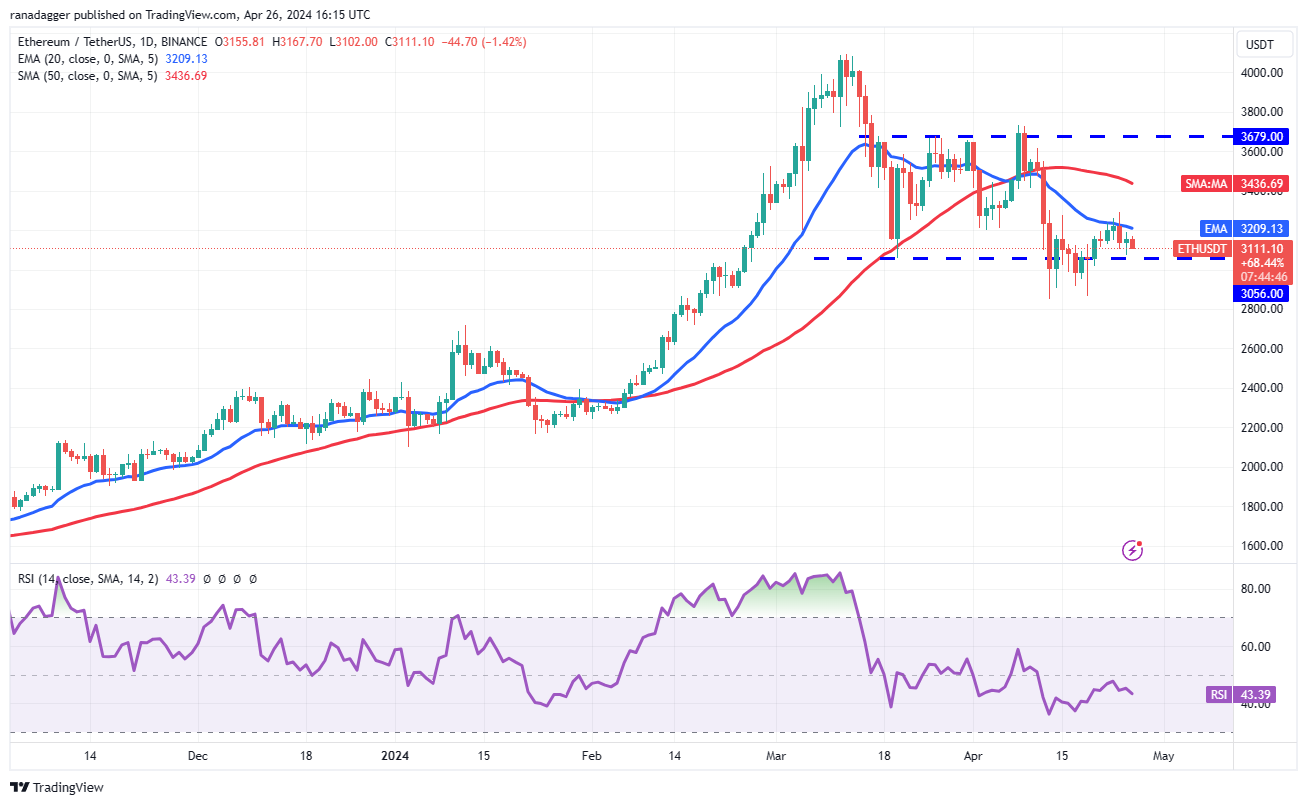
Ether has been oscillating between the 20-day EMA ($3,209) and the horizontal support of $3,056 for the past few days.
Ether ha estado oscilando entre la EMA de 20 días ($3209) y el soporte horizontal de $3056 durante los últimos días.
ETH/USDT daily chart. Source: TradingView
Gráfico diario ETH/USDT. Fuente: TradingView
This tight range trading is unlikely to continue for long. If the price pierces the 20-day EMA, the ETH/USDT pair could rise to the 50-day SMA ($3,436). This level may act as a short-term barrier, but it is likely to be crossed. The pair may then jump to $3,679.
Es poco probable que esta negociación en un rango estrecho continúe por mucho tiempo. Si el precio perfora la EMA de 20 días, el par ETH/USDT podría subir hasta la SMA de 50 días ($3,436). Este nivel puede actuar como una barrera a corto plazo, pero es probable que se supere. El par podría entonces saltar a 3.679 dólares.
Conversely, if the price turns down and breaks below $3,056, it will suggest that the bears are in command. The pair may then retest the critical support at $2,852. A Break below this level may result in a decline to $2,700.
Por el contrario, si el precio baja y cae por debajo de $ 3,056, sugerirá que los bajistas están al mando. El par podría entonces volver a probar el soporte crítico en 2.852$. Una ruptura por debajo de este nivel puede resultar en una caída a $2,700.
BNB price analysis
Análisis de precios de BNB
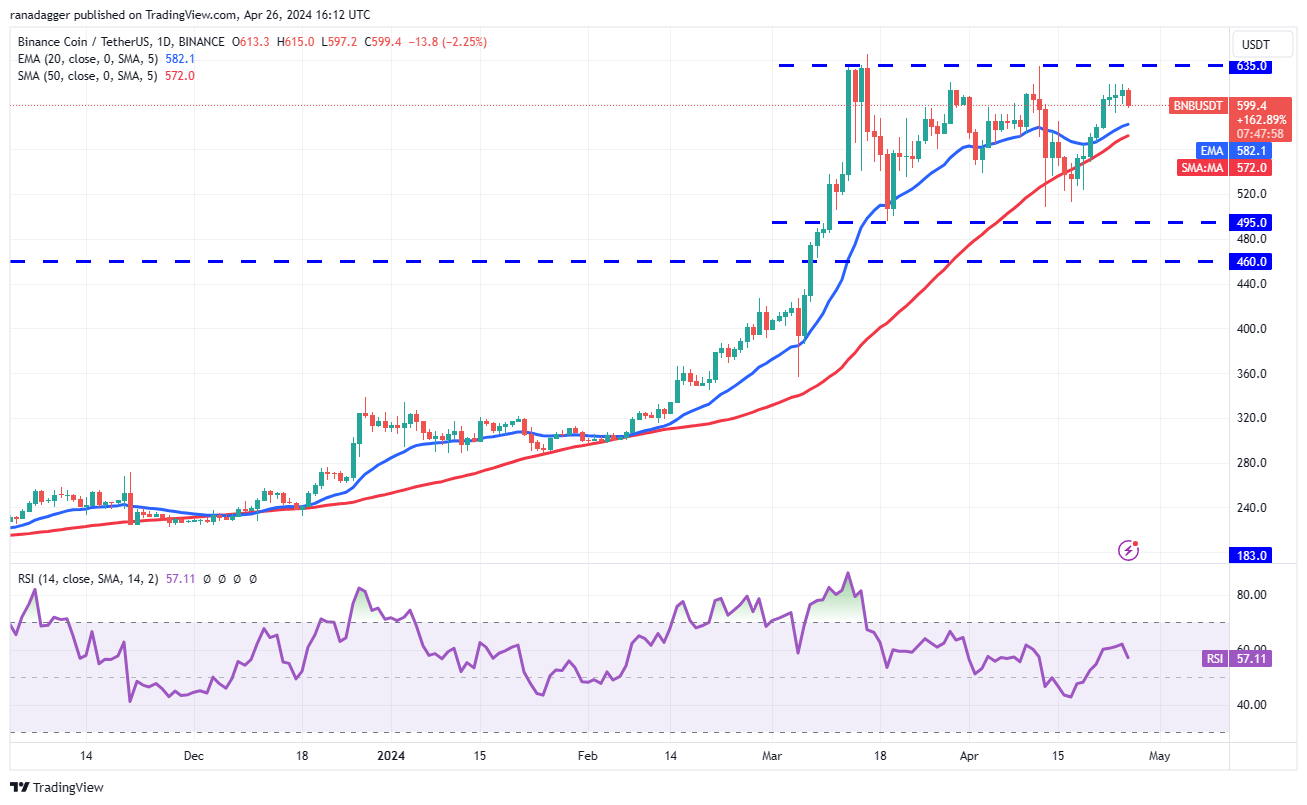
BNB (BNB) has been struggling to reach the overhead resistance of $635, suggesting that the bears are defending the level with vigor.
BNB (BNB) ha estado luchando por alcanzar la resistencia superior de $ 635, lo que sugiere que los bajistas están defendiendo el nivel con vigor.
BNB/USDT daily chart. Source: TradingView
Gráfico diario BNB/USDT. Fuente: TradingView
However, a positive sign is that the bulls have not rushed to the exit. The price may pull back to the moving averages, where it is likely to find support. If the price rebounds off the moving averages with strength, it will enhance the possibility of a break above $635. If that happens, the BNB/USDT pair could surge to $692 and eventually to the pattern target of $775.
Sin embargo, una señal positiva es que los alcistas no se han apresurado a salir. El precio puede retroceder hasta las medias móviles, donde es probable que encuentre soporte. Si el precio rebota con fuerza en las medias móviles, aumentará la posibilidad de una ruptura por encima de los USD 635. Si eso sucede, el par BNB/USDT podría subir a $692 y eventualmente al objetivo del patrón de $775.
On the other hand, if the price slides below the moving averages, it will indicate that the range-bound action may extend for a few more days.
Por otro lado, si el precio cae por debajo de las medias móviles, indicará que la acción dentro del rango puede extenderse por unos días más.
Solana price analysis
Análisis de precios de Solana
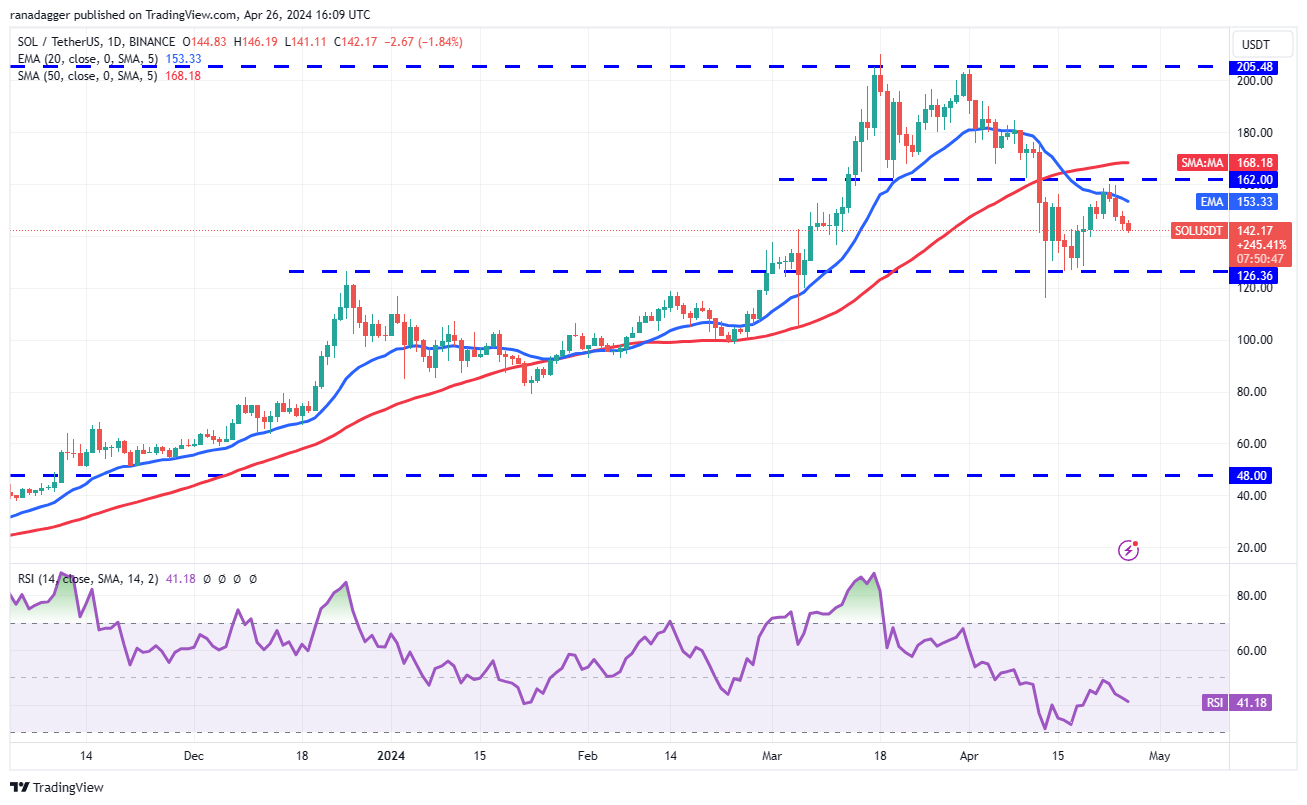
Solana (SOL) turned down from the overhead resistance of $162 on April 24, indicating that the bears are active at higher levels.
Solana (SOL) rechazó la resistencia superior de 162 dólares el 24 de abril, lo que indica que los bajistas están activos en niveles más altos.
SOL/USDT daily chart. Source: TradingView
Gráfico diario SOL/USDT. Fuente: TradingView
The 20-day EMA ($153) is sloping down gradually, and the RSI is in the negative zone, indicating that the bears have the edge. The SOL/USDT pair could descend to the solid support at $126. If the price rebounds off this level with strength, it will indicate that the pair may remain sandwiched between $126 and $162 for a while longer.
La EMA de 20 días ($153) está cayendo gradualmente y el RSI está en la zona negativa, lo que indica que los bajistas tienen ventaja. El par SOL/USDT podría descender al sólido soporte de $126. Si el precio rebota con fuerza en este nivel, indicará que el par puede permanecer atrapado entre $126 y $162 por un tiempo más.
The first sign of strength will be a break and close above the 50-day SMA ($168). That will open the doors for a possible rally to $205. Contrarily, a break below $126 could sink the pair to $100.
La primera señal de fortaleza será una ruptura y un cierre por encima de la SMA de 50 días ($168). Eso abrirá las puertas a un posible repunte hasta los 205 dólares. Por el contrario, una ruptura por debajo de $126 podría hundir el par a $100.
XRP price analysis
Análisis de precios XRP
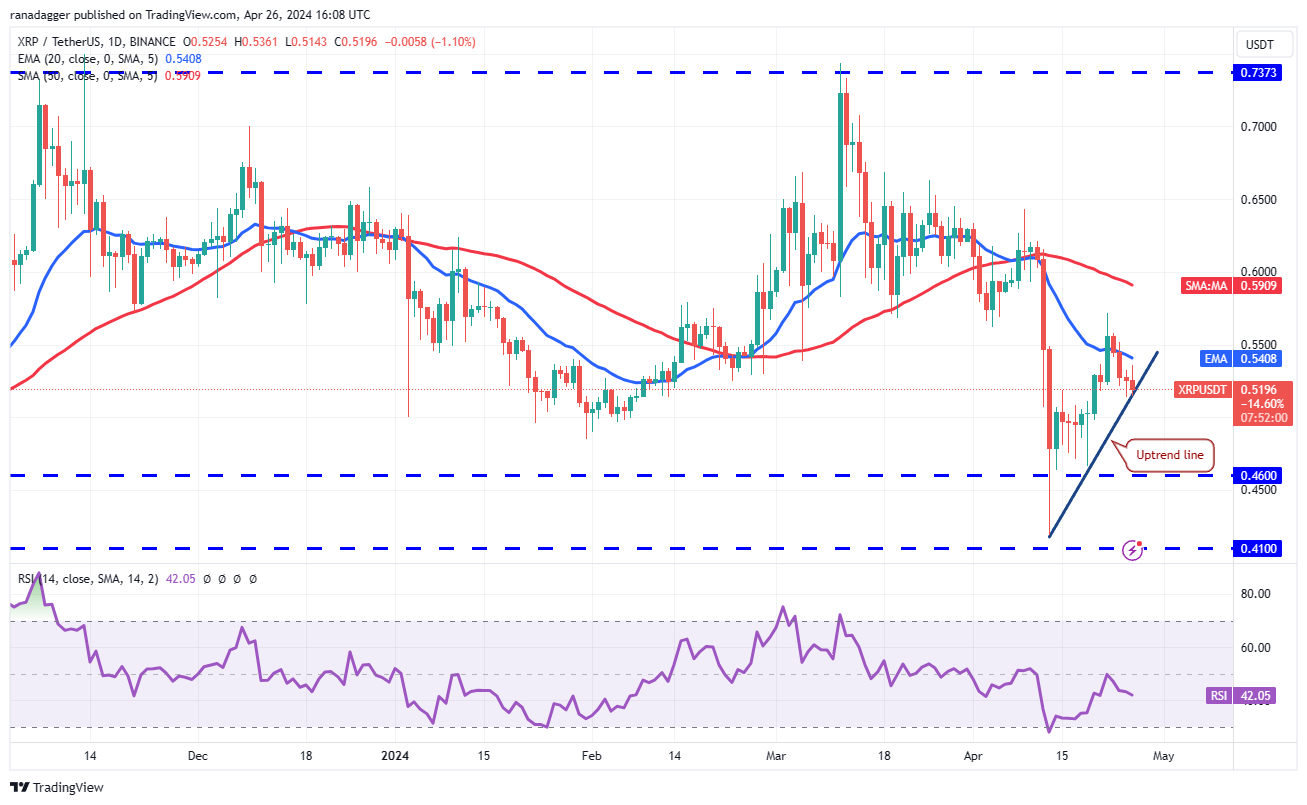
XRP (XRP) is trading below the 20-day EMA (0.54) but the bulls are trying to find support at the uptrend line.
XRP (XRP) cotiza por debajo de la EMA de 20 días (0,54), pero los alcistas están tratando de encontrar soporte en la línea de tendencia alcista.
XRP/USDT daily chart. Source: TradingView
Gráfico diario XRP/USDT. Fuente: TradingView
If the price bounces off the uptrend line and breaks above the 20-day EMA, it will suggest that the bears are losing their grip. The XRP/USDT pair could then attempt a rally to the 50-day SMA ($0.59) and subsequently to $0.69.
Si el precio rebota en la línea de tendencia alcista y supera la EMA de 20 días, sugerirá que los bajistas están perdiendo el control. El par XRP/USDT podría intentar subir hasta la SMA de 50 días (0,59 dólares) y posteriormente hasta 0,69 dólares.
Contrary to this assumption, if the price continues lower and breaks below the uptrend line, it will suggest that the bears are in control. The pair may plunge to $0.46, where the bulls are expected to provide strong support.
Contrariamente a esta suposición, si el precio continúa bajando y rompe por debajo de la línea de tendencia alcista, sugerirá que los bajistas tienen el control. El par puede caer a 0,46 dólares, donde se espera que los alcistas brinden un fuerte soporte.
Dogecoin price analysis
Análisis de precios de Dogecoin
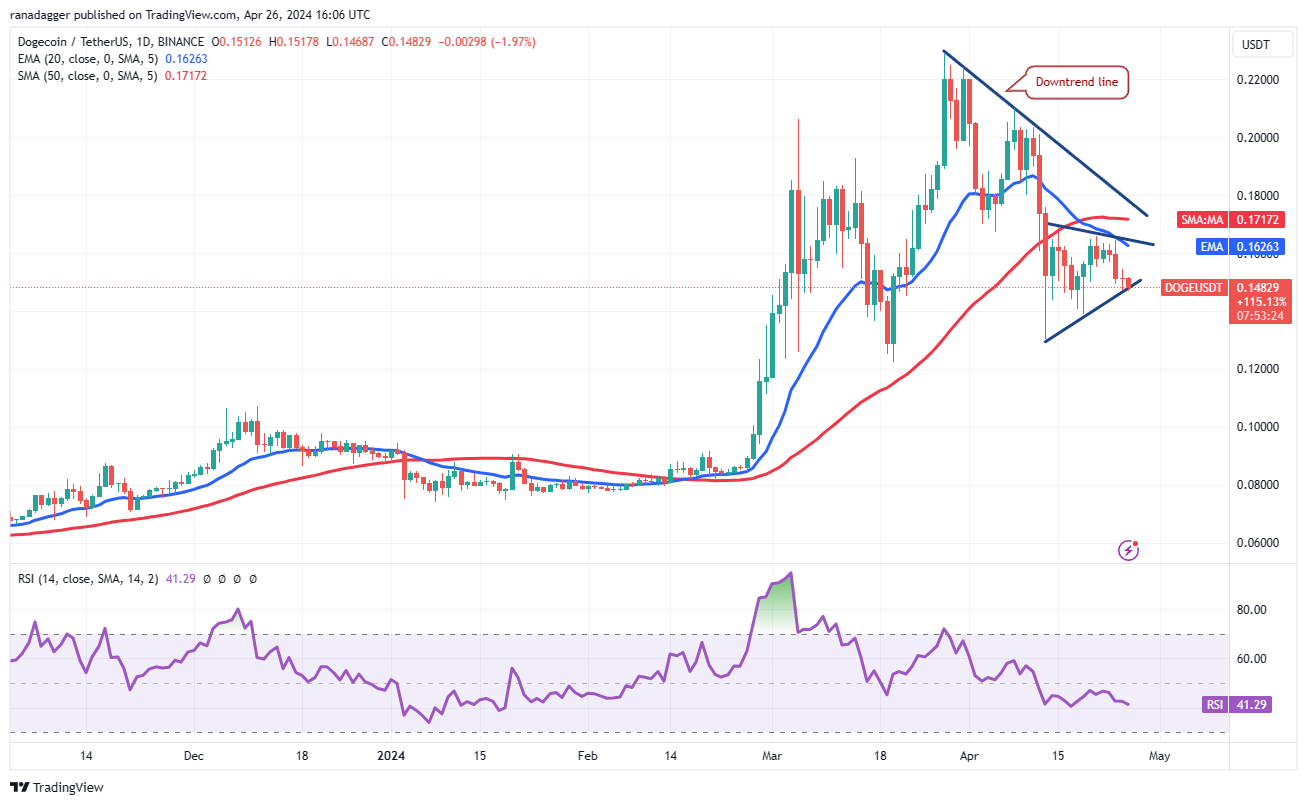
Dogecoin (DOGE) has formed a symmetrical triangle pattern, indicating indecision between the bulls and the bears.
Dogecoin (DOGE) ha formado un patrón de triángulo simétrico, lo que indica indecisión entre alcistas y bajistas.
DOGE/USDT daily chart. Source: TradingView
Gráfico diario DOGE/USDT. Fuente: TradingView
The downsloping 20-day EMA ($0.16) and the RSI in the negative zone suggest that the path of least resistance is to the downside. If the price skids and maintains below the triangle, the DOGE/USDT pair may tumble to $0.12.
La EMA de 20 días descendente (USD 0,16) y el RSI en la zona negativa sugieren que el camino de menor resistencia es a la baja. Si el precio se desliza y se mantiene por debajo del triángulo, el par DOGE/USDT puede caer a USD 0,12.
On the contrary, if the price turns up from the current level and breaks above the triangle, it will signal aggressive buying on dips. That improves the prospects of a break above the downtrend line. The pair may then climb to $0.21.
Por el contrario, si el precio sube desde el nivel actual y supera el triángulo, indicará una compra agresiva en las caídas. Eso mejora las perspectivas de una ruptura por encima de la línea de tendencia bajista. El par podría entonces subir a 0,21 dólares.
Toncoin price analysis
Análisis de precios de Toncoin
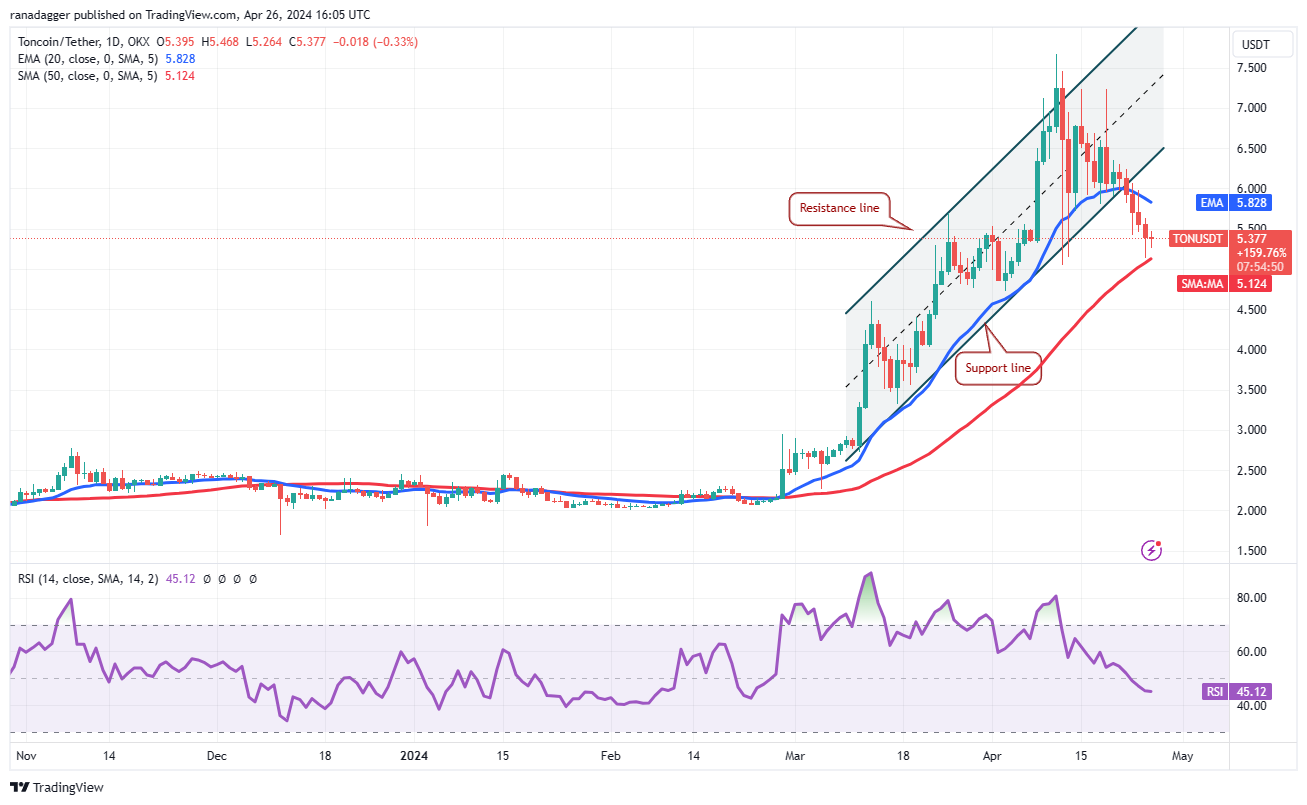
Toncoin (TON) broke below the ascending channel pattern on April 22 and reached the 50-day SMA ($5.12) on April 25.
Toncoin (TON) rompió por debajo del patrón del canal ascendente el 22 de abril y alcanzó la SMA de 50 días ($5,12) el 25 de abril.
TON/USDT daily chart. Source: TradingView
Gráfico diario TON/USDT. Fuente: TradingView
The downsloping 20-day EMA ($5.82) and the RSI just below the midpoint suggest that the bears have a slight edge. If the price rebounds off the 50-day SMA, it is likely to face stiff resistance at the 20-day EMA. If the TON/USDT pair turns lower from the 20-day EMA, it will increase the likelihood of a drop below the 50-day SMA. The pair may then drop to $4.50.
La EMA de 20 días descendente (USD 5,82) y el RSI justo debajo del punto medio sugieren que los bajistas tienen una ligera ventaja. Si el precio rebota en la SMA de 50 días, es probable que enfrente una fuerte resistencia en la EMA de 20 días. Si el par TON/USDT baja desde la EMA de 20 días, aumentará la probabilidad de una caída por debajo de la SMA de 50 días. El par puede entonces caer a 4,50 dólares.
This negative view will be invalidated if the bulls push the price back into the channel. Such a move will suggest that the recent breakdown may have been a bear trap.
Esta visión negativa quedará invalidada si los alcistas empujan el precio nuevamente al canal. Tal movimiento sugerirá que la reciente ruptura puede haber sido una trampa para bajistas.
Related: Here’s what happened in crypto today
Relacionado: Esto es lo que sucedió hoy en las criptomonedas
Cardano price analysis
Análisis de precios de Cardano
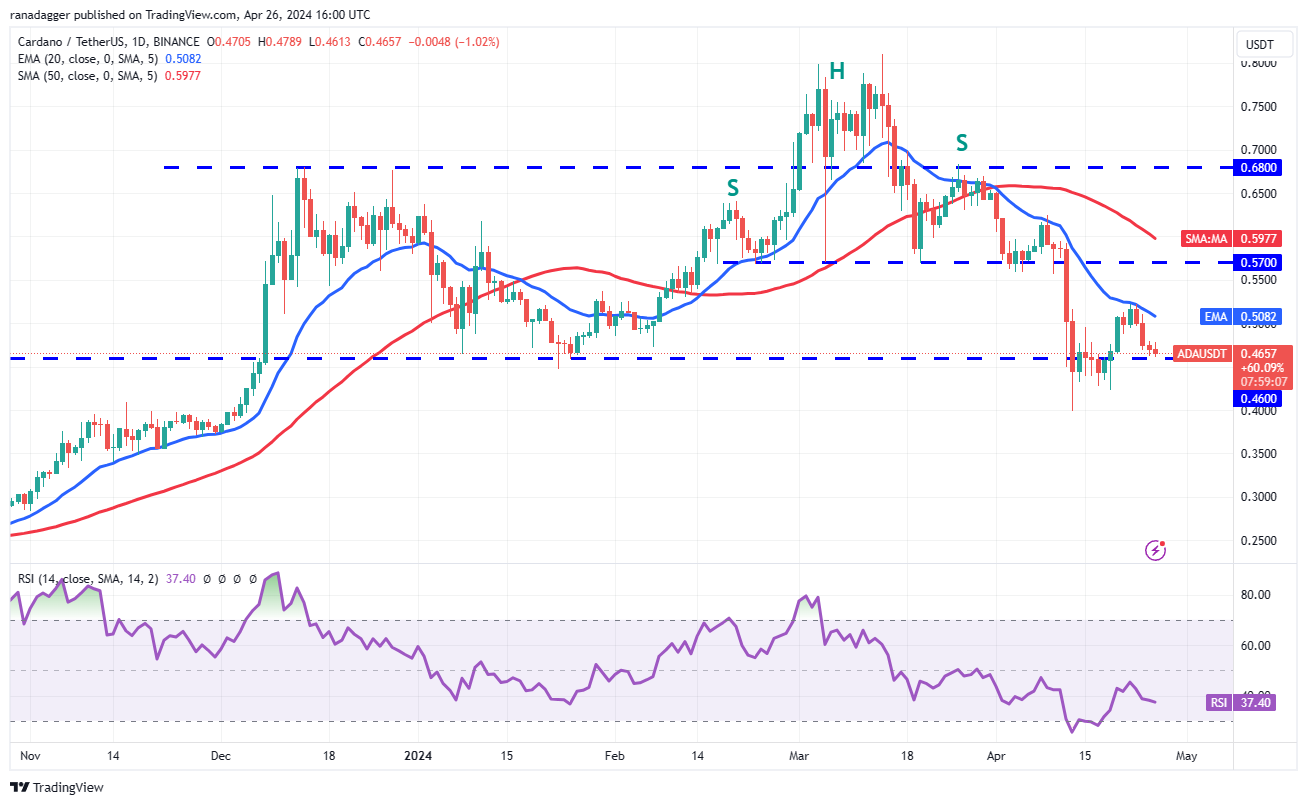
Cardano (ADA) turned lower from the 20-day EMA ($0.50) on April 23 and reached the important support at $0.46.
Cardano (ADA) bajó desde la EMA de 20 días ($0,50) el 23 de abril y alcanzó el importante soporte de $0,46.
ADA/USDT daily chart. Source: TradingView
Gráfico diario ADA/USDT. Fuente: TradingView
If the price rebounds off the $0.46 level and rises above the 20-day EMA, it will suggest that the correction may be over. The ADA/USDT pair could then rally to the 50-day SMA ($0.59) and later to $0.68.
Si el precio rebota en el nivel de 0,46$ y sube por encima de la EMA de 20 días, sugerirá que la corrección puede haber terminado. El par ADA/USDT podría luego subir hasta la SMA de 50 días (USD 0,59) y luego hasta USD 0,68.
Instead, if the price continues lower and breaks below $0.46, it will indicate that the bears remain in charge. The pair could then slump to the crucial support at $0.40. A break below this level may resume the downtrend.
En cambio, si el precio continúa bajando y cae por debajo de $ 0,46, indicará que los bajistas siguen al mando. Luego, el par podría caer hasta el soporte crucial de 0,40 dólares. Una ruptura por debajo de este nivel puede reanudar la tendencia bajista.
Avalanche price analysis
Análisis de precios de avalancha
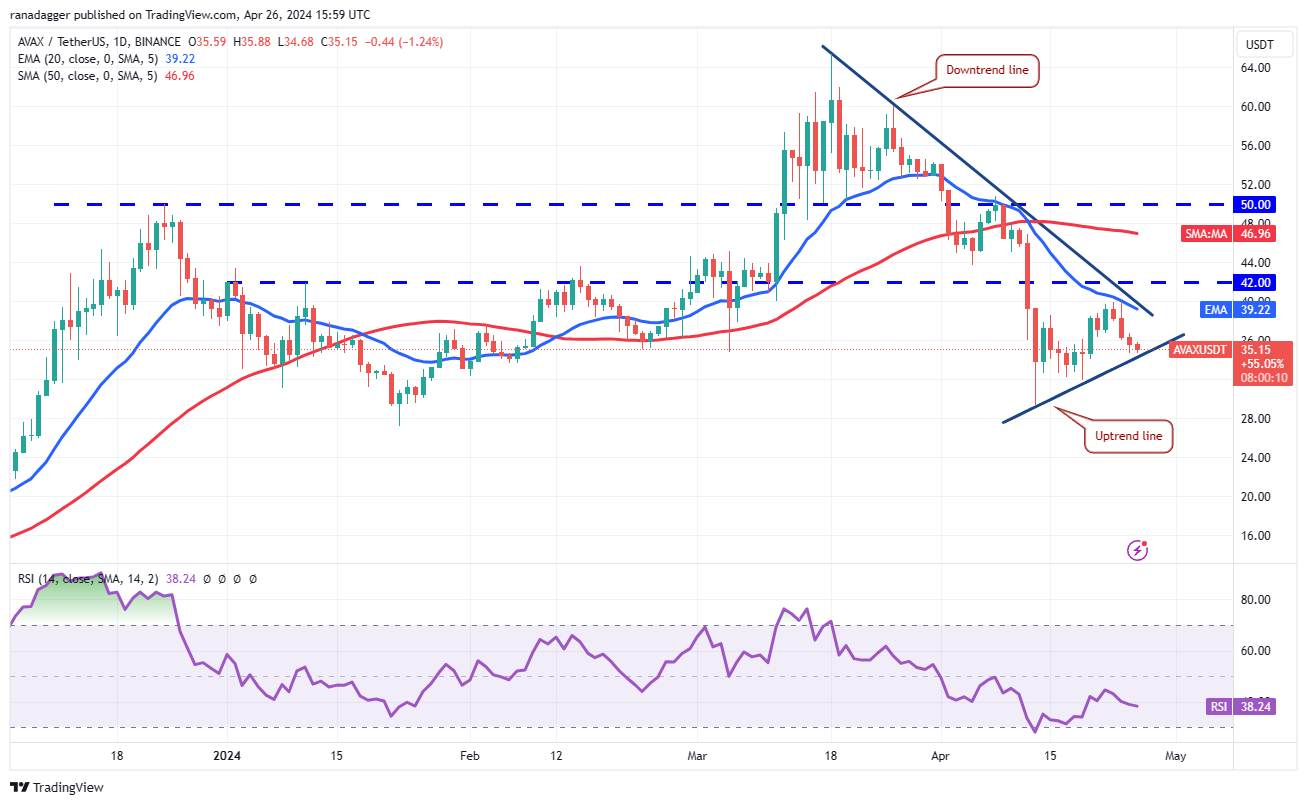
Avalanche (AVAX) turned down from the 20-day EMA ($39) on April 24, but the bears are finding it difficult to pull the price below the uptrend line.
Avalanche (AVAX) rechazó la EMA de 20 días ($ 39) el 24 de abril, pero a los bajistas les resulta difícil bajar el precio por debajo de la línea de tendencia alcista.
AVAX/USDT daily chart. Source: TradingView
Gráfico diario AVAX/USDT. Fuente: TradingView
The bulls will have to push and maintain the price above the downtrend line to signal a potential short-term trend change. The AVAX/USDT pair could then attempt a rally toward the 50-day SMA ($47).
Los alcistas tendrán que empujar y mantener el precio por encima de la línea de tendencia bajista para señalar un posible cambio de tendencia a corto plazo. El par AVAX/USDT podría entonces intentar un repunte hacia la SMA de 50 días ($47).
This optimistic view will be negated in the near term if the price continues lower and breaks below the uptrend line. That could sink the pair to the $32 to $27 support zone, where buyers are likely to step in.
Esta visión optimista se verá anulada en el corto plazo si el precio continúa bajando y rompe por debajo de la línea de tendencia alcista. Eso podría hundir el par a la zona de soporte de $32 a $27, donde es probable que intervengan los compradores.
Shiba Inu price analysis
Análisis de precios de Shiba Inu
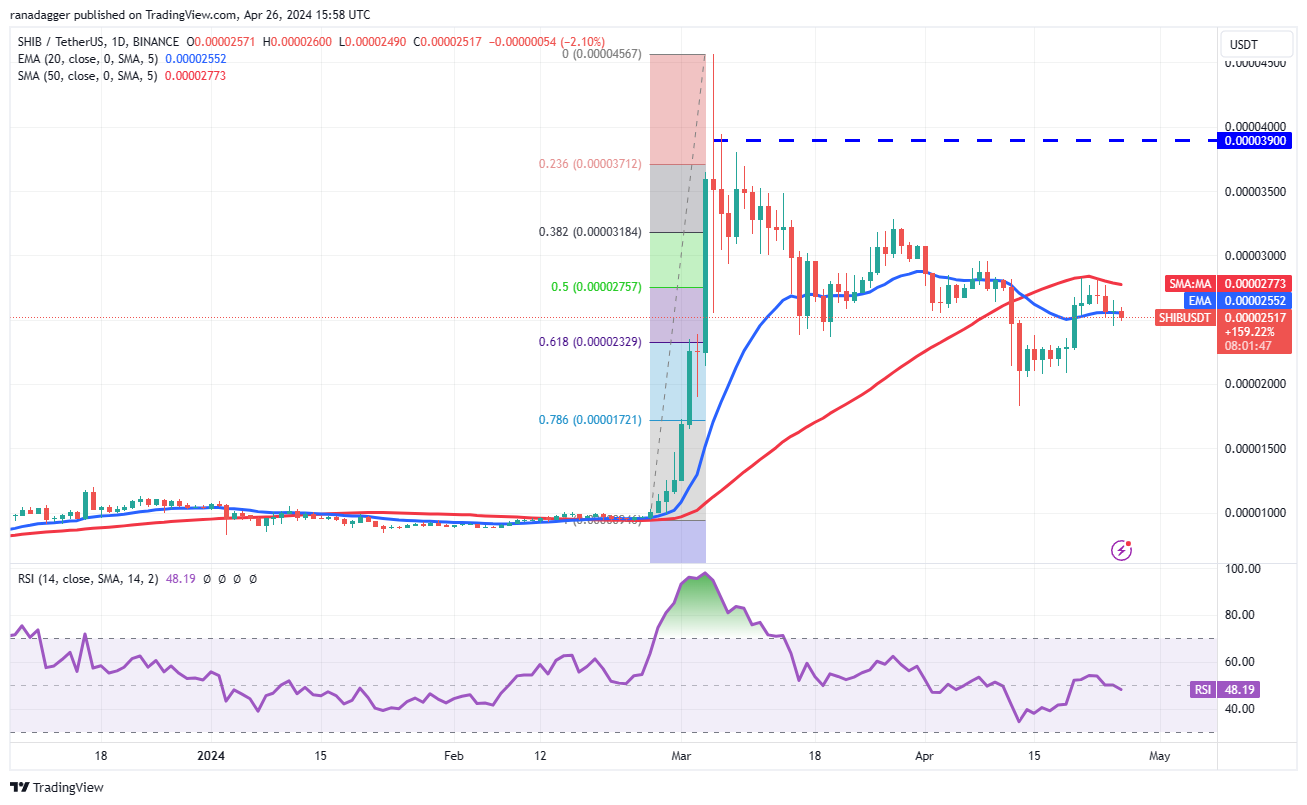
Shiba Inu (SHIB) has been stuck between the moving averages for the past few days, indicating indecision between the bulls and the bears.
Shiba Inu (SHIB) ha estado atrapado entre los promedios móviles durante los últimos días, lo que indica indecisión entre alcistas y bajistas.
SHIB/USDT daily chart. Source: TradingView
Gráfico diario SHIB/USDT. Fuente: TradingView
The flattish 20-day EMA ($0.000025) and the RSI near the midpoint do not give a clear advantage either to the bulls or the bears. If
La EMA plana de 20 días ($0,000025) y el RSI cerca del punto medio no dan una ventaja clara ni a los alcistas ni a los bajistas. Si


 crypto.news
 The Bit Journal
 Crypto Daily™
 DogeHome
 Crypto Daily™
 Crypto Daily™
 crypto.ro English
 Optimisus
 Crypto Daily™


