

Bitcoin (BTC) continues to trade within a large range, suggesting indecision about the next trending move. Analysts trying to predict the direction are enthused by the $1.3 billion of USD Coin (USDC) transferred to Coinbase by whale addresses. Expectations are that the funds will be used to buy Bitcoin and Ether (ETH).
比特币(BTC)继续在大范围内交易,表明对下一个趋势走势犹豫不决。试图预测方向的分析师对鲸鱼地址转移到 Coinbase 的 13 亿美元美元代币 (USDC) 感到兴奋。预计这些资金将用于购买比特币和以太币(ETH)。
Large investors are not only buying the top two coins by market capitalization. CoinShares head of research James Butterfill said in a recent report based on a survey of 64 institutional investors that 15% of the respondents had invested in Solana (SOL). In comparison, none of the investors held Solana in the firm’s January survey.
大投资者不仅购买市值排名前两位的代币。 CoinShares 研究主管 James Butterfill 在最近一份基于对 64 家机构投资者的调查的报告中表示,15% 的受访者投资了 Solana (SOL)。相比之下,在该公司 1 月份的调查中,没有投资者持有 Solana。
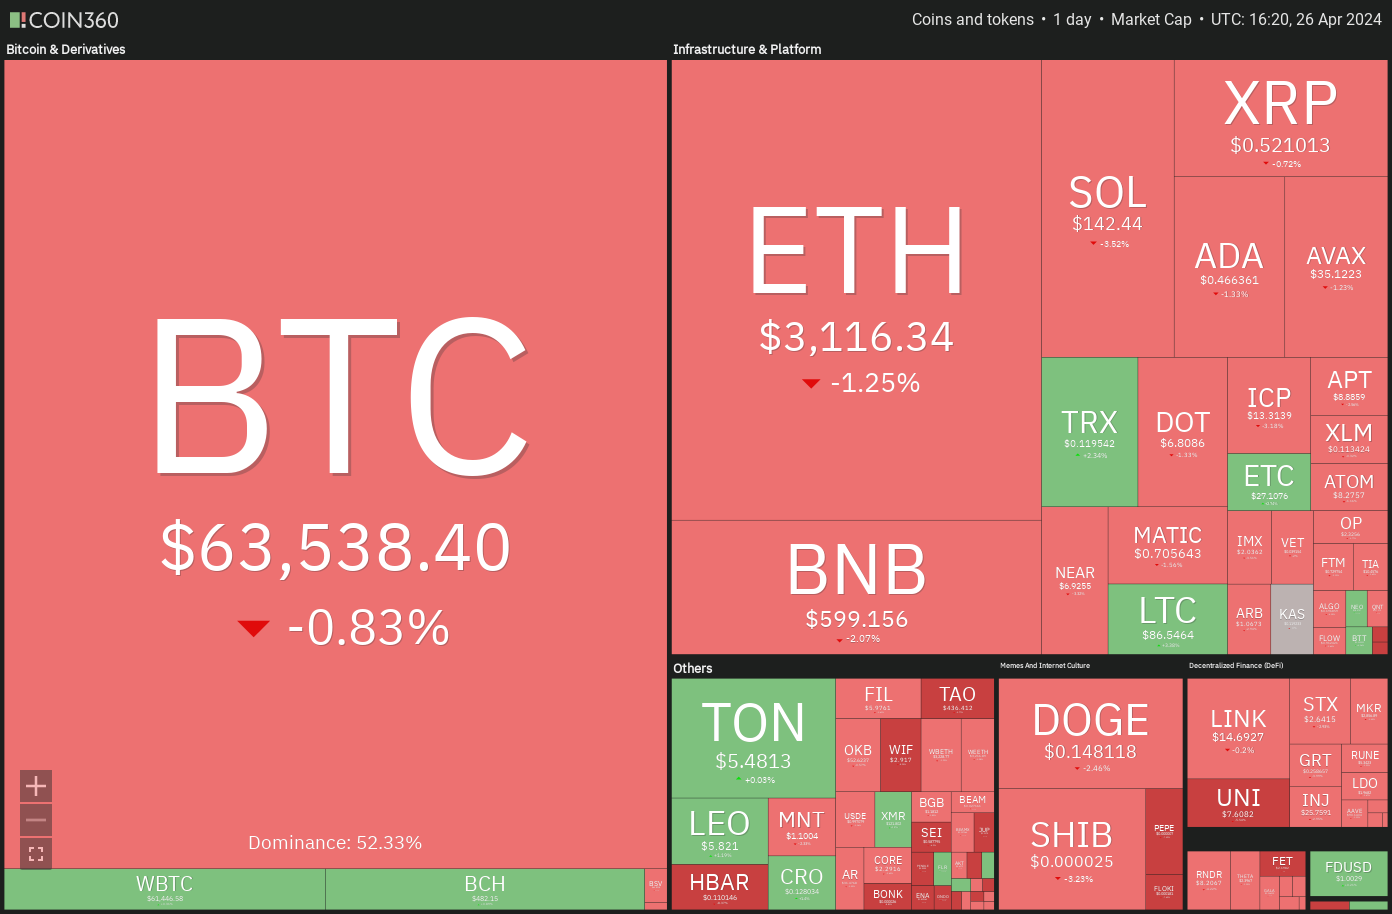
Crypto market data daily view. Source: Coin360
加密货币市场数据每日查看。来源:Coin360
Morgan Creek Capital CEO Mark Yusko said in a recent interview with The Wolf Of All Streets podcast that about $300 billion of baby boomers’ wealth is likely to enter into digital assets within 12 months. This inflow could boost the cryptocurrency market capitalization to $6 trillion.
Morgan Creek Capital 首席执行官 Mark Yusko 最近在接受 The Wolf Of All Streets 播客采访时表示,婴儿潮一代的约 3000 亿美元财富可能会在 12 个月内进入数字资产。这一资金流入可能会将加密货币市值提升至 6 万亿美元。
Can buyers thwart attempts by the bears to deepen the correction in Bitcoin and altcoins? Let’s analyze the charts of the top 10 cryptocurrencies to find out.
买家能否阻止空头加深比特币和山寨币调整的尝试?让我们分析一下前 10 名加密货币的图表来找出答案。
Bitcoin price analysis
比特币价格分析
Bitcoin has been trading below the moving averages for the past few days, but the bears are struggling to sink the price to the crucial support at $60,775. This suggests that selling dries up at lower levels.
过去几天,比特币的交易价格一直低于移动平均线,但空头正在努力将价格降至 60,775 美元的关键支撑位。这表明抛售在较低水平上枯竭。
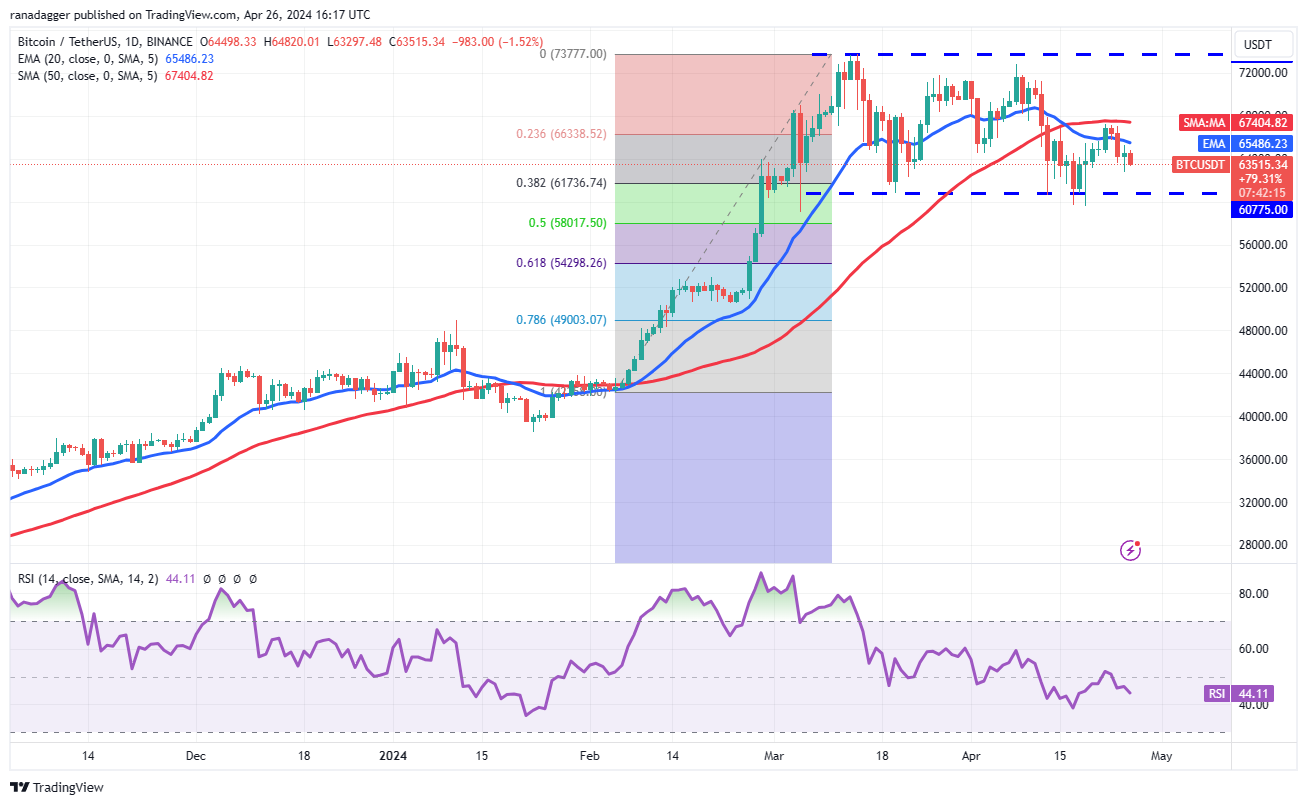
BTC/USDT daily chart. Source: TradingView
BTC/USDT 日线图。来源:TradingView
The price is stuck between the 50-day simple moving average ($67,404) and the vital support at $60,775. The 20-day exponential moving average ($65,542) has started to turn down and the relative strength index (RSI) is just below the midpoint, indicating a minor advantage to the bears.
价格徘徊在 50 日简单移动平均线(67,404 美元)和重要支撑位 60,775 美元之间。 20 天指数移动平均线(65,542 美元)已开始下跌,相对强弱指数 (RSI) 略低于中点,表明空头略有优势。
A break and close below $59,600 could open the doors for a drop to the 61.8% Fibonacci retracement level of $54,298.
突破并收于 59,600 美元下方可能会为跌至 61.8% 斐波那契回撤位 54,298 美元打开大门。
This bearish view will be negated in the near term if the price rises above the 50-day SMA. The BTC/USDT pair may then climb to $73,777. This remains the key overhead resistance for the bulls to overcome.
如果价格升破 50 日移动平均线,这种看跌观点将在短期内被否定。 BTC/USDT 货币对可能会攀升至 73,777 美元。这仍然是多头需要克服的关键上方阻力。
Ether price analysis
以太币价格分析
Ether has been oscillating between the 20-day EMA ($3,209) and the horizontal support of $3,056 for the past few days.
过去几天,以太币一直在 20 日均线(3,209 美元)和水平支撑位 3,056 美元之间波动。
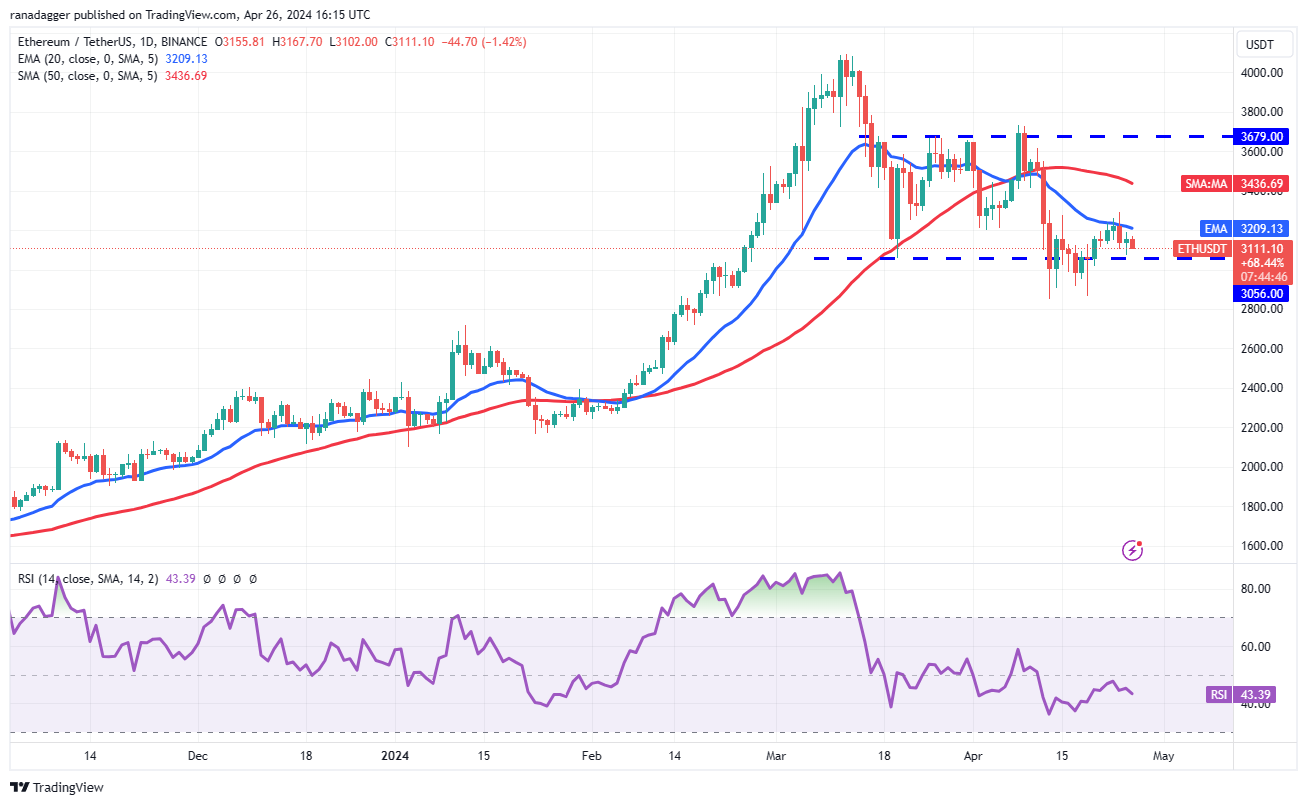
ETH/USDT daily chart. Source: TradingView
ETH/USDT 日线图。来源:TradingView
This tight range trading is unlikely to continue for long. If the price pierces the 20-day EMA, the ETH/USDT pair could rise to the 50-day SMA ($3,436). This level may act as a short-term barrier, but it is likely to be crossed. The pair may then jump to $3,679.
这种窄幅波动的交易不太可能持续很长时间。如果价格突破 20 日均线,ETH/USDT 货币对可能会上涨至 50 日均线(3,436 美元)。该水平可能会成为短期障碍,但很可能会被突破。随后该货币对可能会跃升至 3,679 美元。
Conversely, if the price turns down and breaks below $3,056, it will suggest that the bears are in command. The pair may then retest the critical support at $2,852. A Break below this level may result in a decline to $2,700.
相反,如果价格下跌并跌破 3,056 美元,则表明空头占据主导地位。随后,该货币对可能会重新测试 2,852 美元的关键支撑位。跌破该水平可能会导致跌至 2,700 美元。
BNB price analysis
BNB价格分析
BNB (BNB) has been struggling to reach the overhead resistance of $635, suggesting that the bears are defending the level with vigor.
BNB (BNB) 一直在努力触及 635 美元的上方阻力位,这表明空头正在大力捍卫该水平。
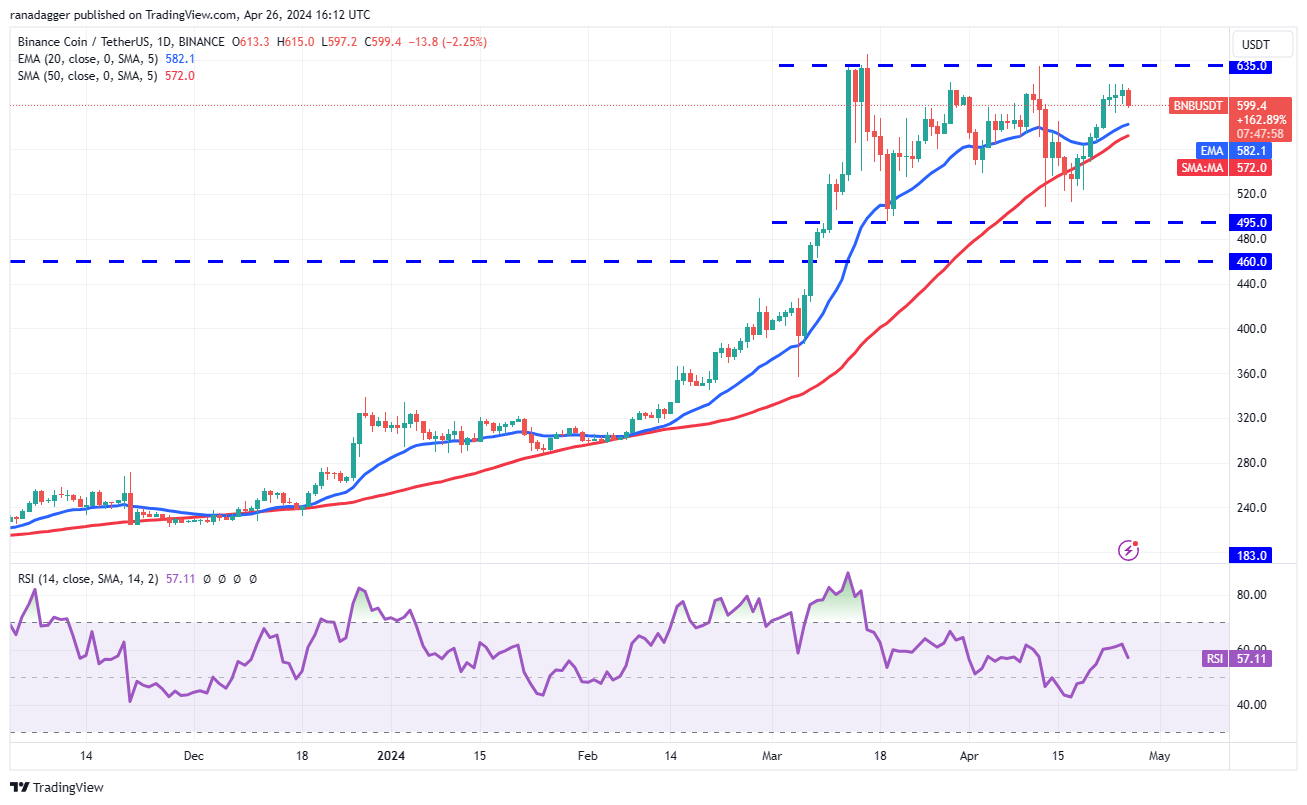
BNB/USDT daily chart. Source: TradingView
BNB/USDT 日线图。来源:TradingView
However, a positive sign is that the bulls have not rushed to the exit. The price may pull back to the moving averages, where it is likely to find support. If the price rebounds off the moving averages with strength, it will enhance the possibility of a break above $635. If that happens, the BNB/USDT pair could surge to $692 and eventually to the pattern target of $775.
不过,一个积极的迹象是多头并没有急于退出。价格可能会回落至移动平均线,并可能在此找到支撑。如果价格从均线强势反弹,将增强突破 635 美元的可能性。如果发生这种情况,BNB/USDT 货币对可能会飙升至 692 美元,并最终达到 775 美元的目标位。
On the other hand, if the price slides below the moving averages, it will indicate that the range-bound action may extend for a few more days.
另一方面,如果价格跌破移动平均线,则表明区间波动可能会持续几天。
Solana price analysis
Solana 价格分析
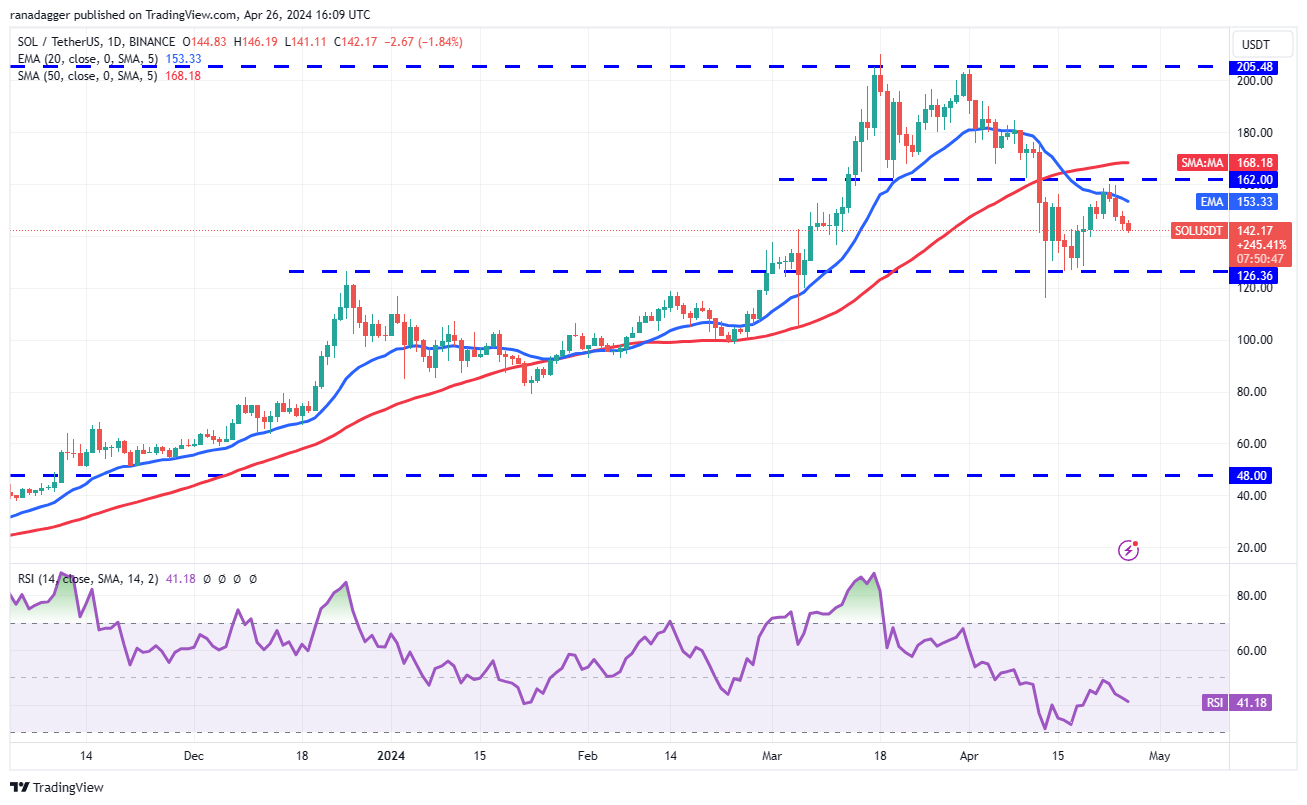
Solana (SOL) turned down from the overhead resistance of $162 on April 24, indicating that the bears are active at higher levels.
Solana (SOL) 从 4 月 24 日的上方阻力位 162 美元回落,表明空头在更高水平上活跃。
SOL/USDT daily chart. Source: TradingView
SOL/USDT 日线图。来源:TradingView
The 20-day EMA ($153) is sloping down gradually, and the RSI is in the negative zone, indicating that the bears have the edge. The SOL/USDT pair could descend to the solid support at $126. If the price rebounds off this level with strength, it will indicate that the pair may remain sandwiched between $126 and $162 for a while longer.
20 日均线(153 美元)逐渐下降,RSI 处于负值区域,表明空头占据优势。 SOL/USDT 货币对可能会跌至 126 美元的坚实支撑位。如果价格从该水平强力反弹,则表明该货币对可能会在一段时间内保持在 126 美元至 162 美元之间。
The first sign of strength will be a break and close above the 50-day SMA ($168). That will open the doors for a possible rally to $205. Contrarily, a break below $126 could sink the pair to $100.
强势的第一个迹象将是突破并收于 50 日移动平均线(168 美元)之上。这将为可能上涨至 205 美元打开大门。相反,跌破 126 美元可能会使该货币对跌至 100 美元。
XRP price analysis
瑞波币价格分析
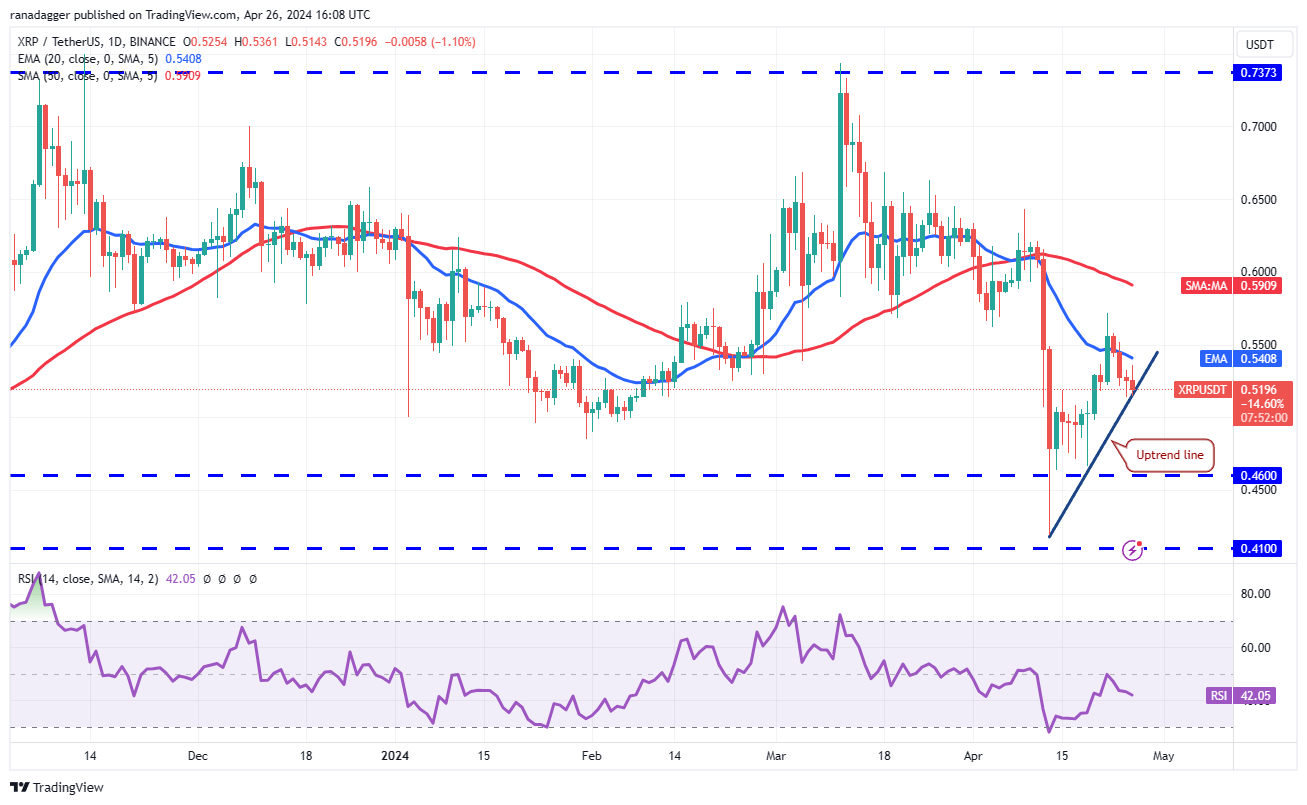
XRP (XRP) is trading below the 20-day EMA (0.54) but the bulls are trying to find support at the uptrend line.
XRP (XRP) 的交易价格低于 20 日均线 (0.54),但多头正试图在上升趋势线寻找支撑。
XRP/USDT daily chart. Source: TradingView
XRP/USDT 日线图。来源:TradingView
If the price bounces off the uptrend line and breaks above the 20-day EMA, it will suggest that the bears are losing their grip. The XRP/USDT pair could then attempt a rally to the 50-day SMA ($0.59) and subsequently to $0.69.
如果价格从上升趋势线反弹并突破 20 日均线,则表明空头正在失去控制。随后,XRP/USDT 货币对可能会尝试反弹至 50 日移动平均线(0.59 美元),随后升至 0.69 美元。
Contrary to this assumption, if the price continues lower and breaks below the uptrend line, it will suggest that the bears are in control. The pair may plunge to $0.46, where the bulls are expected to provide strong support.
与这一假设相反,如果价格继续走低并跌破上升趋势线,则表明空头处于控制之中。该货币对可能会跌至 0.46 美元,预计多头将在此提供强劲支撑。
Dogecoin price analysis
狗狗币价格分析
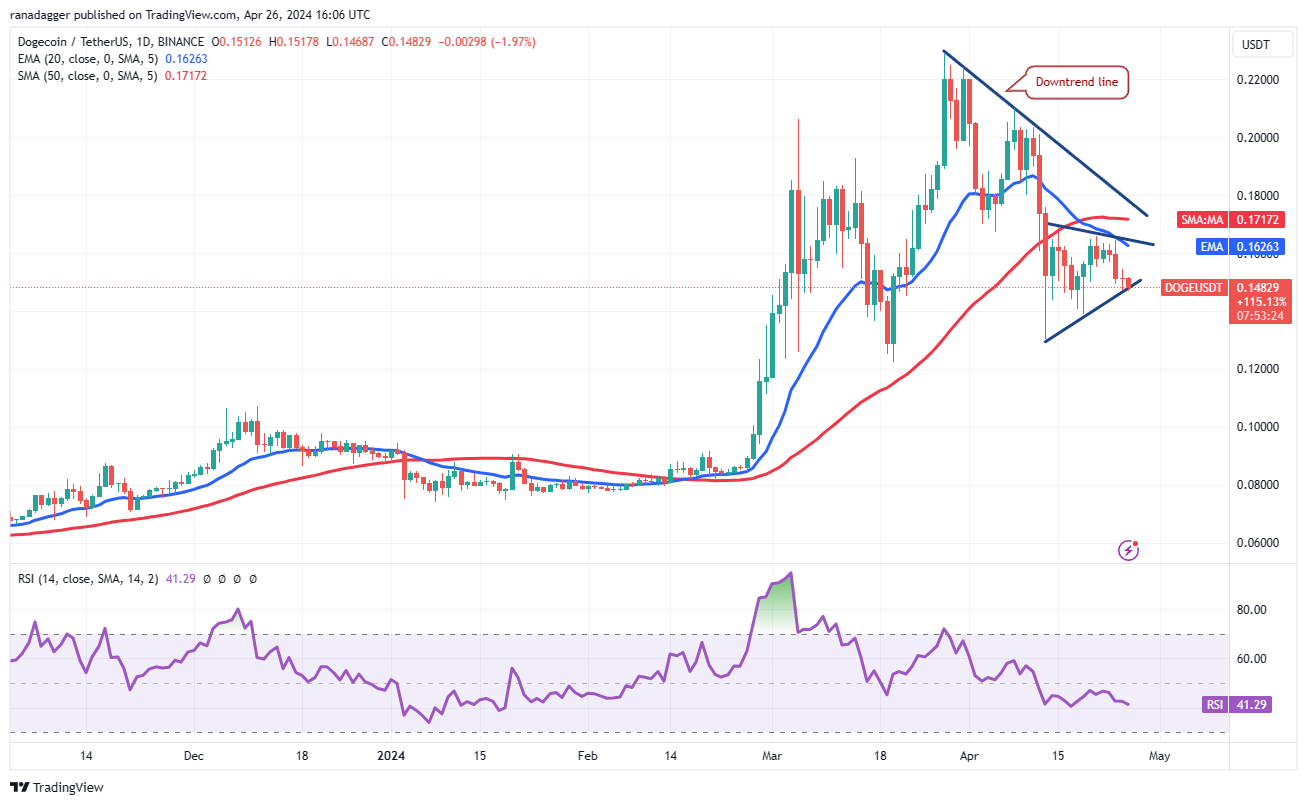
Dogecoin (DOGE) has formed a symmetrical triangle pattern, indicating indecision between the bulls and the bears.
狗狗币(DOGE)已形成对称三角形图案,表明多头和空头之间犹豫不决。
DOGE/USDT daily chart. Source: TradingView
DOGE/USDT 日线图。来源:TradingView
The downsloping 20-day EMA ($0.16) and the RSI in the negative zone suggest that the path of least resistance is to the downside. If the price skids and maintains below the triangle, the DOGE/USDT pair may tumble to $0.12.
向下倾斜的 20 日均线(0.16 美元)和 RSI 处于负值区域表明阻力最小的路径是下行。如果价格下滑并维持在三角形下方,DOGE/USDT 货币对可能会跌至 0.12 美元。
On the contrary, if the price turns up from the current level and breaks above the triangle, it will signal aggressive buying on dips. That improves the prospects of a break above the downtrend line. The pair may then climb to $0.21.
相反,如果价格从当前水平上涨并突破三角形,则将发出逢低买入的信号。这改善了突破下降趋势线的前景。随后该货币对可能会攀升至 0.21 美元。
Toncoin price analysis
通币价格分析
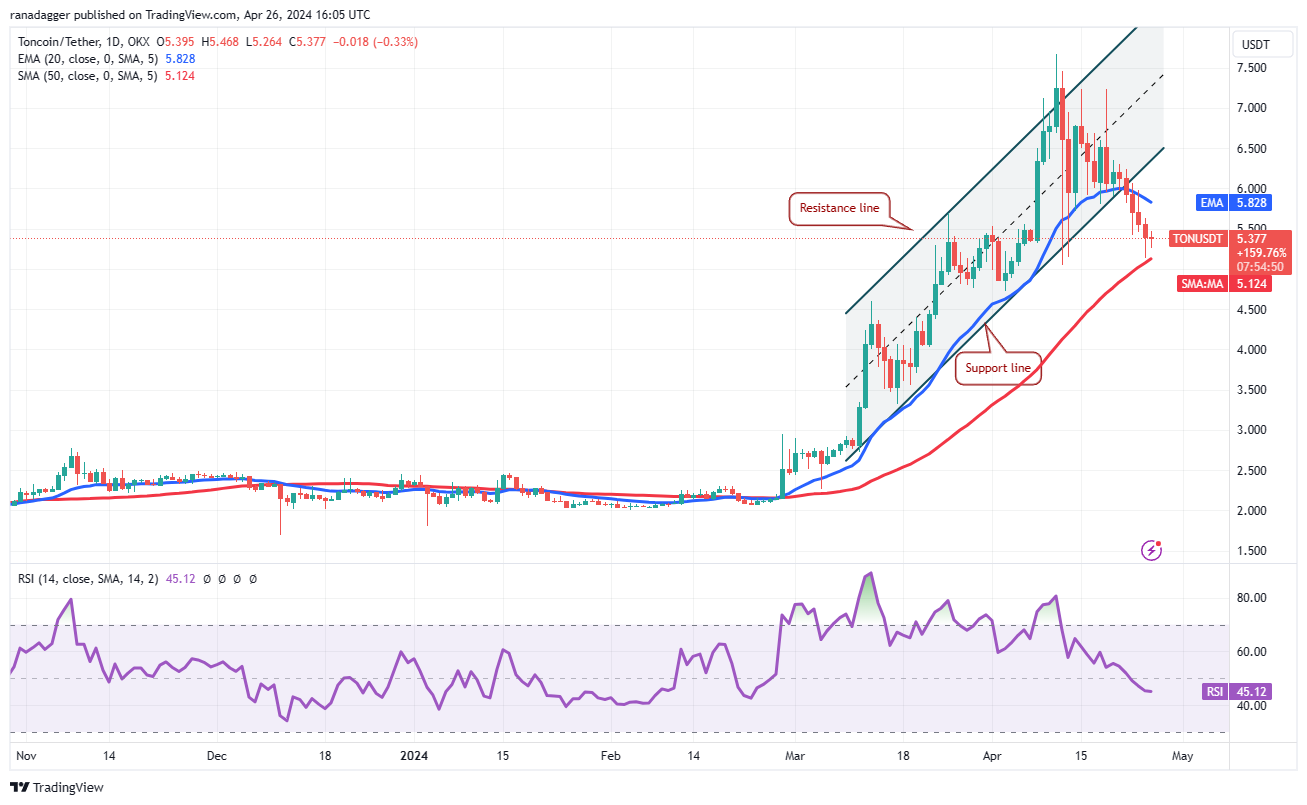
Toncoin (TON) broke below the ascending channel pattern on April 22 and reached the 50-day SMA ($5.12) on April 25.
Toncoin (TON) 于 4 月 22 日跌破上升通道模式,并于 4 月 25 日触及 50 日移动平均线(5.12 美元)。
TON/USDT daily chart. Source: TradingView
TON/USDT 日线图。来源:TradingView
The downsloping 20-day EMA ($5.82) and the RSI just below the midpoint suggest that the bears have a slight edge. If the price rebounds off the 50-day SMA, it is likely to face stiff resistance at the 20-day EMA. If the TON/USDT pair turns lower from the 20-day EMA, it will increase the likelihood of a drop below the 50-day SMA. The pair may then drop to $4.50.
向下倾斜的 20 日均线(5.82 美元)和略低于中点的 RSI 表明空头有轻微优势。如果价格从 50 日均线反弹,则可能会在 20 日均线处面临强劲阻力。如果 TON/USDT 货币对从 20 日均线转向走低,则跌破 50 日均线的可能性将增加。随后该货币对可能会跌至 4.50 美元。
This negative view will be invalidated if the bulls push the price back into the channel. Such a move will suggest that the recent breakdown may have been a bear trap.
如果多头将价格推回通道,这种负面观点将失效。这样的举动表明,最近的崩溃可能是一个空头陷阱。
Related: Here’s what happened in crypto today
相关:这是今天加密货币领域发生的事情
Cardano price analysis
卡尔达诺价格分析
Cardano (ADA) turned lower from the 20-day EMA ($0.50) on April 23 and reached the important support at $0.46.
卡尔达诺(ADA)于 4 月 23 日从 20 日均线(0.50 美元)下跌,并触及 0.46 美元的重要支撑位。
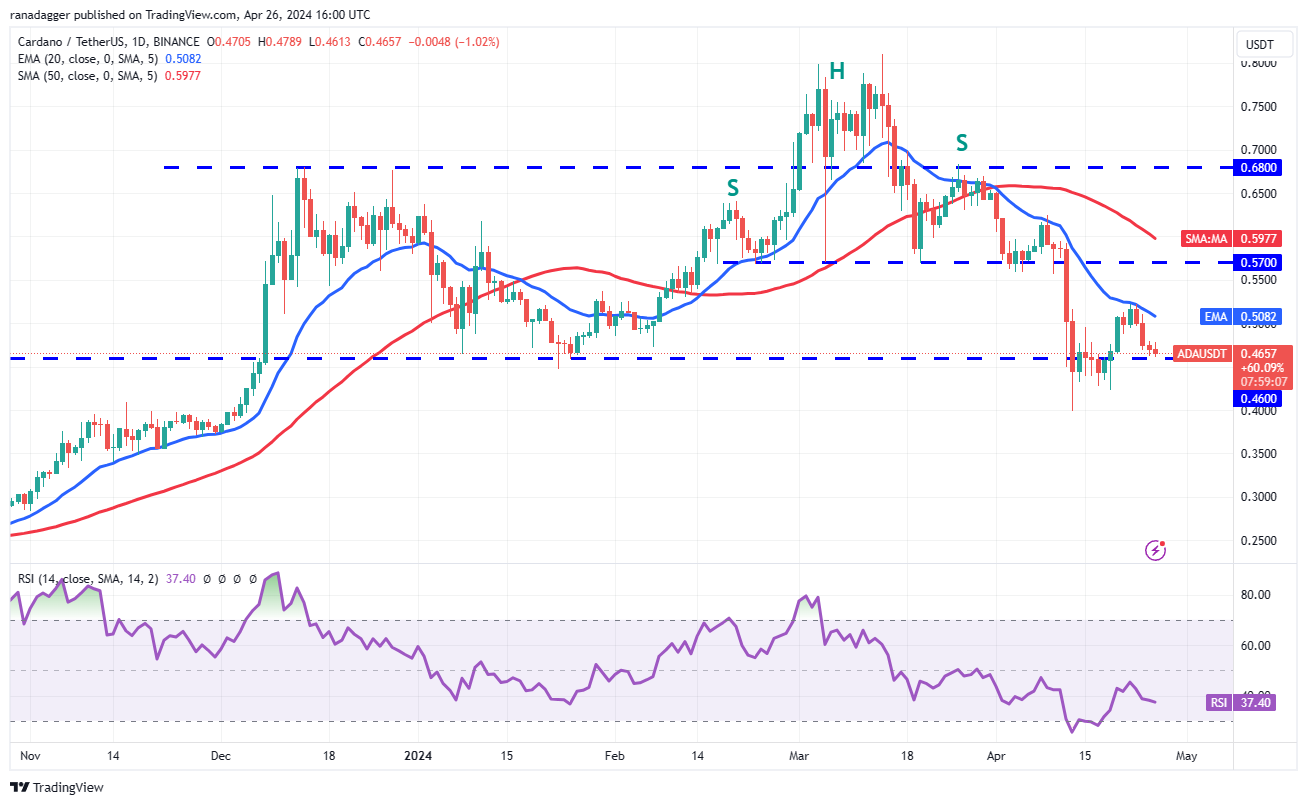
ADA/USDT daily chart. Source: TradingView
ADA/USDT 日线图。来源:TradingView
If the price rebounds off the $0.46 level and rises above the 20-day EMA, it will suggest that the correction may be over. The ADA/USDT pair could then rally to the 50-day SMA ($0.59) and later to $0.68.
如果价格从 0.46 美元水平反弹并升至 20 日均线上方,则表明调整可能结束。然后,ADA/USDT 货币对可能会反弹至 50 日移动平均线(0.59 美元),然后升至 0.68 美元。
Instead, if the price continues lower and breaks below $0.46, it will indicate that the bears remain in charge. The pair could then slump to the crucial support at $0.40. A break below this level may resume the downtrend.
相反,如果价格继续走低并跌破 0.46 美元,则表明空头仍占据主导地位。随后该货币对可能会跌至关键支撑位 0.40 美元。跌破该水平可能会恢复下降趋势。
Avalanche price analysis
雪崩价格分析
Avalanche (AVAX) turned down from the 20-day EMA ($39) on April 24, but the bears are finding it difficult to pull the price below the uptrend line.
Avalanche (AVAX) 从 4 月 24 日的 20 日均线(39 美元)回落,但空头发现很难将价格拉至上升趋势线以下。
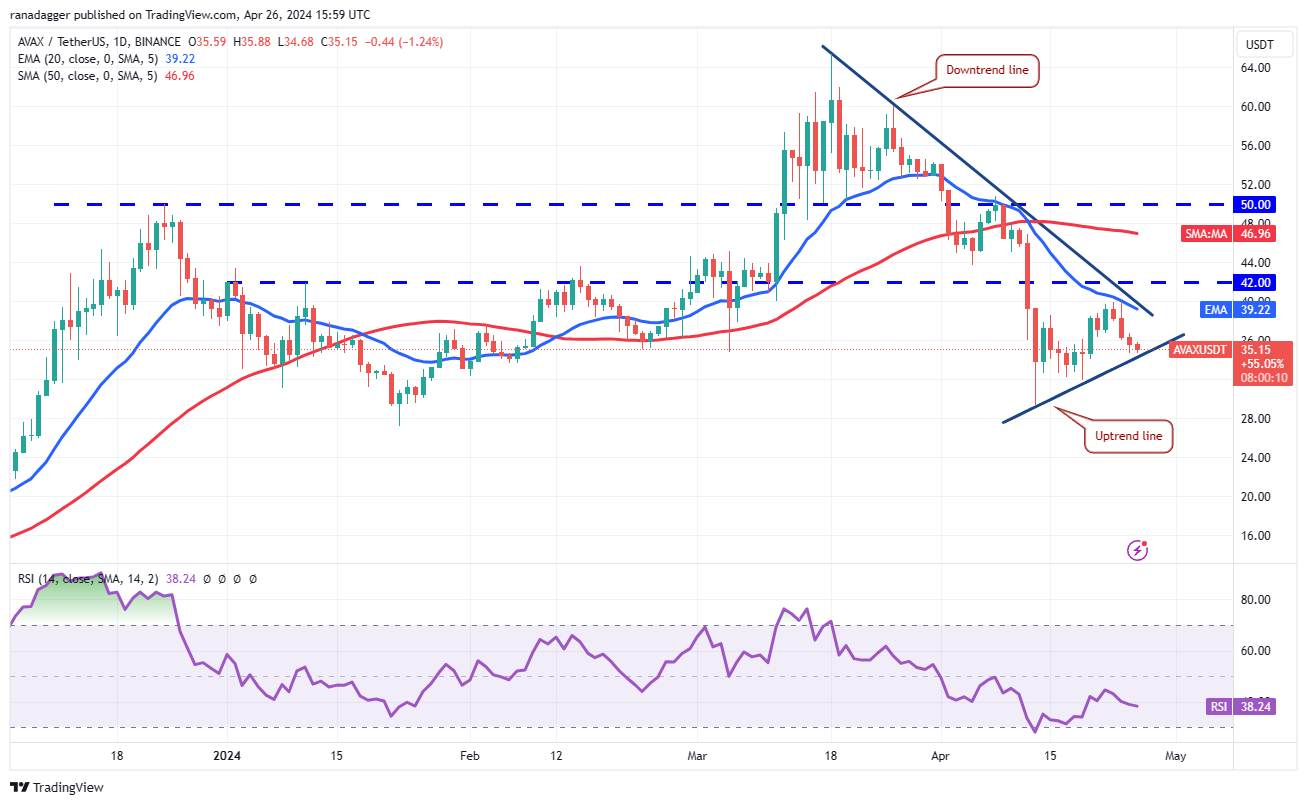
AVAX/USDT daily chart. Source: TradingView
AVAX/USDT 日线图。来源:TradingView
The bulls will have to push and maintain the price above the downtrend line to signal a potential short-term trend change. The AVAX/USDT pair could then attempt a rally toward the 50-day SMA ($47).
多头必须将价格推高并维持在下降趋势线上方,以发出潜在的短期趋势变化的信号。然后,AVAX/USDT 货币对可能会尝试反弹至 50 日移动平均线(47 美元)。
This optimistic view will be negated in the near term if the price continues lower and breaks below the uptrend line. That could sink the pair to the $32 to $27 support zone, where buyers are likely to step in.
如果价格继续走低并跌破上升趋势线,这种乐观观点将在短期内被否定。这可能会使该货币对跌至 32 至 27 美元的支撑区域,买家可能会介入。
Shiba Inu price analysis
柴犬价格分析
Shiba Inu (SHIB) has been stuck between the moving averages for the past few days, indicating indecision between the bulls and the bears.
过去几天,柴犬(SHIB)一直徘徊在移动平均线之间,表明多头和空头之间犹豫不决。
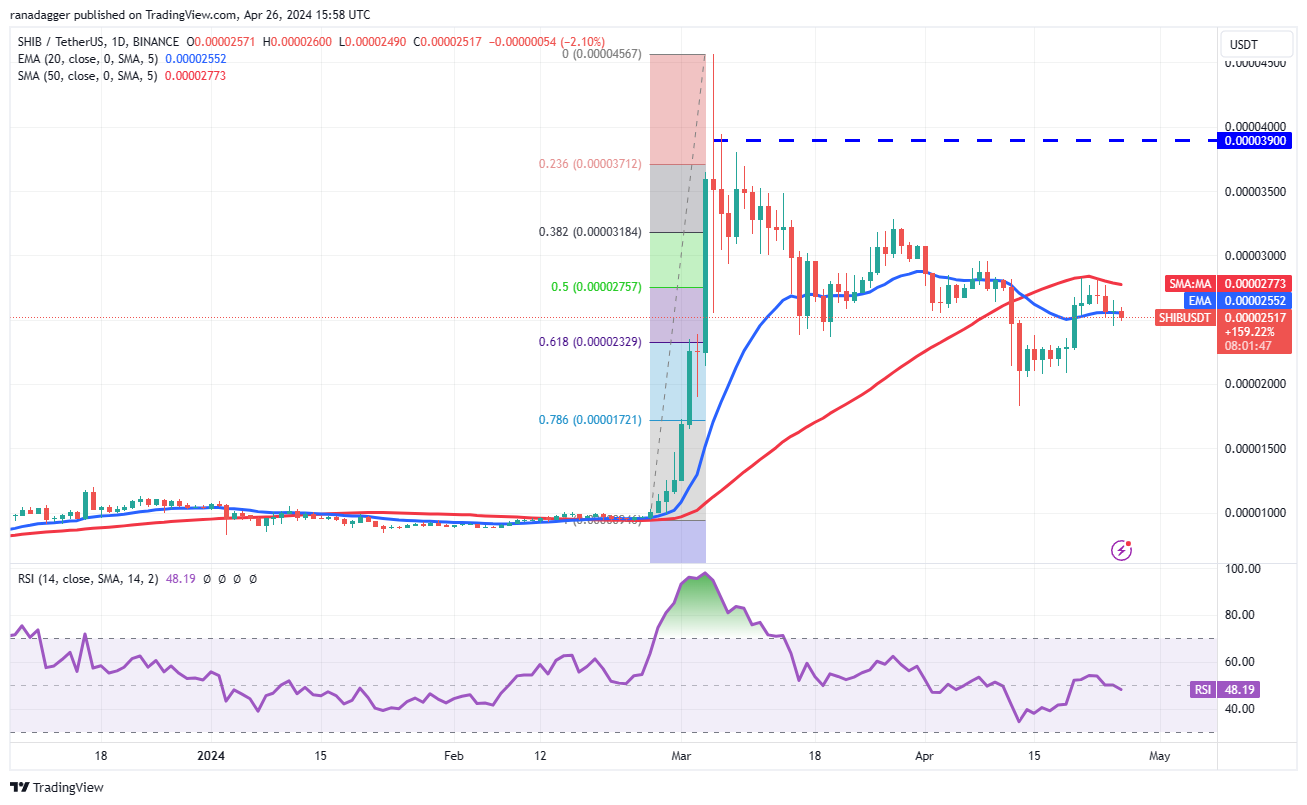
SHIB/USDT daily chart. Source: TradingView
SHIB/USDT 日线图。来源:TradingView
The flattish 20-day EMA ($0.000025) and the RSI near the midpoint do not give a clear advantage either to the bulls or the bears. If
平坦的 20 日均线(0.000025 美元)和中点附近的 RSI 并没有给多头或空头带来明显的优势。如果
 Optimisus
 Crypto Intelligence
 DogeHome
 Coincu
 Times Tabloid
 CFN
CFN Crypto News Land
 Optimisus
 Optimisus


