

Bitcoin (BTC) continues to trade within a large range, suggesting indecision about the next trending move. Analysts trying to predict the direction are enthused by the $1.3 billion of USD Coin (USDC) transferred to Coinbase by whale addresses. Expectations are that the funds will be used to buy Bitcoin and Ether (ETH).
비트코인(BTC)은 계속해서 큰 범위 내에서 거래되고 있어 다음 추세 움직임에 대한 우유부단함을 시사합니다. 방향을 예측하려는 분석가들은 고래 주소를 통해 Coinbase로 전송된 13억 달러 규모의 USD 코인(USDC)에 열광하고 있습니다. 이 자금은 비트코인과 이더리움(ETH)을 구매하는 데 사용될 것으로 예상됩니다.
Large investors are not only buying the top two coins by market capitalization. CoinShares head of research James Butterfill said in a recent report based on a survey of 64 institutional investors that 15% of the respondents had invested in Solana (SOL). In comparison, none of the investors held Solana in the firm’s January survey.
대규모 투자자들은 시가총액 기준으로 상위 2개 코인만 구매하는 것이 아닙니다. CoinShares의 제임스 버터필(James Butterfill) 연구 책임자는 64명의 기관 투자자를 대상으로 한 설문조사를 바탕으로 한 최근 보고서에서 응답자의 15%가 솔라나(SOL)에 투자했다고 밝혔습니다. 이에 비해 회사의 1월 설문 조사에서는 투자자 중 솔라나를 보유한 사람이 아무도 없었습니다.
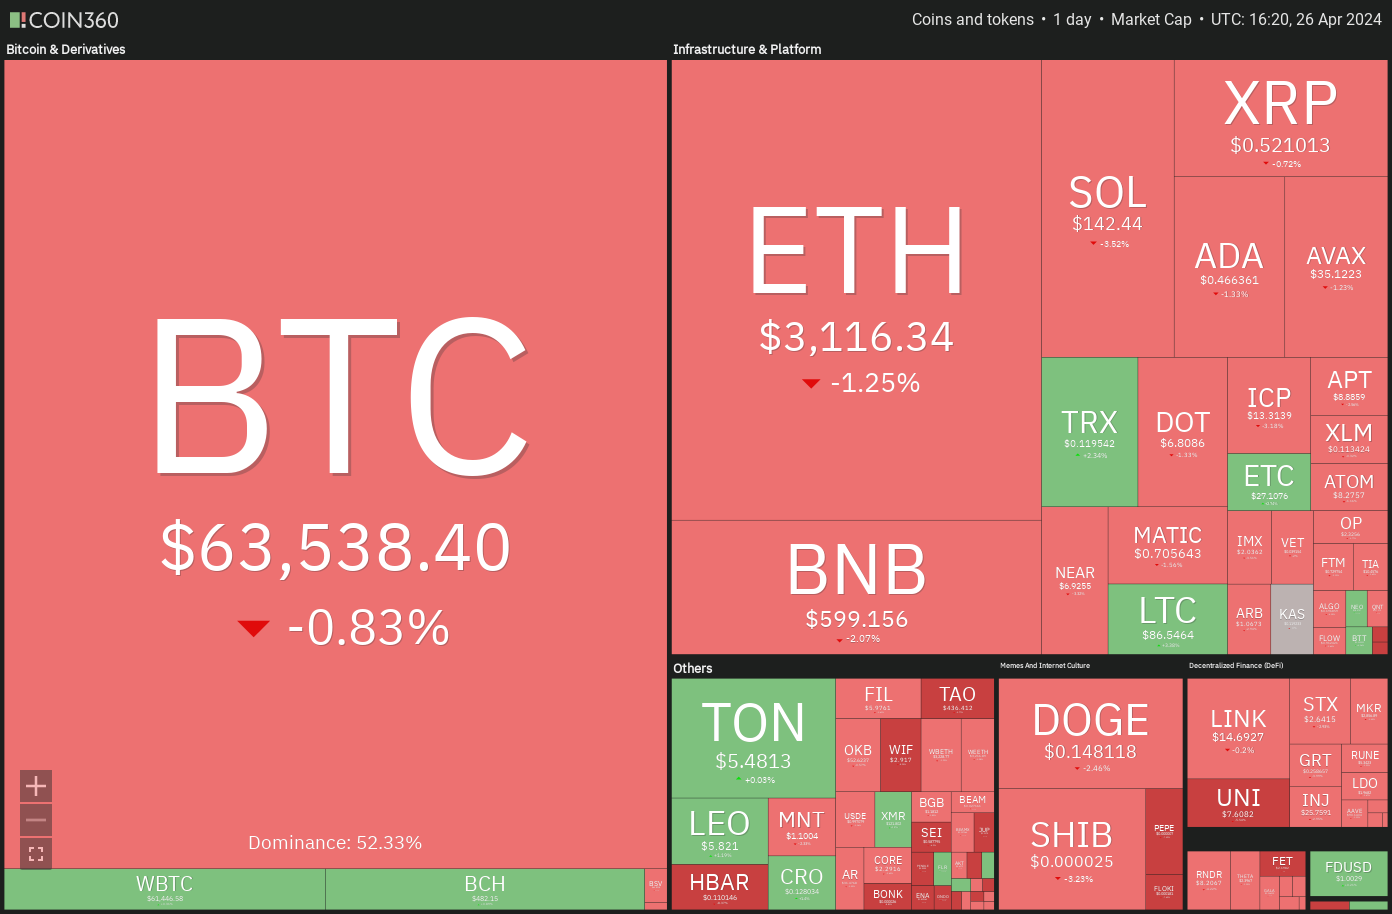
Crypto market data daily view. Source: Coin360
암호화폐 시장 데이터 일일 보기. 출처: 코인360
Morgan Creek Capital CEO Mark Yusko said in a recent interview with The Wolf Of All Streets podcast that about $300 billion of baby boomers’ wealth is likely to enter into digital assets within 12 months. This inflow could boost the cryptocurrency market capitalization to $6 trillion.
Morgan Creek Capital의 CEO인 Mark Yusko는 최근 The Wolf Of All Streets 팟캐스트와의 인터뷰에서 약 3,000억 달러에 달하는 베이비붐 세대의 부가 12개월 이내에 디지털 자산에 유입될 가능성이 있다고 말했습니다. 이러한 유입으로 인해 암호화폐 시가총액은 6조 달러로 늘어날 수 있습니다.
Can buyers thwart attempts by the bears to deepen the correction in Bitcoin and altcoins? Let’s analyze the charts of the top 10 cryptocurrencies to find out.
구매자가 비트코인과 알트코인의 조정을 심화시키려는 하락세의 시도를 막을 수 있습니까? 알아보기 위해 상위 10개 암호화폐 차트를 분석해 보겠습니다.
Bitcoin price analysis
비트코인 가격 분석
Bitcoin has been trading below the moving averages for the past few days, but the bears are struggling to sink the price to the crucial support at $60,775. This suggests that selling dries up at lower levels.
비트코인은 지난 며칠 동안 이동평균선 아래에서 거래되었지만 하락세는 가격을 중요한 지지선인 60,775달러까지 낮추기 위해 고군분투하고 있습니다. 이는 판매가 더 낮은 수준에서 종료됨을 의미합니다.
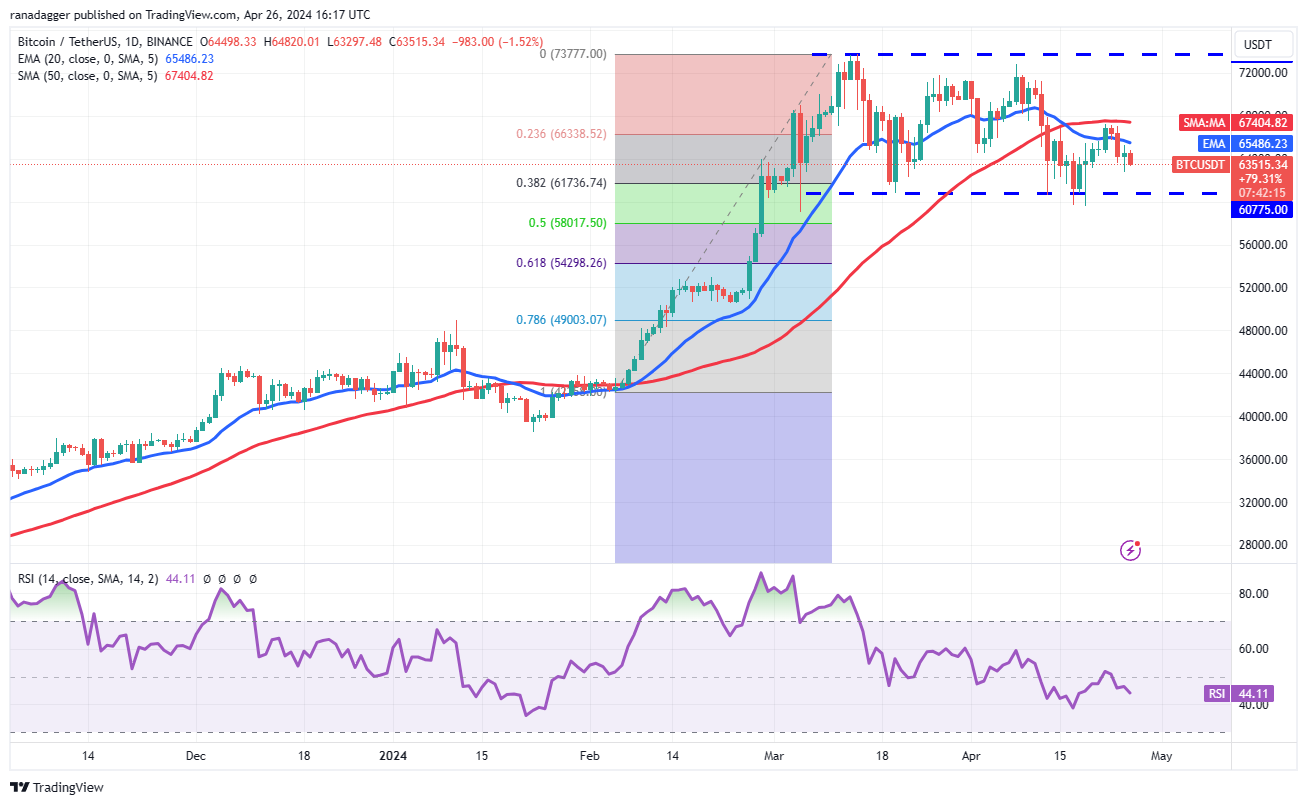
BTC/USDT daily chart. Source: TradingView
BTC/USDT 일일 차트. 출처: TradingView
The price is stuck between the 50-day simple moving average ($67,404) and the vital support at $60,775. The 20-day exponential moving average ($65,542) has started to turn down and the relative strength index (RSI) is just below the midpoint, indicating a minor advantage to the bears.
가격은 50일 단순 이동 평균($67,404)과 필수 지지선인 $60,775 사이에 머물러 있습니다. 20일 지수 이동 평균(65,542달러)이 하락하기 시작했고 상대 강도 지수(RSI)가 중간점 바로 아래에 있어 하락세에 약간의 이점이 있음을 나타냅니다.
A break and close below $59,600 could open the doors for a drop to the 61.8% Fibonacci retracement level of $54,298.
$59,600 이하로 마감하면 61.8% 피보나치 되돌림 수준인 $54,298까지 하락할 수 있는 문이 열릴 수 있습니다.
This bearish view will be negated in the near term if the price rises above the 50-day SMA. The BTC/USDT pair may then climb to $73,777. This remains the key overhead resistance for the bulls to overcome.
가격이 50일 SMA 이상으로 상승하면 이러한 약세 전망은 단기적으로 무효화됩니다. BTC/USDT 쌍은 $73,777까지 올라갈 수 있습니다. 이는 상승세가 극복해야 할 주요 오버헤드 저항으로 남아 있습니다.
Ether price analysis
이더 가격 분석
Ether has been oscillating between the 20-day EMA ($3,209) and the horizontal support of $3,056 for the past few days.
이더리움은 지난 며칠 동안 20일 EMA($3,209)와 수평 지지선인 $3,056 사이를 오가고 있습니다.
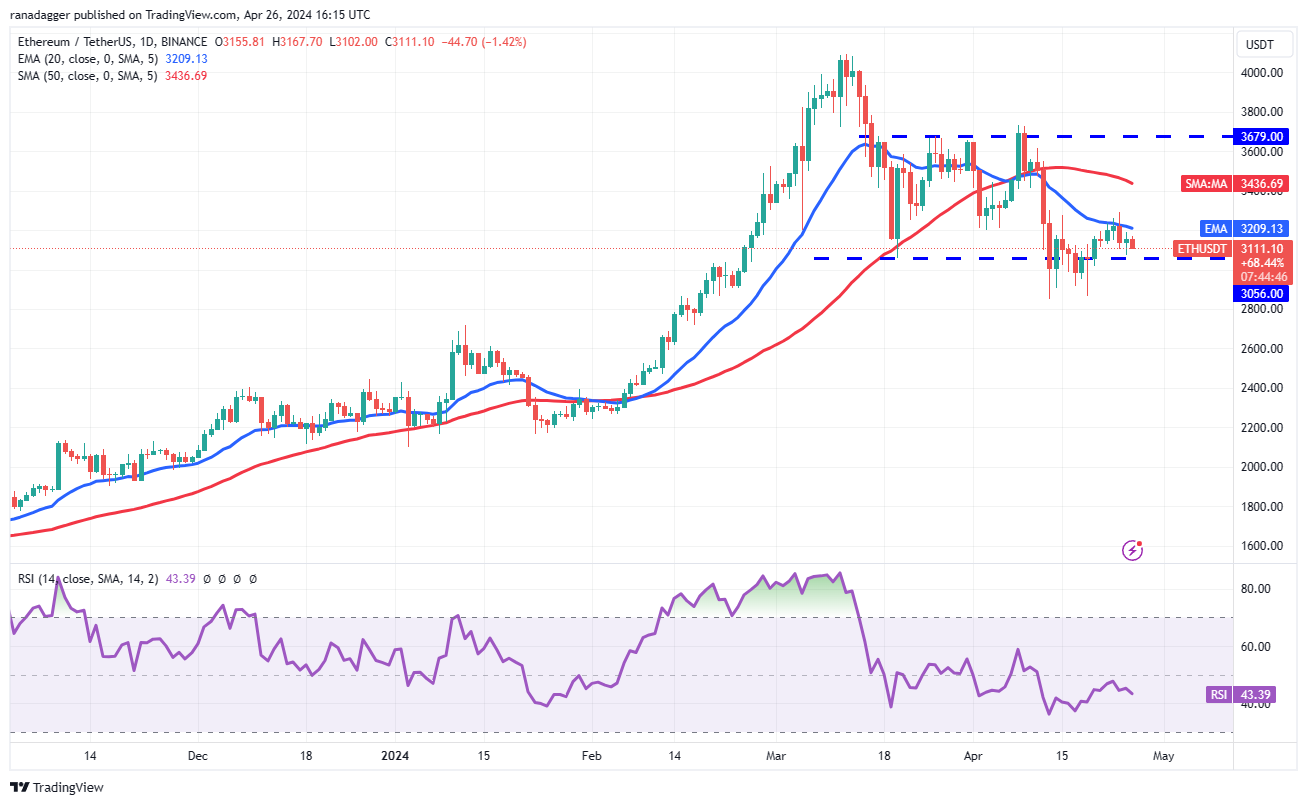
ETH/USDT daily chart. Source: TradingView
ETH/USDT 일일 차트. 출처: TradingView
This tight range trading is unlikely to continue for long. If the price pierces the 20-day EMA, the ETH/USDT pair could rise to the 50-day SMA ($3,436). This level may act as a short-term barrier, but it is likely to be crossed. The pair may then jump to $3,679.
이러한 좁은 범위의 거래는 오랫동안 지속되지 않을 것입니다. 가격이 20일 EMA를 돌파하면 ETH/USDT 쌍은 50일 SMA($3,436)까지 상승할 수 있습니다. 이 수준은 단기적으로는 장벽으로 작용할 수 있지만 넘어갈 가능성이 높다. 그러면 그 쌍은 $3,679까지 뛸 수 있습니다.
Conversely, if the price turns down and breaks below $3,056, it will suggest that the bears are in command. The pair may then retest the critical support at $2,852. A Break below this level may result in a decline to $2,700.
반대로, 가격이 하락하여 $3,056 아래로 떨어지면 하락세가 주도권을 쥐고 있음을 의미합니다. 그런 다음 쌍은 $2,852의 중요한 지지를 다시 테스트할 수 있습니다. 이 수준 아래로 떨어지면 $2,700까지 하락할 수 있습니다.
BNB price analysis
BNB 가격 분석
BNB (BNB) has been struggling to reach the overhead resistance of $635, suggesting that the bears are defending the level with vigor.
BNB(BNB)는 오버헤드 저항인 $635에 도달하기 위해 고군분투하고 있으며, 이는 하락세가 활발하게 저항 수준을 방어하고 있음을 시사합니다.
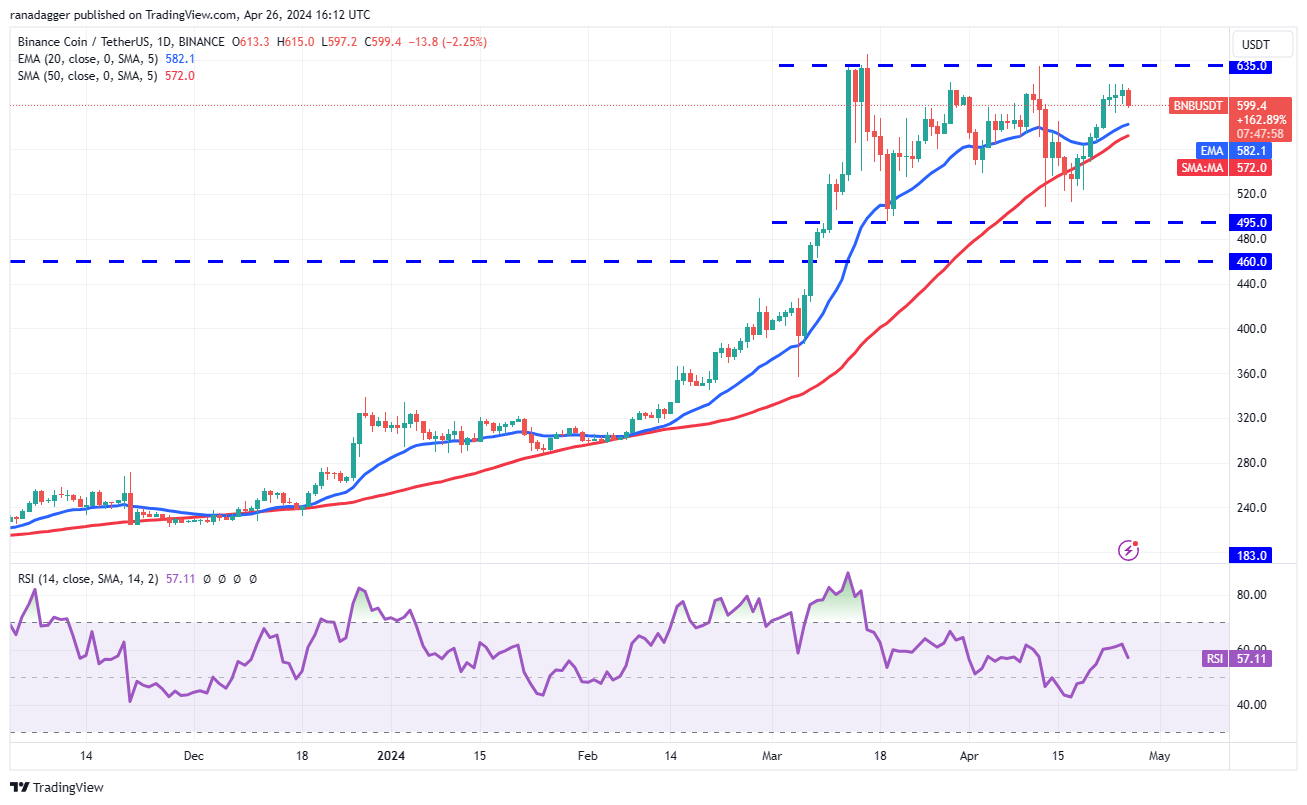
BNB/USDT daily chart. Source: TradingView
BNB/USDT 일일 차트. 출처: TradingView
However, a positive sign is that the bulls have not rushed to the exit. The price may pull back to the moving averages, where it is likely to find support. If the price rebounds off the moving averages with strength, it will enhance the possibility of a break above $635. If that happens, the BNB/USDT pair could surge to $692 and eventually to the pattern target of $775.
그러나 긍정적인 신호는 황소가 출구로 달려가지 않았다는 것입니다. 가격은 지지를 찾을 가능성이 있는 이동 평균으로 되돌아갈 수 있습니다. 가격이 이동 평균에서 강세를 보이며 반등한다면 $635를 넘어설 가능성이 높아집니다. 그렇게 되면 BNB/USDT 쌍은 692달러까지 급등하여 결국 패턴 목표인 775달러까지 올라갈 수 있습니다.
On the other hand, if the price slides below the moving averages, it will indicate that the range-bound action may extend for a few more days.
반면에 가격이 이동 평균 아래로 떨어지면 범위 제한 조치가 며칠 더 연장될 수 있음을 나타냅니다.
Solana price analysis
솔라나 가격 분석
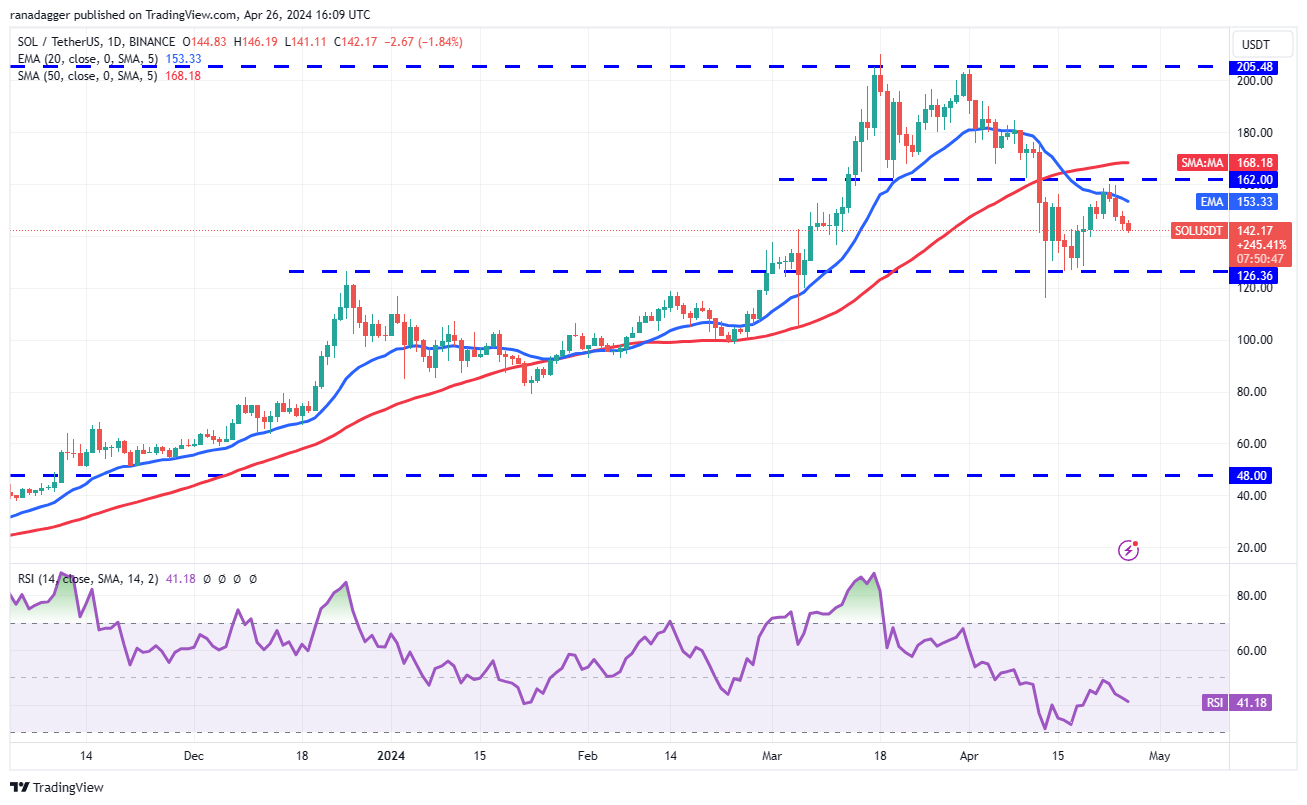
Solana (SOL) turned down from the overhead resistance of $162 on April 24, indicating that the bears are active at higher levels.
솔라나(SOL)는 4월 24일 162달러의 오버헤드 저항을 거절했는데, 이는 하락세가 더 높은 수준에서 활동하고 있음을 나타냅니다.
SOL/USDT daily chart. Source: TradingView
SOL/USDT 일일 차트. 출처: TradingView
The 20-day EMA ($153) is sloping down gradually, and the RSI is in the negative zone, indicating that the bears have the edge. The SOL/USDT pair could descend to the solid support at $126. If the price rebounds off this level with strength, it will indicate that the pair may remain sandwiched between $126 and $162 for a while longer.
20일 EMA($153)는 점진적으로 하락하고 있으며 RSI는 마이너스 영역에 있어 하락세가 우위에 있음을 나타냅니다. SOL/USDT 쌍은 $126의 견고한 지지선으로 내려갈 수 있습니다. 가격이 이 수준에서 강세를 보이며 반등한다면 이는 해당 쌍이 한동안 126달러와 162달러 사이에 끼어 있을 수 있음을 의미합니다.
The first sign of strength will be a break and close above the 50-day SMA ($168). That will open the doors for a possible rally to $205. Contrarily, a break below $126 could sink the pair to $100.
강세의 첫 번째 신호는 50일 SMA($168) 위에서 돌파 및 마감이 될 것입니다. 그러면 205달러까지 상승할 수 있는 문이 열릴 것입니다. 반대로 $126 이하로 하락하면 $100까지 하락할 수 있습니다.
XRP price analysis
XRP 가격 분석
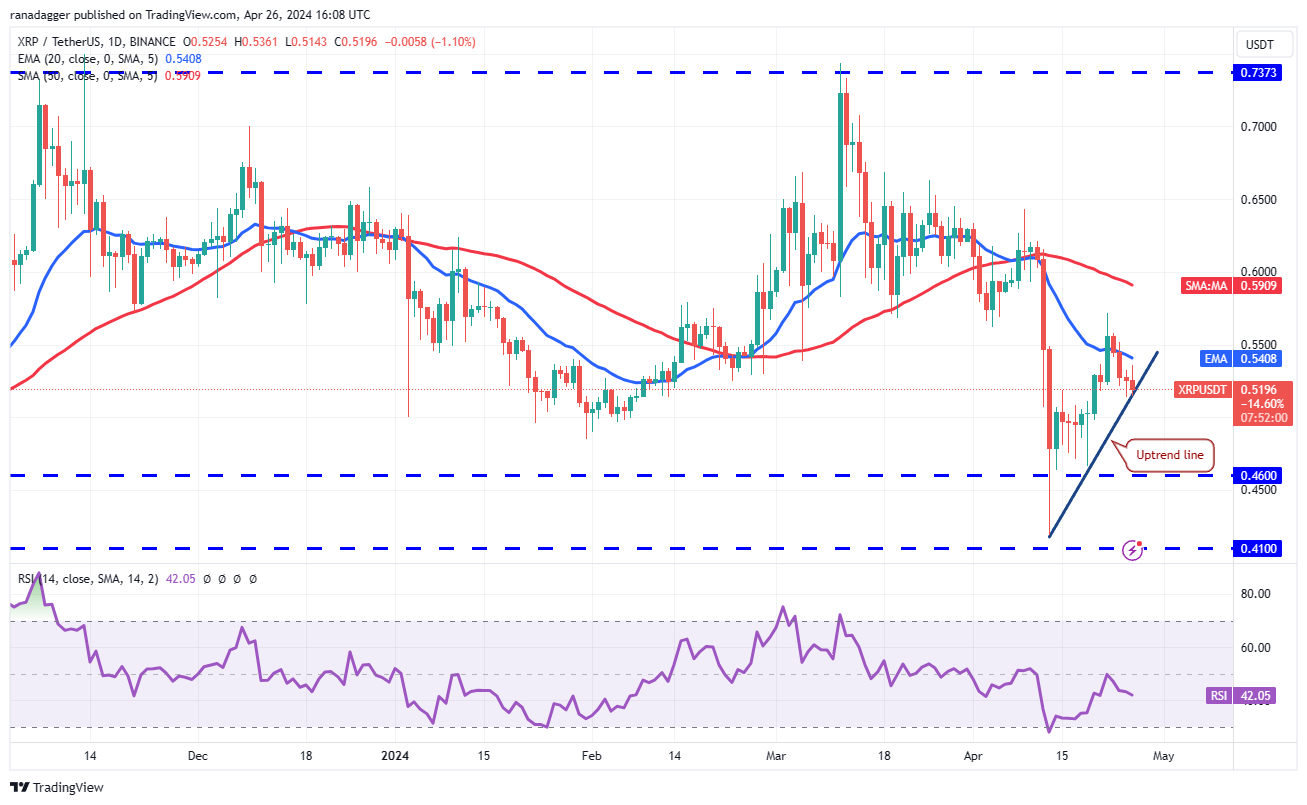
XRP (XRP) is trading below the 20-day EMA (0.54) but the bulls are trying to find support at the uptrend line.
XRP(XRP)는 20일 EMA(0.54) 아래에서 거래되고 있지만 황소는 상승 추세선에서 지지를 찾으려고 노력하고 있습니다.
XRP/USDT daily chart. Source: TradingView
XRP/USDT 일일 차트. 출처: TradingView
If the price bounces off the uptrend line and breaks above the 20-day EMA, it will suggest that the bears are losing their grip. The XRP/USDT pair could then attempt a rally to the 50-day SMA ($0.59) and subsequently to $0.69.
가격이 상승 추세선에서 반등하여 20일 EMA를 넘어설 경우 하락세가 힘을 잃고 있음을 나타냅니다. 그런 다음 XRP/USDT 쌍은 50일 SMA(0.59달러)까지 상승한 후 0.69달러까지 상승을 시도할 수 있습니다.
Contrary to this assumption, if the price continues lower and breaks below the uptrend line, it will suggest that the bears are in control. The pair may plunge to $0.46, where the bulls are expected to provide strong support.
이러한 가정과 반대로, 가격이 계속해서 하락하고 상승 추세선을 하향 돌파한다면 하락세가 통제되고 있음을 의미합니다. 통화쌍은 0.46달러까지 급락할 수 있으며, 여기서 강세는 강력한 지지를 제공할 것으로 예상됩니다.
Dogecoin price analysis
도지코인 가격 분석
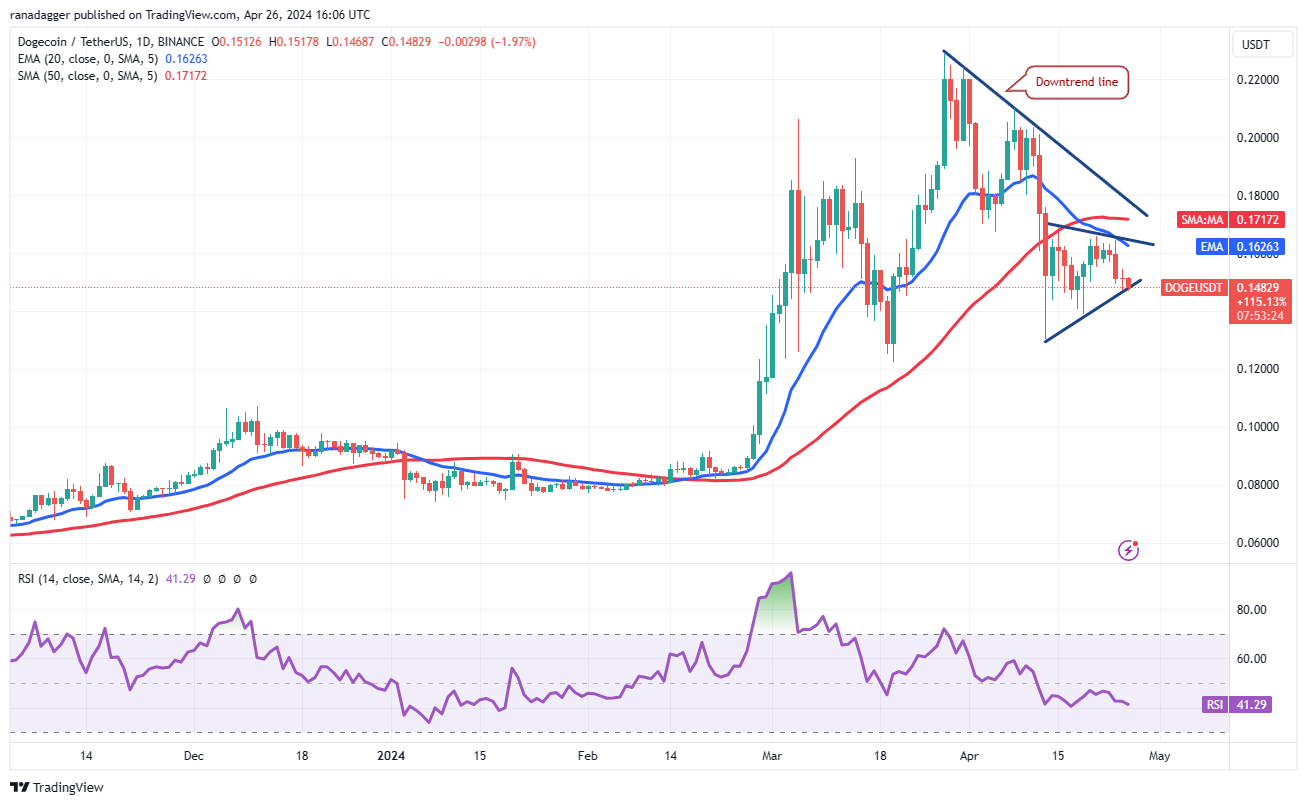
Dogecoin (DOGE) has formed a symmetrical triangle pattern, indicating indecision between the bulls and the bears.
Dogecoin(DOGE)은 대칭 삼각형 패턴을 형성하여 황소와 곰 사이의 우유부단함을 나타냅니다.
DOGE/USDT daily chart. Source: TradingView
DOGE/USDT 일일 차트. 출처: TradingView
The downsloping 20-day EMA ($0.16) and the RSI in the negative zone suggest that the path of least resistance is to the downside. If the price skids and maintains below the triangle, the DOGE/USDT pair may tumble to $0.12.
하락세를 보이는 20일 EMA($0.16)와 마이너스 영역의 RSI는 저항이 가장 적은 경로가 하락세임을 나타냅니다. 가격이 하락하여 삼각형 아래로 유지되면 DOGE/USDT 쌍은 $0.12로 하락할 수 있습니다.
On the contrary, if the price turns up from the current level and breaks above the triangle, it will signal aggressive buying on dips. That improves the prospects of a break above the downtrend line. The pair may then climb to $0.21.
반대로, 가격이 현재 수준에서 상승하여 삼각형을 넘어설 경우 하락 시 공격적인 매수 신호가 됩니다. 이는 하락 추세선을 넘어설 가능성을 높여줍니다. 그러면 해당 쌍은 $0.21까지 오를 수 있습니다.
Toncoin price analysis
톤코인 가격 분석
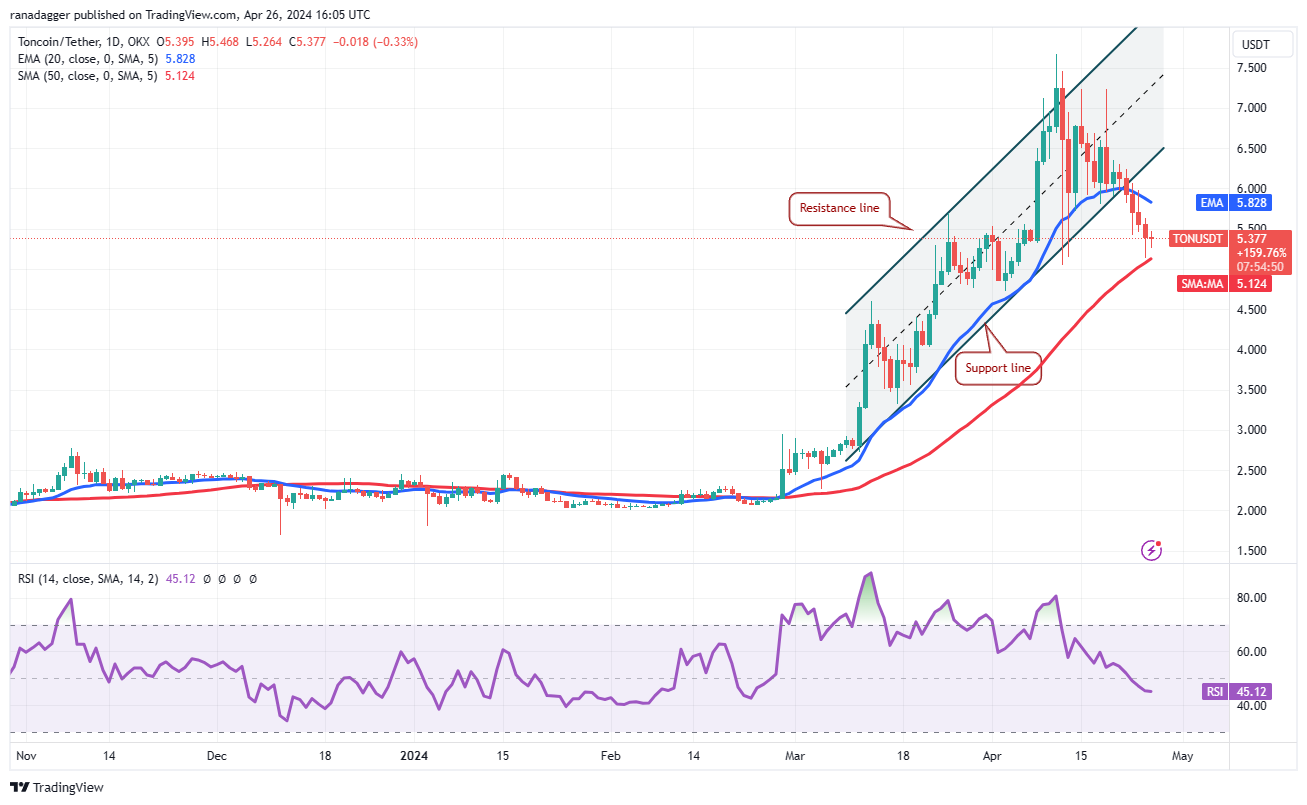
Toncoin (TON) broke below the ascending channel pattern on April 22 and reached the 50-day SMA ($5.12) on April 25.
톤코인(TON)은 4월 22일 상승 채널 패턴을 하향 이탈했고 4월 25일 50일 SMA($5.12)에 도달했습니다.
TON/USDT daily chart. Source: TradingView
TON/USDT 일일 차트. 출처: TradingView
The downsloping 20-day EMA ($5.82) and the RSI just below the midpoint suggest that the bears have a slight edge. If the price rebounds off the 50-day SMA, it is likely to face stiff resistance at the 20-day EMA. If the TON/USDT pair turns lower from the 20-day EMA, it will increase the likelihood of a drop below the 50-day SMA. The pair may then drop to $4.50.
하락세를 보이는 20일 EMA($5.82)와 중간점 바로 아래의 RSI는 하락세가 약간 우위에 있음을 시사합니다. 가격이 50일 SMA에서 반등할 경우 20일 EMA에서 강한 저항에 직면할 가능성이 높습니다. TON/USDT 쌍이 20일 EMA보다 낮아지면 50일 SMA 아래로 하락할 가능성이 높아집니다. 그러면 그 쌍은 $4.50까지 떨어질 수 있습니다.
This negative view will be invalidated if the bulls push the price back into the channel. Such a move will suggest that the recent breakdown may have been a bear trap.
황소가 가격을 다시 채널로 밀어 넣으면 이러한 부정적인 견해는 무효화됩니다. 그러한 움직임은 최근의 붕괴가 곰덫이었을 수도 있음을 암시할 것입니다.
Related: Here’s what happened in crypto today
관련 항목: 오늘 암호화폐에서 일어난 일은 다음과 같습니다.
Cardano price analysis
카르다노 가격 분석
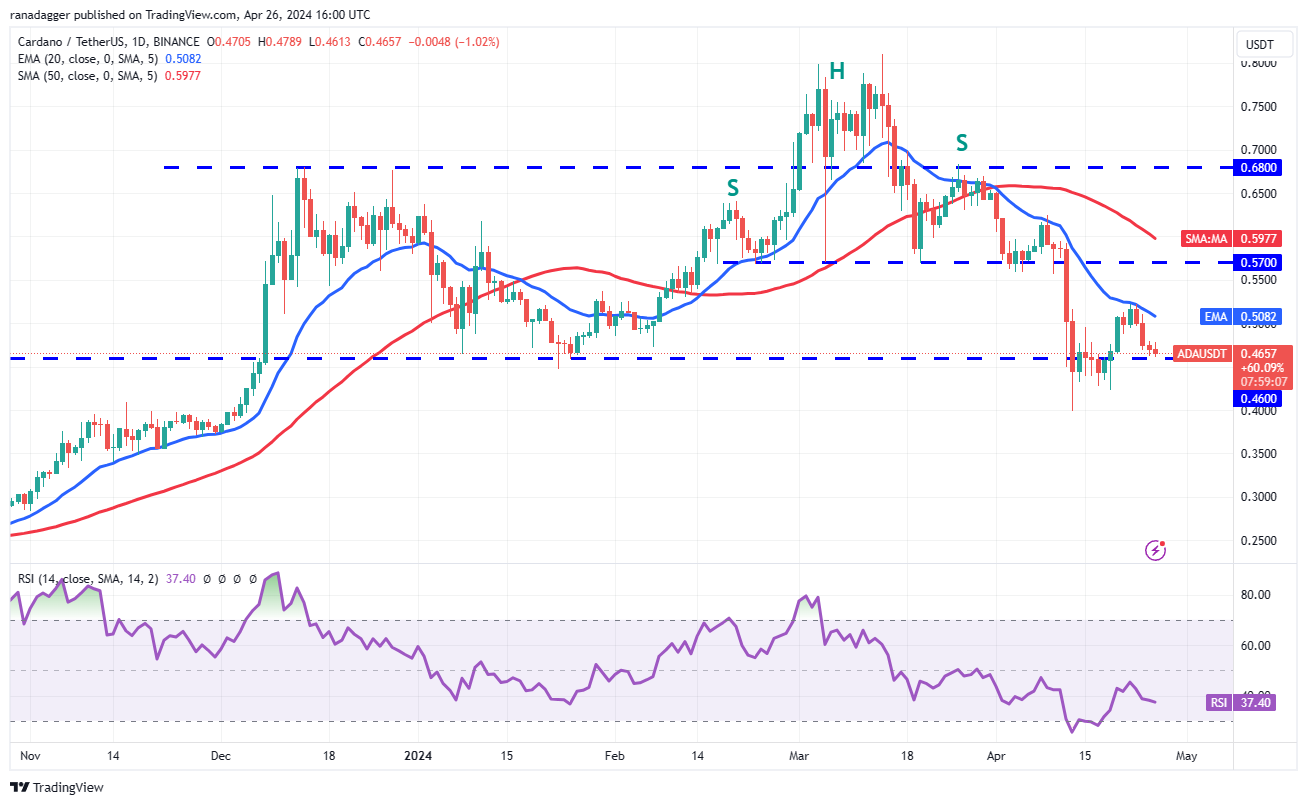
Cardano (ADA) turned lower from the 20-day EMA ($0.50) on April 23 and reached the important support at $0.46.
Cardano(ADA)는 4월 23일 20일 EMA($0.50)에서 하락하여 $0.46의 중요한 지지선에 도달했습니다.
ADA/USDT daily chart. Source: TradingView
ADA/USDT 일일 차트. 출처: TradingView
If the price rebounds off the $0.46 level and rises above the 20-day EMA, it will suggest that the correction may be over. The ADA/USDT pair could then rally to the 50-day SMA ($0.59) and later to $0.68.
가격이 0.46달러 수준에서 반등하고 20일 EMA 위로 상승하면 조정이 끝났을 수 있음을 의미합니다. 그러면 ADA/USDT 쌍은 50일 SMA($0.59)까지 상승한 후 나중에 $0.68까지 상승할 수 있습니다.
Instead, if the price continues lower and breaks below $0.46, it will indicate that the bears remain in charge. The pair could then slump to the crucial support at $0.40. A break below this level may resume the downtrend.
대신, 가격이 계속 낮아지고 0.46달러 미만으로 떨어지면 하락세가 계속 유지된다는 의미입니다. 그러면 통화쌍은 $0.40의 중요한 지지선까지 하락할 수 있습니다. 이 수준 아래로 돌파하면 하락 추세가 다시 시작될 수 있습니다.
Avalanche price analysis
눈사태 가격 분석
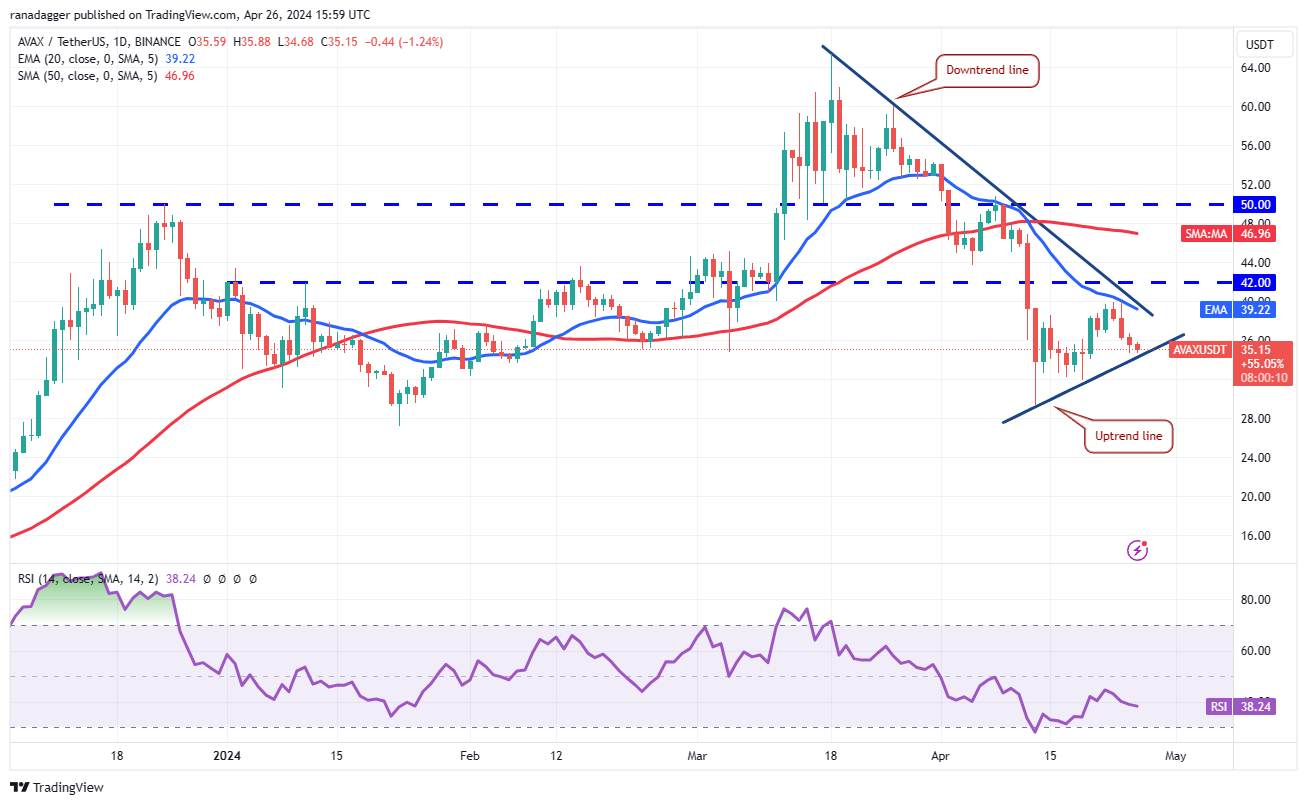
Avalanche (AVAX) turned down from the 20-day EMA ($39) on April 24, but the bears are finding it difficult to pull the price below the uptrend line.
Avalanche(AVAX)는 4월 24일 20일 EMA($39)에서 하락했지만 하락세는 가격을 상승 추세선 아래로 끌어내는 데 어려움을 겪고 있습니다.
AVAX/USDT daily chart. Source: TradingView
AVAX/USDT 일일 차트. 출처: TradingView
The bulls will have to push and maintain the price above the downtrend line to signal a potential short-term trend change. The AVAX/USDT pair could then attempt a rally toward the 50-day SMA ($47).
황소는 잠재적인 단기 추세 변화를 알리기 위해 가격을 하락 추세선 위로 밀고 유지해야 합니다. 그러면 AVAX/USDT 쌍은 50일 SMA(47달러)를 향한 상승세를 시도할 수 있습니다.
This optimistic view will be negated in the near term if the price continues lower and breaks below the uptrend line. That could sink the pair to the $32 to $27 support zone, where buyers are likely to step in.
가격이 계속해서 하락하고 상승 추세선을 하향 돌파한다면 이러한 낙관적인 견해는 단기적으로 무효화될 것입니다. 이는 구매자가 개입할 가능성이 있는 32~27달러 지지 구역으로 쌍을 가라앉힐 수 있습니다.
Shiba Inu price analysis
시바견 가격 분석
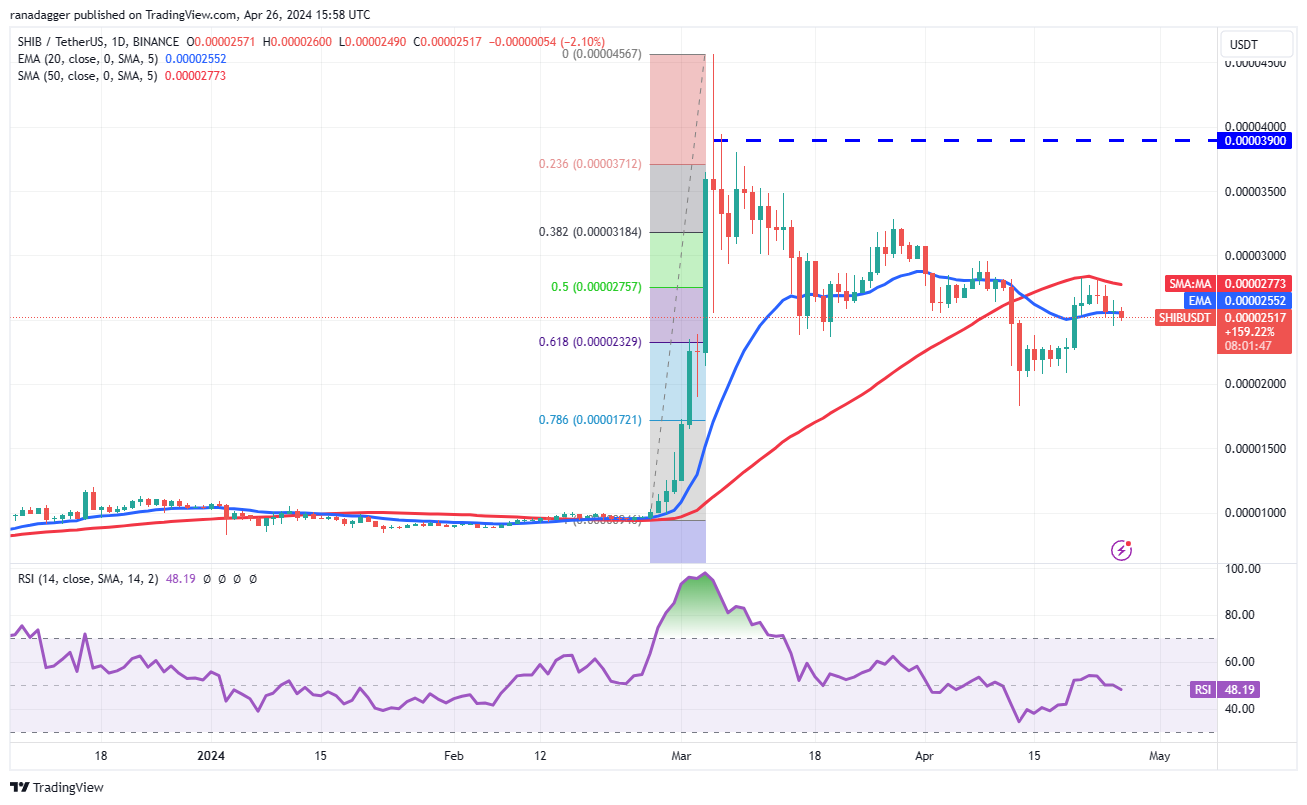
Shiba Inu (SHIB) has been stuck between the moving averages for the past few days, indicating indecision between the bulls and the bears.
시바견(SHIB)은 지난 며칠 동안 이동 평균 사이에 갇혀 있어 상승세와 하락세 사이의 우유부단함을 나타냅니다.
SHIB/USDT daily chart. Source: TradingView
SHIB/USDT 일일 차트. 출처: TradingView
The flattish 20-day EMA ($0.000025) and the RSI near the midpoint do not give a clear advantage either to the bulls or the bears. If
평평한 20일 EMA($0.000025)와 중간 지점 근처의 RSI는 강세장이나 약세장 모두에게 확실한 이점을 제공하지 않습니다. 만약에
 U_Today
 Thecoinrepublic.com
 DogeHome
 Optimisus
 Optimisus
 DeFi Planet
 Crypto Daily™
 BlockchainReporter
 TheCoinrise Media


