

Bitcoin (BTC) continues to trade within a large range, suggesting indecision about the next trending move. Analysts trying to predict the direction are enthused by the $1.3 billion of USD Coin (USDC) transferred to Coinbase by whale addresses. Expectations are that the funds will be used to buy Bitcoin and Ether (ETH).
ビットコイン(BTC)は引き続き大きなレンジ内で取引されており、次のトレンドの動きについて未定であることを示唆している。方向性を予測しようとしているアナリストは、クジラアドレスによってCoinbaseに転送された13億ドルのUSDコイン(USDC)に熱中しています。この資金はビットコインとイーサ(ETH)の購入に使用されると予想されている。
Large investors are not only buying the top two coins by market capitalization. CoinShares head of research James Butterfill said in a recent report based on a survey of 64 institutional investors that 15% of the respondents had invested in Solana (SOL). In comparison, none of the investors held Solana in the firm’s January survey.
大規模投資家は時価総額上位2コインだけを買っているわけではない。 CoinSharesの調査責任者ジェームズ・バターフィル氏は、機関投資家64名を対象とした調査に基づく最近のレポートで、回答者の15%がソラナ(SOL)に投資していたと述べた。これに対し、同社の1月の調査ではソラナを保有していた投資家はいなかった。
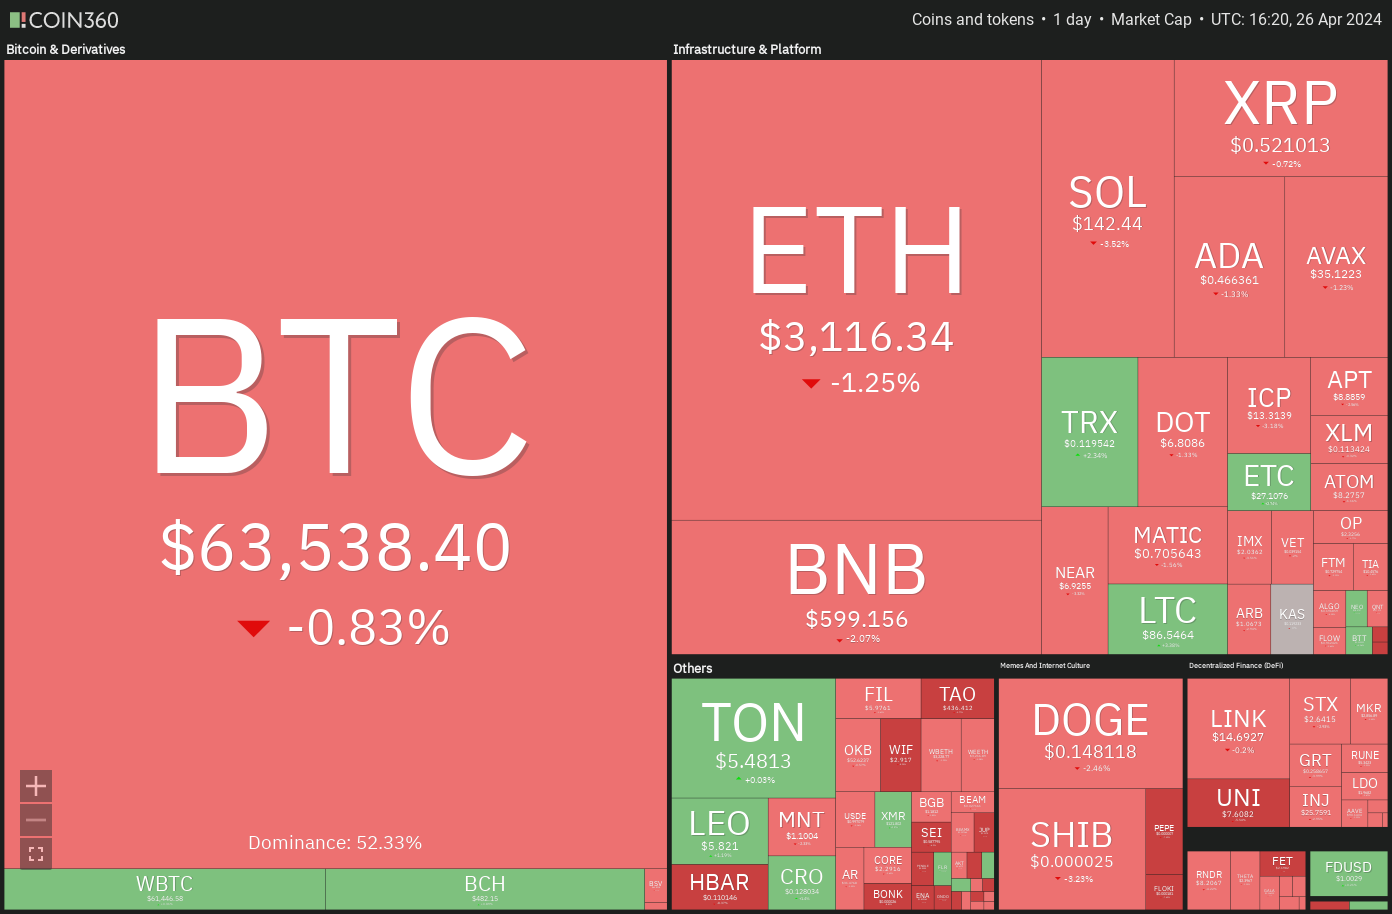
Crypto market data daily view. Source: Coin360
仮想通貨市場データの日次ビュー。出典: Coin360
Morgan Creek Capital CEO Mark Yusko said in a recent interview with The Wolf Of All Streets podcast that about $300 billion of baby boomers’ wealth is likely to enter into digital assets within 12 months. This inflow could boost the cryptocurrency market capitalization to $6 trillion.
モーガン・クリーク・キャピタルのマーク・ユスコ最高経営責任者(CEO)は、ポッドキャスト「ウルフ・オブ・オール・ストリート」の最近のインタビューで、団塊の世代の資産のうち約3000億ドルが12カ月以内にデジタル資産に流入する可能性が高いと述べた。この流入により、仮想通貨の時価総額は6兆ドルに達する可能性がある。
Can buyers thwart attempts by the bears to deepen the correction in Bitcoin and altcoins? Let’s analyze the charts of the top 10 cryptocurrencies to find out.
買い手はビットコインとアルトコインの調整を深めようとする弱気派の試みを阻止できるだろうか?それを知るために、トップ 10 の仮想通貨のチャートを分析してみましょう。
Bitcoin price analysis
ビットコイン価格分析
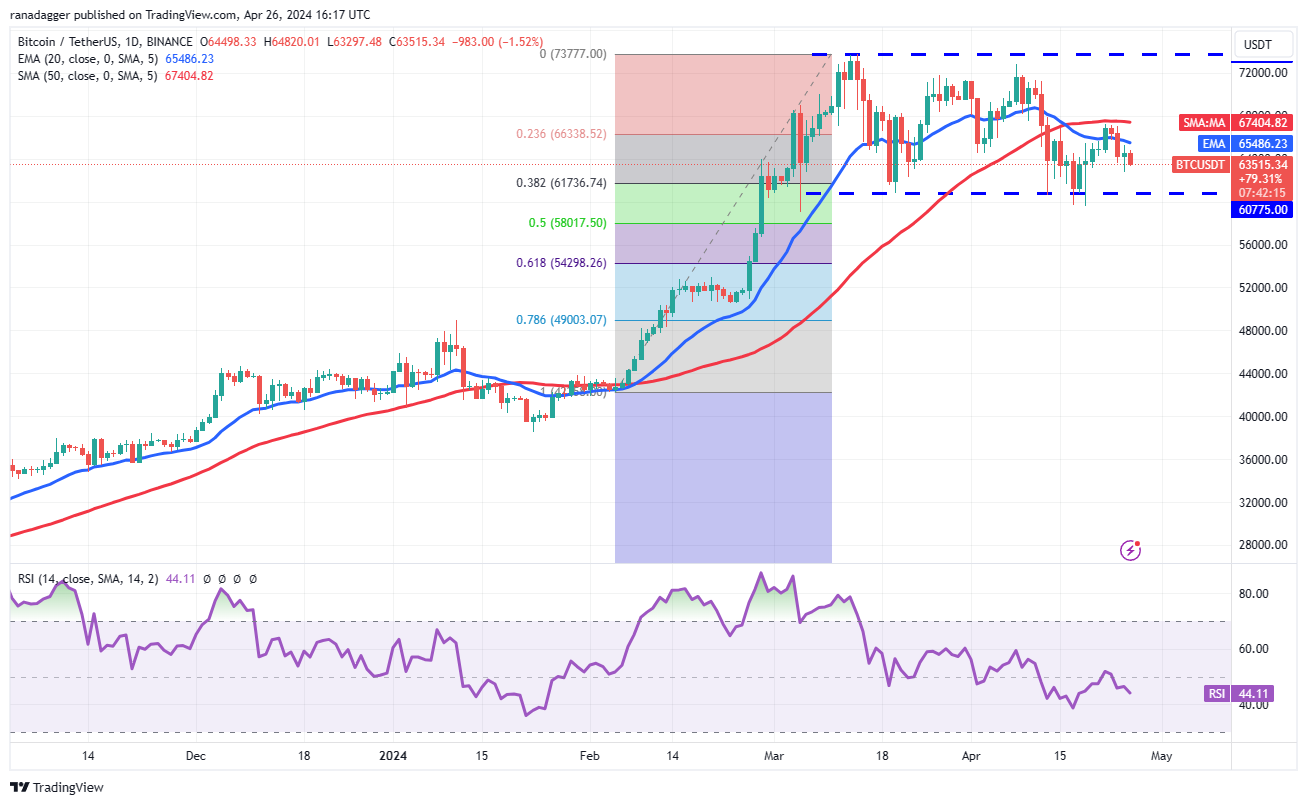
Bitcoin has been trading below the moving averages for the past few days, but the bears are struggling to sink the price to the crucial support at $60,775. This suggests that selling dries up at lower levels.
ビットコインはここ数日間、移動平均を下回って取引されているが、弱気派は価格を重要なサポートである60,775ドルまで下げるのに苦労している。これは、より低い水準では売りが枯渇することを示唆している。
BTC/USDT daily chart. Source: TradingView
BTC/USDTの日足チャート。出典: TradingView
The price is stuck between the 50-day simple moving average ($67,404) and the vital support at $60,775. The 20-day exponential moving average ($65,542) has started to turn down and the relative strength index (RSI) is just below the midpoint, indicating a minor advantage to the bears.
価格は50日単純移動平均(67,404ドル)と重要なサポートである60,775ドルの間に挟まれています。 20日指数移動平均(6万5542ドル)は下落し始めており、相対力指数(RSI)は中間点をわずかに下回っており、弱気派が若干有利であることを示している。
A break and close below $59,600 could open the doors for a drop to the 61.8% Fibonacci retracement level of $54,298.
59,600ドルを下回って終値をとれば、61.8%のフィボナッチリトレースメントレベルである54,298ドルまで下落する可能性があります。
This bearish view will be negated in the near term if the price rises above the 50-day SMA. The BTC/USDT pair may then climb to $73,777. This remains the key overhead resistance for the bulls to overcome.
価格が50日SMAを超えて上昇すれば、この弱気の見方は短期的には打ち消されるだろう。その後、BTC/USDTペアは73,777ドルまで上昇する可能性があります。これは依然として強気派にとって克服すべき重要な頭上抵抗である。
Ether price analysis
イーサ価格分析
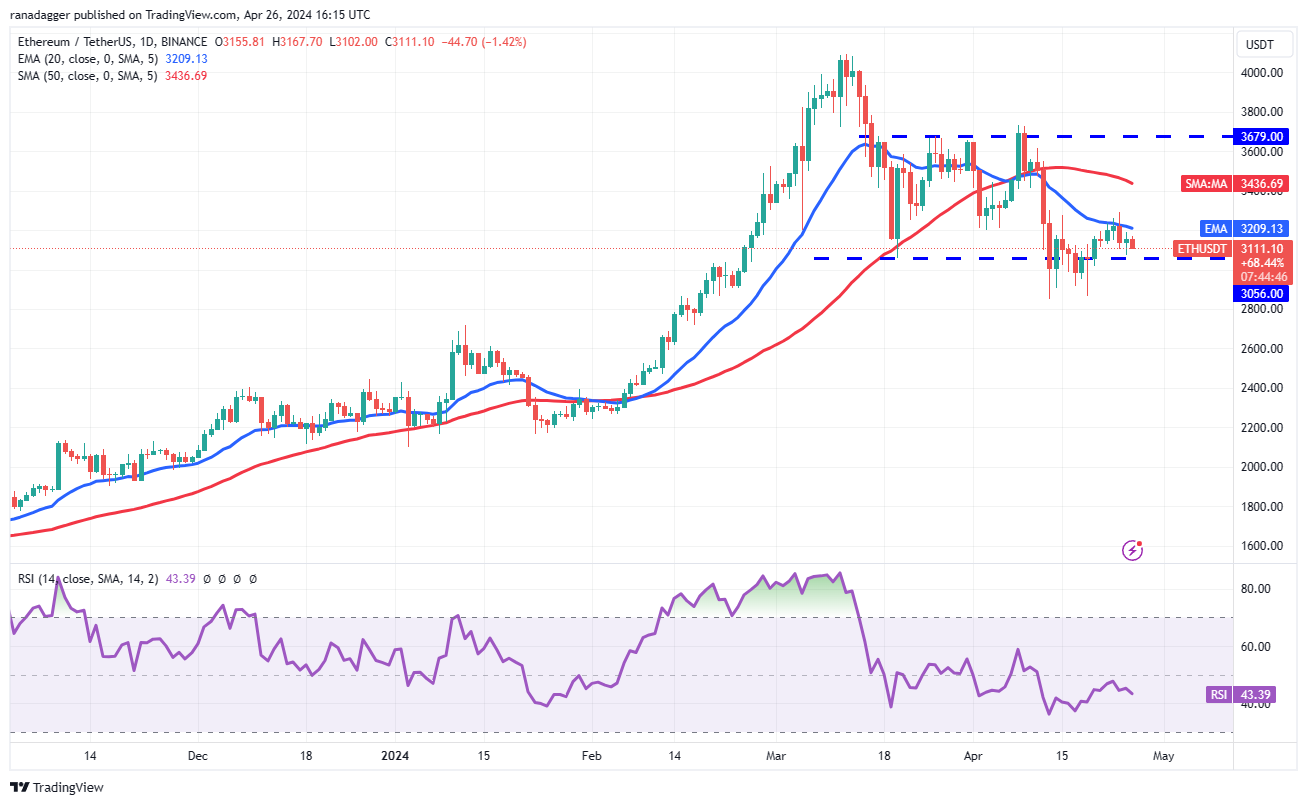
Ether has been oscillating between the 20-day EMA ($3,209) and the horizontal support of $3,056 for the past few days.
イーサはここ数日間、20日間EMA(3,209ドル)と水平サポートの3,056ドルの間で変動している。
ETH/USDT daily chart. Source: TradingView
ETH/USDTの日足チャート。出典: TradingView
This tight range trading is unlikely to continue for long. If the price pierces the 20-day EMA, the ETH/USDT pair could rise to the 50-day SMA ($3,436). This level may act as a short-term barrier, but it is likely to be crossed. The pair may then jump to $3,679.
この狭いレンジ取引が長く続く可能性は低い。価格が20日間EMAを突破した場合、ETH/USDTペアは50日間SMA(3,436ドル)まで上昇する可能性があります。このレベルは短期的な障壁として機能する可能性がありますが、おそらく超えられるでしょう。その後、ペアは3,679ドルまで跳ね上がる可能性がある。
Conversely, if the price turns down and breaks below $3,056, it will suggest that the bears are in command. The pair may then retest the critical support at $2,852. A Break below this level may result in a decline to $2,700.
逆に、価格が下落して3,056ドルを下回った場合は、弱気派が主導権を握っていることを示唆することになる。その後、ペアは2,852ドルの重要なサポートを再テストする可能性があります。このレベルを下回ると、2,700 ドルまで下落する可能性があります。
BNB price analysis
BNB価格分析
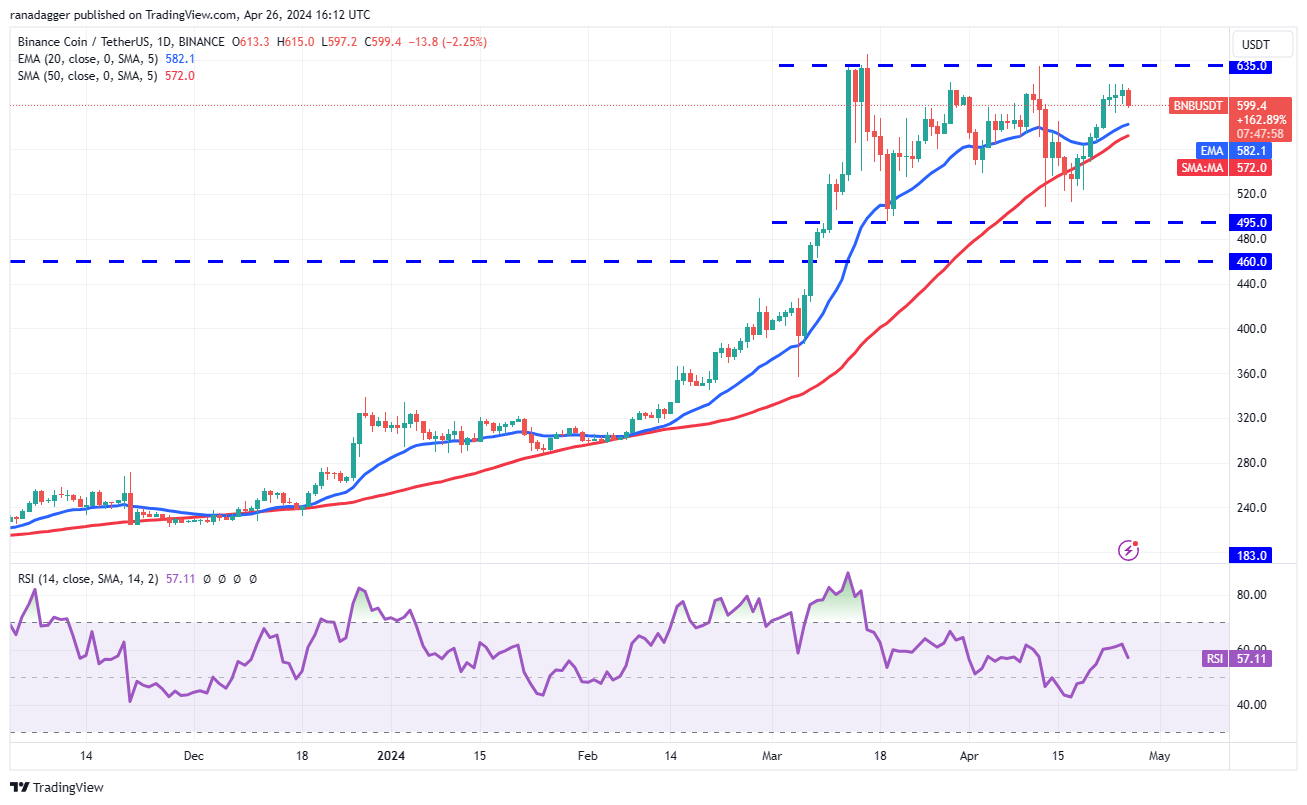
BNB (BNB) has been struggling to reach the overhead resistance of $635, suggesting that the bears are defending the level with vigor.
BNB(BNB)は直上の抵抗線である635ドルに到達するのに苦戦しており、弱気派が精力的にその水準を守っていることを示唆している。
BNB/USDT daily chart. Source: TradingView
BNB/USDTの日足チャート。出典: TradingView
However, a positive sign is that the bulls have not rushed to the exit. The price may pull back to the moving averages, where it is likely to find support. If the price rebounds off the moving averages with strength, it will enhance the possibility of a break above $635. If that happens, the BNB/USDT pair could surge to $692 and eventually to the pattern target of $775.
しかし、強気派が出口に急いでいないことは明るい兆候だ。価格は移動平均線に戻る可能性があり、そこでサポートされる可能性が高い。価格が移動平均から力強く反発すれば、635ドルを突破する可能性が高まるだろう。そうなれば、BNB/USDTペアは692ドルまで急騰し、最終的にはパターン目標の775ドルに達する可能性がある。
On the other hand, if the price slides below the moving averages, it will indicate that the range-bound action may extend for a few more days.
一方、価格が移動平均線を下回った場合は、レンジ内での動きがさらに数日間続く可能性があることを示します。
Solana price analysis
ソラナの価格分析
Solana (SOL) turned down from the overhead resistance of $162 on April 24, indicating that the bears are active at higher levels.
ソラナ (SOL) は 4 月 24 日の 162 ドルの頭上の抵抗線から下落し、弱気派がより高いレベルで活動していることを示しています。
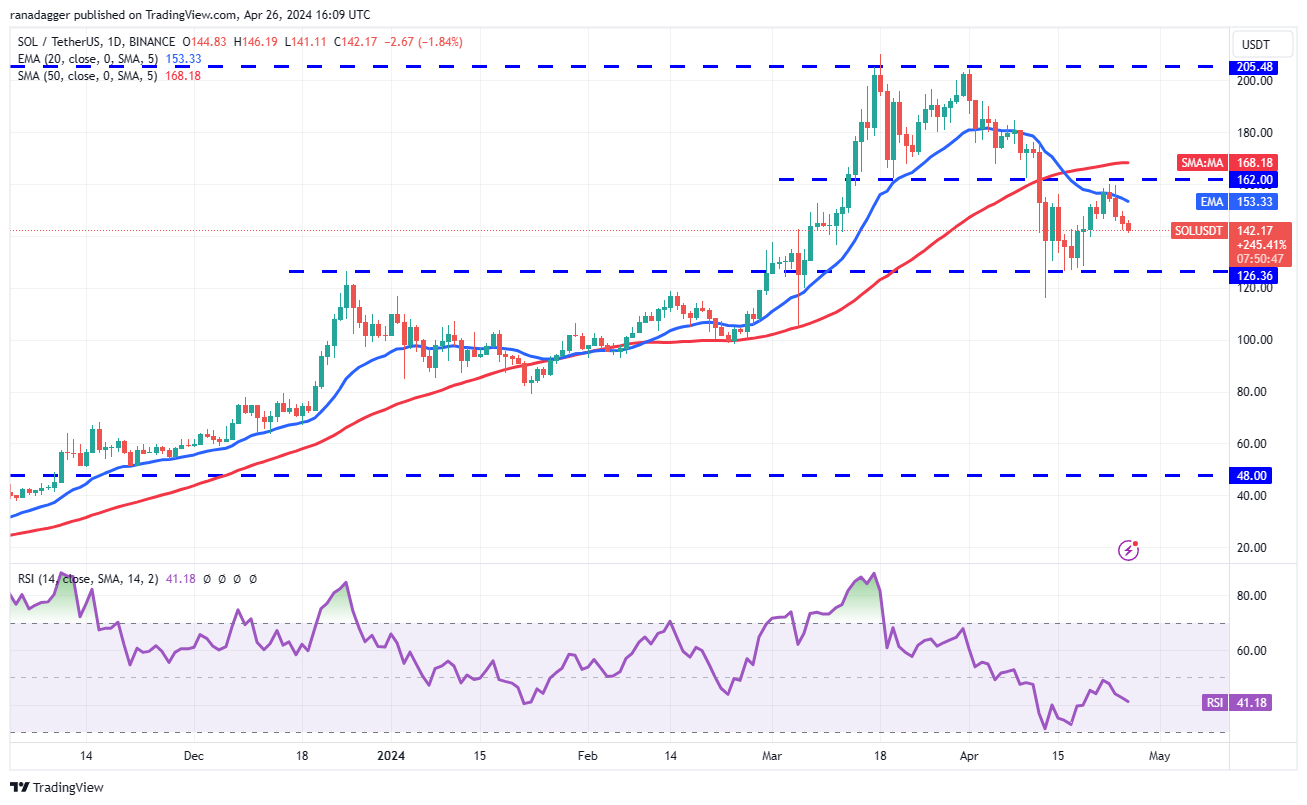
SOL/USDT daily chart. Source: TradingView
SOL/USDTの日足チャート。出典: TradingView
The 20-day EMA ($153) is sloping down gradually, and the RSI is in the negative zone, indicating that the bears have the edge. The SOL/USDT pair could descend to the solid support at $126. If the price rebounds off this level with strength, it will indicate that the pair may remain sandwiched between $126 and $162 for a while longer.
20日間EMA(153ドル)は徐々に下降しており、RSIはマイナスゾーンにあり、弱気派が優勢であることを示している。 SOL/USDTペアは126ドルの堅調なサポートまで下落する可能性がある。価格がこのレベルから力強く反発した場合、ペアはしばらくの間126ドルと162ドルの間に挟まれたままになる可能性があることを示します。
The first sign of strength will be a break and close above the 50-day SMA ($168). That will open the doors for a possible rally to $205. Contrarily, a break below $126 could sink the pair to $100.
強さの最初の兆候は、50日間のSMA(168ドル)を上抜けて終了することだろう。これにより、205ドルへの上昇の可能性が開かれることになる。逆に、126ドルを下回ると、ペアは100ドルに下落する可能性があります。
XRP price analysis
XRP価格分析
XRP (XRP) is trading below the 20-day EMA (0.54) but the bulls are trying to find support at the uptrend line.
XRP(XRP)は20日間EMA(0.54)を下回って取引されているが、強気派は上昇トレンドラインでサポートを見つけようとしている。
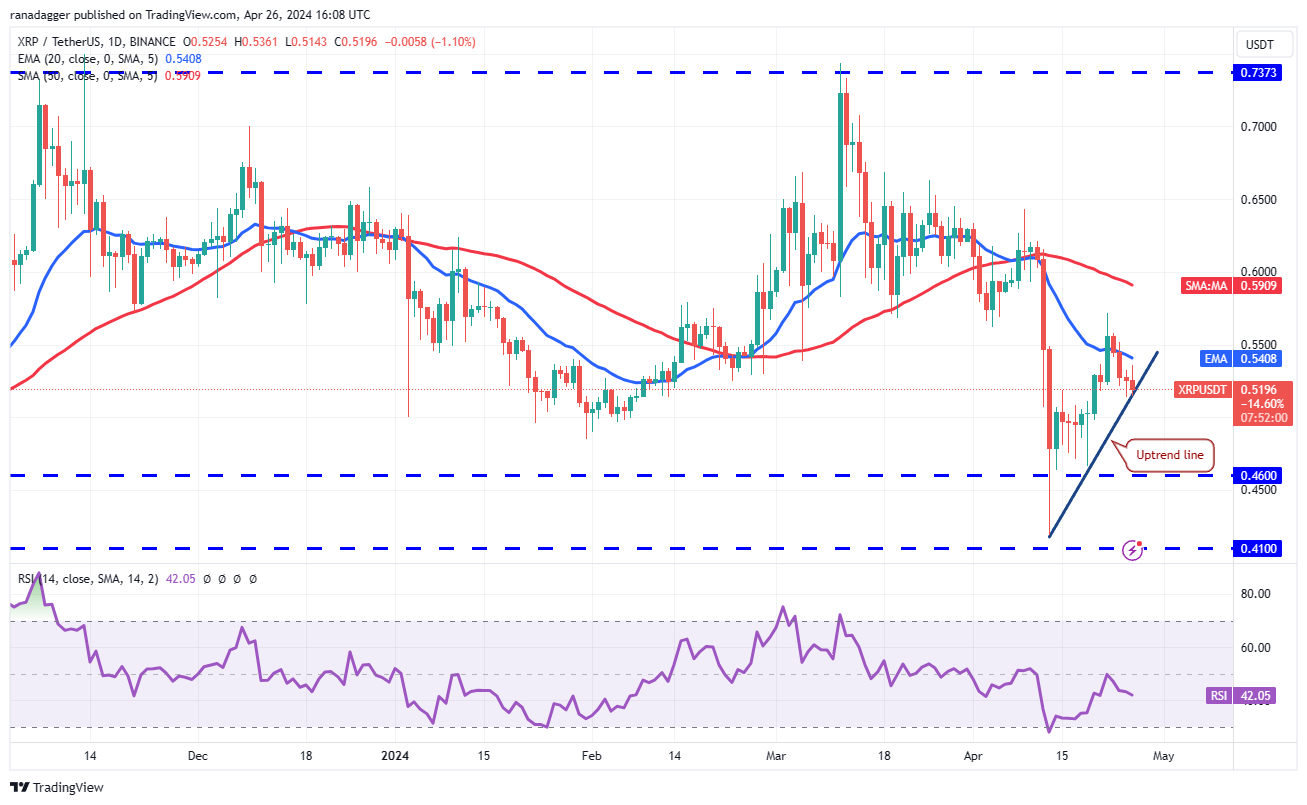
XRP/USDT daily chart. Source: TradingView
XRP/USDTの日足チャート。出典: TradingView
If the price bounces off the uptrend line and breaks above the 20-day EMA, it will suggest that the bears are losing their grip. The XRP/USDT pair could then attempt a rally to the 50-day SMA ($0.59) and subsequently to $0.69.
価格が上昇トレンドラインから跳ね返り、20日間EMAを上抜けた場合、弱気派が支配力を失いつつあることを示唆するだろう。その後、XRP/USDTペアは50日間SMA(0.59ドル)、その後0.69ドルへの上昇を試みる可能性がある。
Contrary to this assumption, if the price continues lower and breaks below the uptrend line, it will suggest that the bears are in control. The pair may plunge to $0.46, where the bulls are expected to provide strong support.
この想定に反して、価格が下落を続けて上昇トレンドラインを下抜けた場合、弱気派が主導権を握っていることを示唆することになる。ペアは0.46ドルまで下落する可能性があり、強気派が強力なサポートを提供すると予想される。
Dogecoin price analysis
ドージコインの価格分析
Dogecoin (DOGE) has formed a symmetrical triangle pattern, indicating indecision between the bulls and the bears.
ドージコイン(DOGE)は対称的な三角形のパターンを形成しており、強気派と弱気派の間で優柔不断な姿勢が示されています。
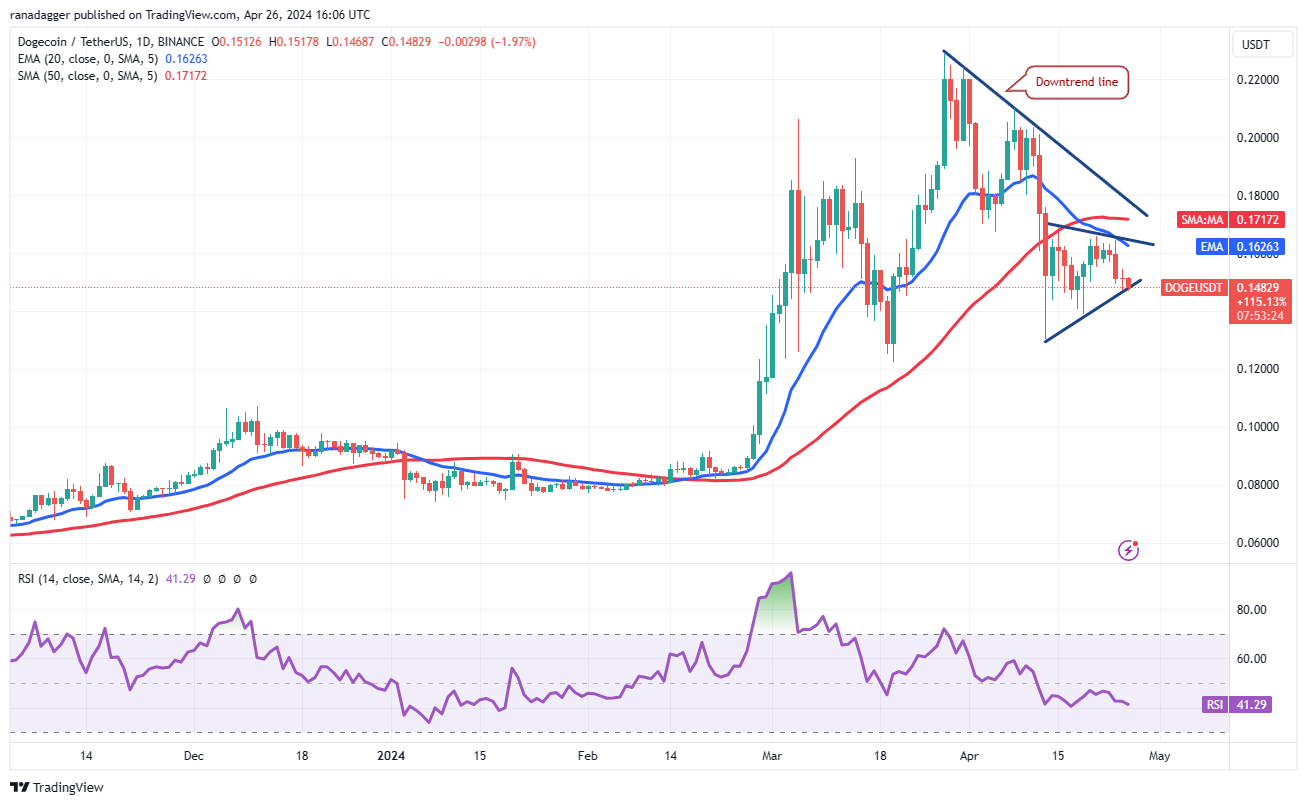
DOGE/USDT daily chart. Source: TradingView
DOGE/USDTの日足チャート。出典: TradingView
The downsloping 20-day EMA ($0.16) and the RSI in the negative zone suggest that the path of least resistance is to the downside. If the price skids and maintains below the triangle, the DOGE/USDT pair may tumble to $0.12.
下り坂の 20 日間 EMA (0.16 ドル) とマイナスゾーンにある RSI は、最も抵抗が少ない道が下値方向であることを示唆しています。価格が滑り、トライアングルを下回った場合、DOGE/USDT ペアは 0.12 ドルまで下落する可能性があります。
On the contrary, if the price turns up from the current level and breaks above the triangle, it will signal aggressive buying on dips. That improves the prospects of a break above the downtrend line. The pair may then climb to $0.21.
逆に、価格が現在のレベルから上昇し、トライアングルを上抜けた場合は、押し目買いのサインとなります。これにより、下降トレンドラインを突破する可能性が高まります。その後、ペアは0.21ドルまで上昇する可能性がある。
Toncoin price analysis
トンコイン価格分析
Toncoin (TON) broke below the ascending channel pattern on April 22 and reached the 50-day SMA ($5.12) on April 25.
トンコイン(TON)は4月22日に上昇チャネルパターンを下回り、4月25日には50日間SMA(5.12ドル)に達した。
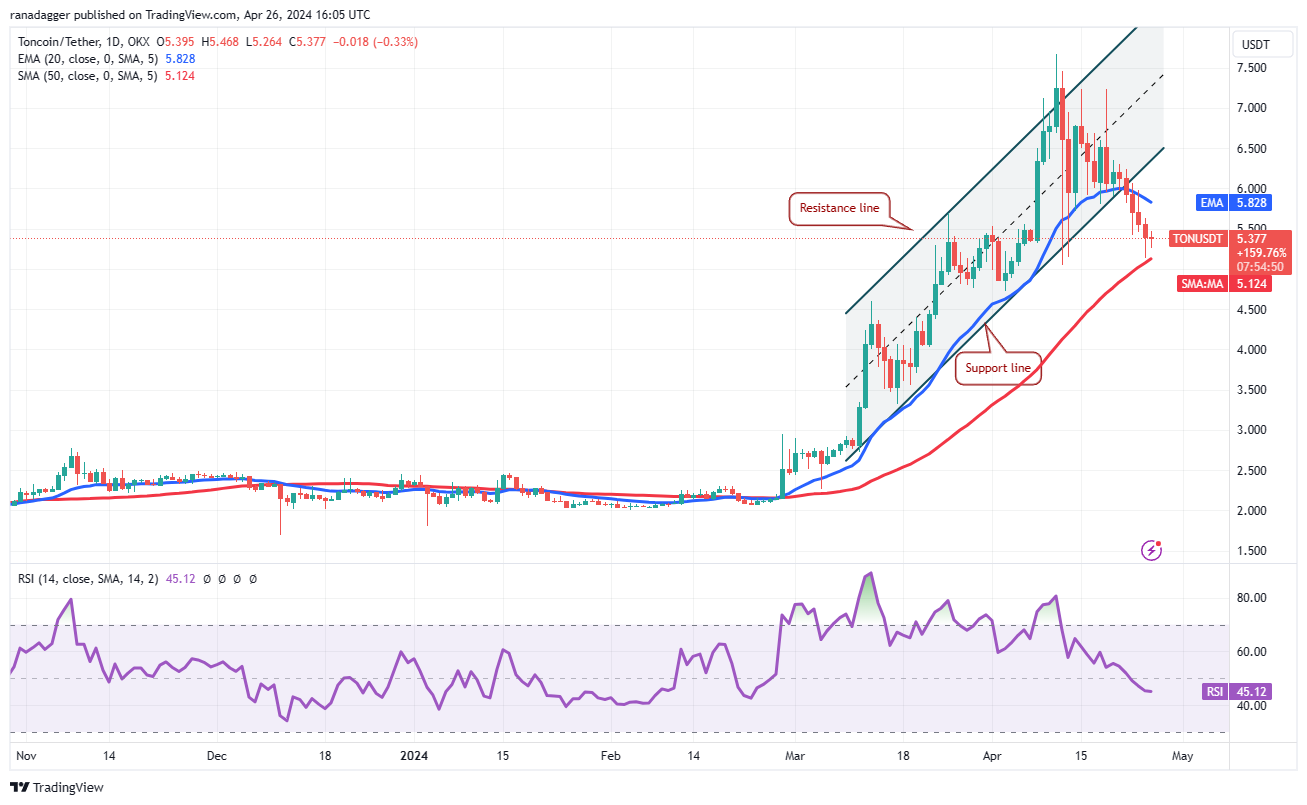
TON/USDT daily chart. Source: TradingView
TON/USDTの日足チャートです。出典: TradingView
The downsloping 20-day EMA ($5.82) and the RSI just below the midpoint suggest that the bears have a slight edge. If the price rebounds off the 50-day SMA, it is likely to face stiff resistance at the 20-day EMA. If the TON/USDT pair turns lower from the 20-day EMA, it will increase the likelihood of a drop below the 50-day SMA. The pair may then drop to $4.50.
下り坂の20日間EMA(5.82ドル)と中間点のすぐ下にあるRSIは、弱気派がわずかに有利であることを示唆している。価格が50日間SMAから反発した場合、20日間EMAで厳しい抵抗に直面する可能性が高い。 TON/USDT ペアが 20 日間 EMA を下回ると、50 日間 SMA を下回る可能性が高まります。その後、ペアは4.50ドルまで下落する可能性がある。
This negative view will be invalidated if the bulls push the price back into the channel. Such a move will suggest that the recent breakdown may have been a bear trap.
強気派が価格をチャネルに押し戻せば、この否定的な見方は無効になるだろう。このような動きは、最近の故障がクマの罠であった可能性を示唆するでしょう。
Related: Here’s what happened in crypto today
関連:今日暗号通貨で何が起こったか
Cardano price analysis
カルダノの価格分析
Cardano (ADA) turned lower from the 20-day EMA ($0.50) on April 23 and reached the important support at $0.46.
カルダノ(ADA)は4月23日の20日間EMA(0.50ドル)から下落し、重要なサポートである0.46ドルに達した。
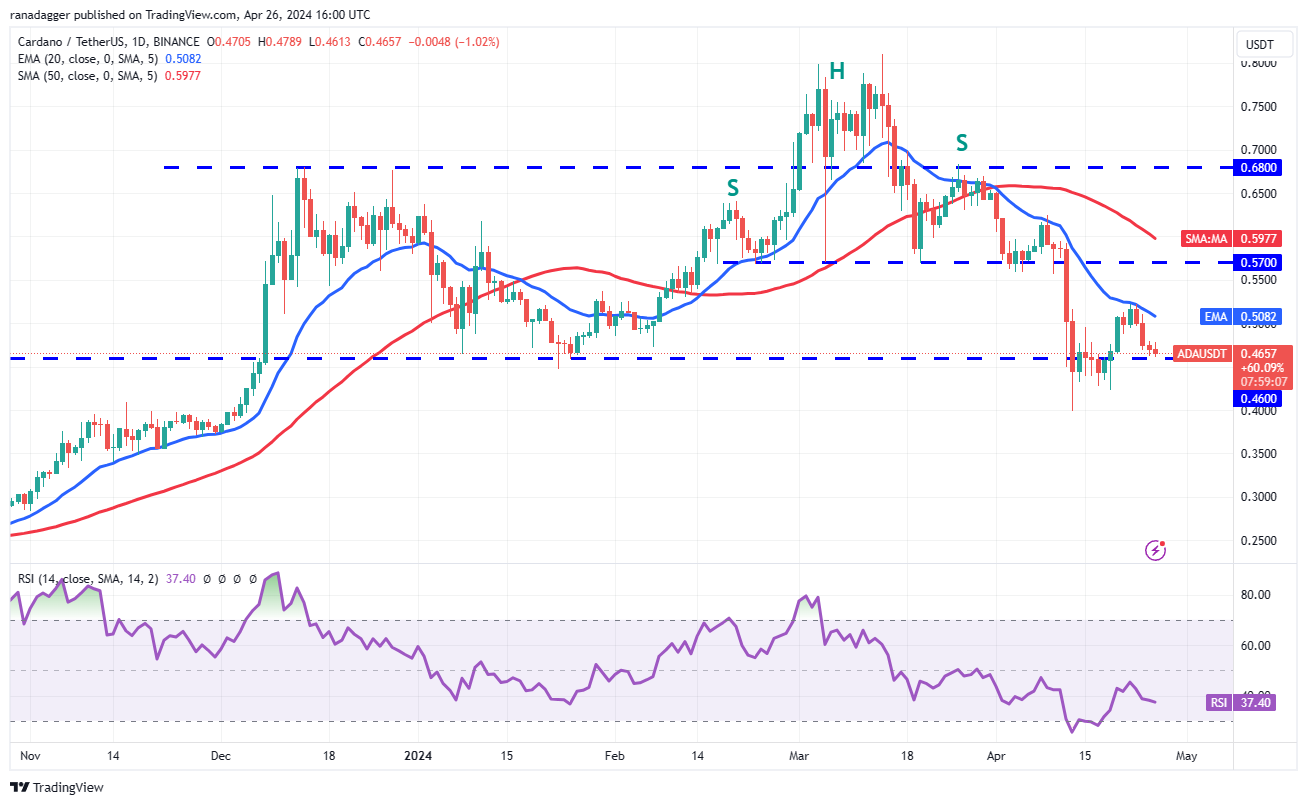
ADA/USDT daily chart. Source: TradingView
ADA/USDTの日足チャート。出典: TradingView
If the price rebounds off the $0.46 level and rises above the 20-day EMA, it will suggest that the correction may be over. The ADA/USDT pair could then rally to the 50-day SMA ($0.59) and later to $0.68.
価格が0.46ドルの水準から反発し、20日間EMAを上回った場合、調整が終わった可能性があることを示唆することになる。その後、ADA/USDTペアは50日間SMA(0.59ドル)まで上昇し、その後は0.68ドルまで上昇する可能性がある。
Instead, if the price continues lower and breaks below $0.46, it will indicate that the bears remain in charge. The pair could then slump to the crucial support at $0.40. A break below this level may resume the downtrend.
むしろ、価格が下落を続けて0.46ドルを下回った場合、弱気派が依然として主導権を握っていることを示すことになる。その後、通貨ペアは重要なサポートである0.40ドルまで下落する可能性がある。このレベルを下回ると、下降トレンドが再開される可能性があります。
Avalanche price analysis
雪崩価格分析
Avalanche (AVAX) turned down from the 20-day EMA ($39) on April 24, but the bears are finding it difficult to pull the price below the uptrend line.
アバランチ(AVAX)は4月24日の20日間EMA(39ドル)から下落したが、弱気派は価格を上昇トレンドラインを下回るのが難しいと感じている。
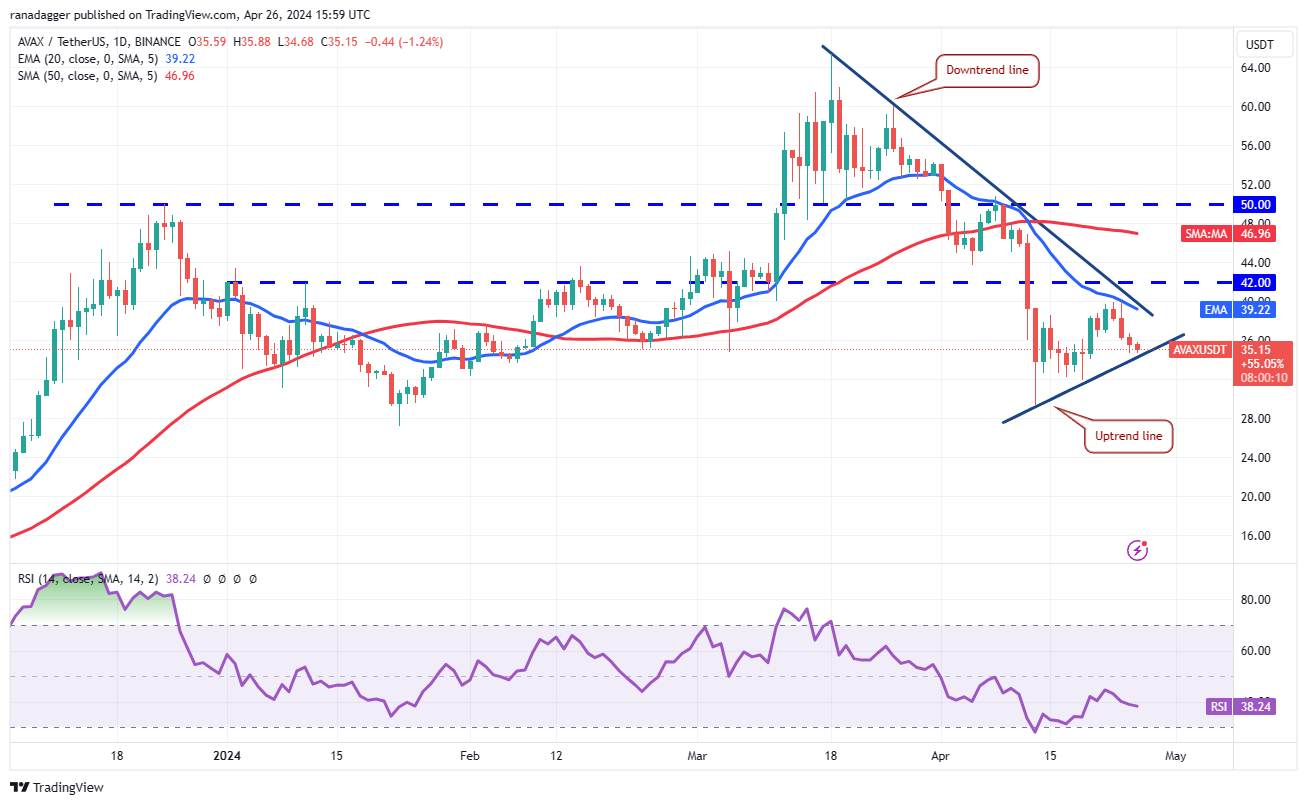
AVAX/USDT daily chart. Source: TradingView
AVAX/USDTの日足チャート。出典: TradingView
The bulls will have to push and maintain the price above the downtrend line to signal a potential short-term trend change. The AVAX/USDT pair could then attempt a rally toward the 50-day SMA ($47).
強気派は、短期的なトレンド変化の可能性を示すために、価格を下降トレンドラインよりも上に押し上げて維持する必要がある。 AVAX/USDTペアはその後、50日間SMA(47ドル)に向けて上昇を試みる可能性がある。
This optimistic view will be negated in the near term if the price continues lower and breaks below the uptrend line. That could sink the pair to the $32 to $27 support zone, where buyers are likely to step in.
価格が下落を続けて上昇トレンドラインを下抜けた場合、この楽観的な見方は短期的には打ち消されることになる。そうなると、ペアは32ドルから27ドルのサポートゾーンに沈む可能性があり、そこに買い手が介入する可能性が高い。
Shiba Inu price analysis
柴犬の価格分析
Shiba Inu (SHIB) has been stuck between the moving averages for the past few days, indicating indecision between the bulls and the bears.
柴犬(SHIB)はここ数日間、移動平均線の間に挟まれており、強気派と弱気派の間で優柔不断な状況が続いている。
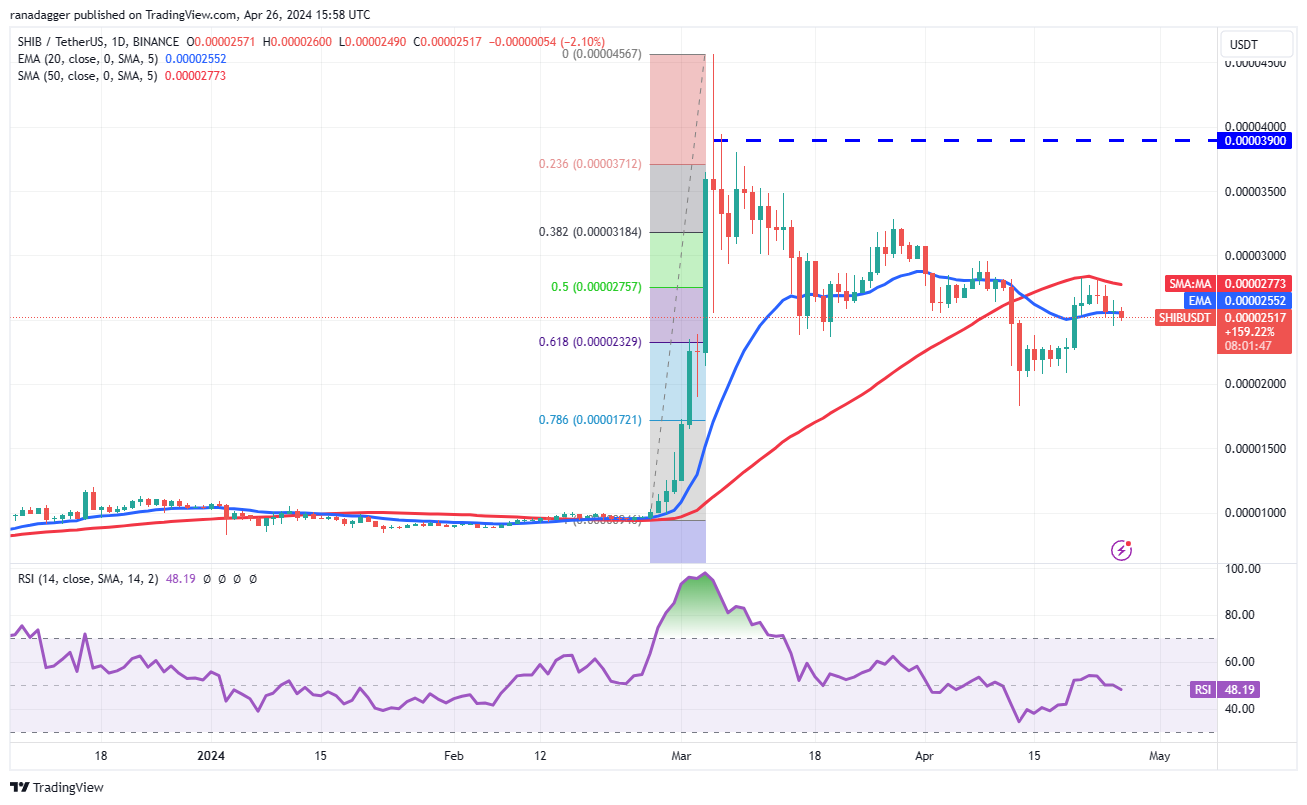
SHIB/USDT daily chart. Source: TradingView
SHIB/USDTの日足チャート。出典: TradingView
The flattish 20-day EMA ($0.000025) and the RSI near the midpoint do not give a clear advantage either to the bulls or the bears. If
平坦な20日間EMA(0.000025ドル)と中間点付近のRSIは、強気派にも弱気派にも明らかな優位性を与えていない。もし
 crypto.ro English
 DogeHome
 Crypto News Land
 ETHNews
 CFN
CFN U_Today
 Thecoinrepublic.com
 Optimisus


