Technical analysis plays a crucial role in the cryptocurrency market, especially for investors trading in the futures market. So, what does technical analysis suggest for Dogecoin, currently trading at $0.07678? Let’s examine the detailed chart analysis and important support and resistance levels.
El análisis técnico juega un papel crucial en el mercado de las criptomonedas, especialmente para los inversores que operan en el mercado de futuros. Entonces, ¿qué sugiere el análisis técnico para Dogecoin, que actualmente cotiza a 0,07678 dólares? Examinemos el análisis gráfico detallado y los importantes niveles de soporte y resistencia.
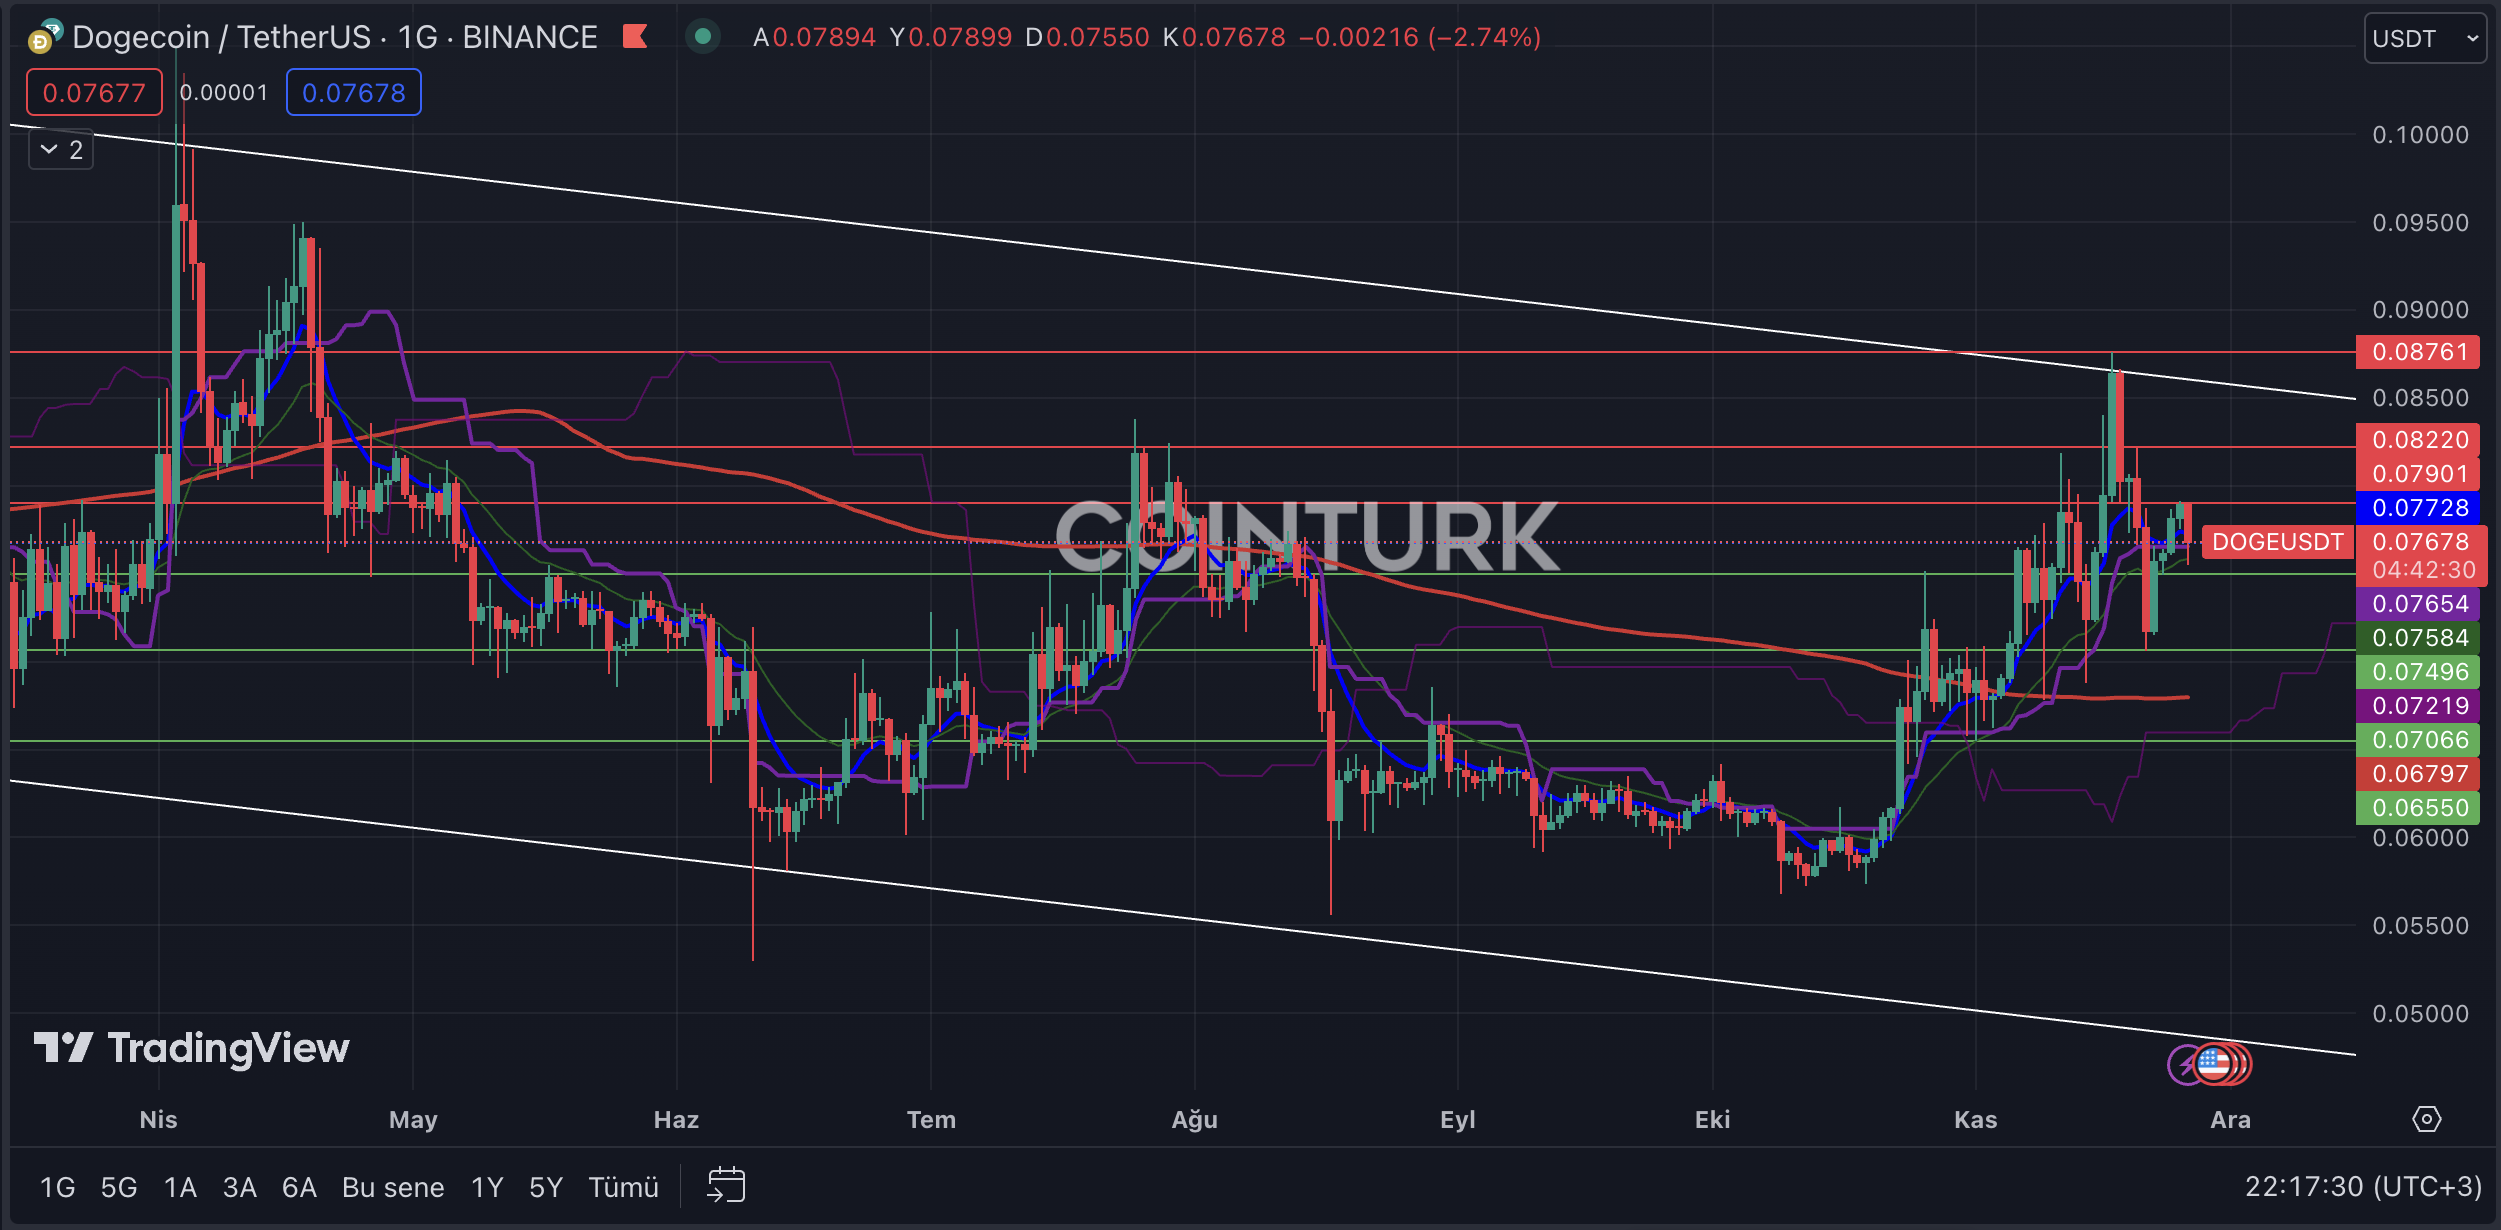
Daily Chart Analysis of Dogecoin
Análisis de gráficos diarios de Dogecoin
Dogecoin forms a notable descending channel pattern on the daily chart. During its recent attempt to rise, DOGE faced significant resistance, resulting in selling pressure as the channel worked as anticipated. The support or breakout in this narrow range will determine the short-term direction for DOGE. If the price remains below the EMA 7 (blue line) during this period, it may trigger a bearish scenario.
Dogecoin forma un patrón de canal descendente notable en el gráfico diario. Durante su reciente intento de subir, DOGE enfrentó una resistencia significativa, lo que generó presión de venta ya que el canal funcionó como se esperaba. El soporte o ruptura en este rango estrecho determinará la dirección a corto plazo de DOGE. Si el precio se mantiene por debajo de la EMA 7 (línea azul) durante este período, puede desencadenarse un escenario bajista.
The key support levels for DOGE on the daily chart are $0.07496, $0.07066, and $0.06550. A daily close below the crucial level of $0.07066, which played a significant role in the recent correction, would create selling pressure for DOGE.
Los niveles de soporte clave para DOGE en el gráfico diario son USD 0,07496, USD 0,07066 y USD 0,06550. Un cierre diario por debajo del nivel crucial de USD 0,07066, que jugó un papel importante en la reciente corrección, crearía presión de venta para DOGE.
The important resistance levels to watch for DOGE on the daily chart are $0.07901, $0.08220, and $0.08761. A daily close above the unbroken level of $0.08761, which was not surpassed during the recent uptrend, would trigger a breakout formation for DOGE and help regain bullish momentum.
Los niveles de resistencia importantes a tener en cuenta para DOGE en el gráfico diario son $ 0,07901, $ 0,08220 y $ 0,08761. Un cierre diario por encima del nivel ininterrumpido de USD 0,08761, que no fue superado durante la reciente tendencia alcista, desencadenaría una formación de ruptura para DOGE y ayudaría a recuperar el impulso alcista.

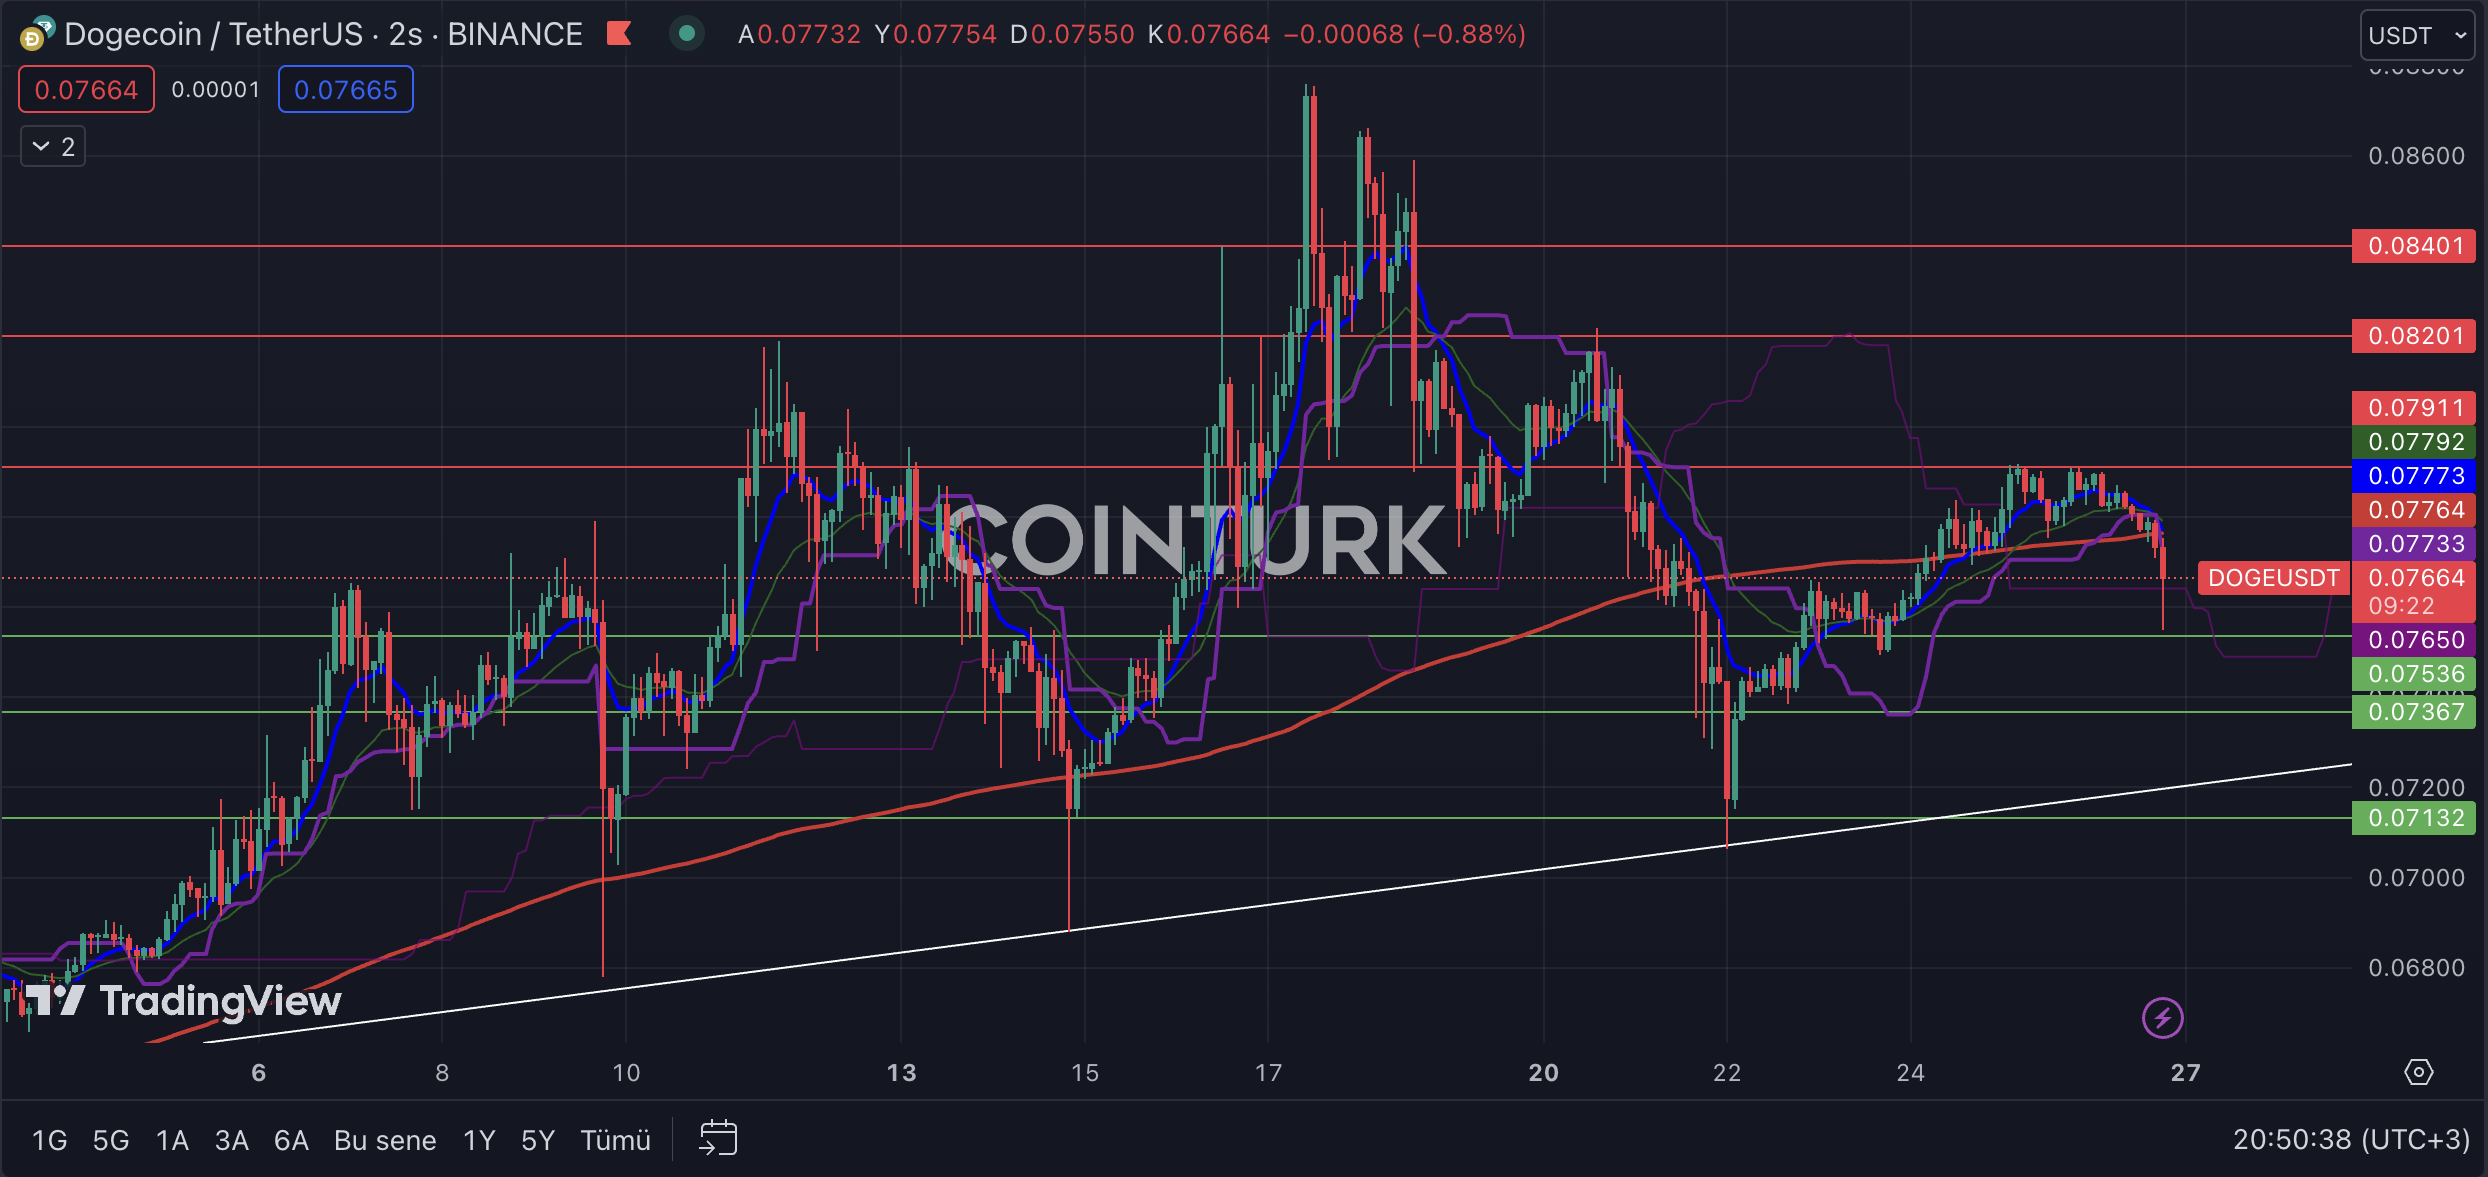
Two-Hour Chart Analysis of Dogecoin
Análisis gráfico de dos horas de Dogecoin
Dogecoin shows a significant formation of a support trendline on the two-hour chart. The presence and importance of this trendline during significant selling pressures at different times highlight its significance. Especially for investors trading in the futures market, monitoring this trendline will serve as a valuable compass.
Dogecoin muestra una formación significativa de una línea de tendencia de soporte en el gráfico de dos horas. La presencia y la importancia de esta línea de tendencia durante importantes presiones de venta en diferentes momentos resaltan su importancia. Especialmente para los inversores que operan en el mercado de futuros, el seguimiento de esta línea de tendencia les servirá como una valiosa brújula.
The key support levels to watch for DOGE on the two-hour chart are $0.07536, $0.07367, and $0.07132. A two-hour close below the level of $0.07132 would lead to a trend breakdown and a loss of momentum for DOGE.
Los niveles de soporte clave a tener en cuenta para DOGE en el gráfico de dos horas son USD 0,07536, USD 0,07367 y USD 0,07132. Un cierre de dos horas por debajo del nivel de USD 0,07132 provocaría una ruptura de la tendencia y una pérdida de impulso para DOGE.
The important resistance levels to watch for DOGE on the two-hour chart are $0.07911, $0.08201, and $0.08401. Particularly, a daily close above the significant barrier at $0.07911, which was not overcome during the recent uptrend, would enable DOGE to gain momentum.
Los niveles de resistencia importantes a tener en cuenta para DOGE en el gráfico de dos horas son USD 0,07911, USD 0,08201 y USD 0,08401. En particular, un cierre diario por encima de la importante barrera de 0,07911$, que no se superó durante la reciente tendencia alcista, permitiría a DOGE ganar impulso.

Continuar leyendo: https://en.coin-turk.com/technical-analysis-of-dogecoin-key-support-and-resistance-levels/


 DogeHome
 CryptoNewsLand
 Crypto Intelligence
 DogeHome
 CaptainAltcoin
 DogeHome
 DeFi Planet
 crypto.ro global
 crypto.ro global


