Technical analysis plays a crucial role in the cryptocurrency market, especially for investors trading in the futures market. So, what does technical analysis suggest for Dogecoin, currently trading at $0.07678? Let’s examine the detailed chart analysis and important support and resistance levels.
기술적 분석은 암호화폐 시장, 특히 선물 시장에서 거래하는 투자자에게 중요한 역할을 합니다. 그렇다면 현재 $0.07678에 거래되는 Dogecoin에 대한 기술적 분석은 무엇을 제안합니까? 자세한 차트 분석과 주요 지지 및 저항 수준을 살펴보겠습니다.
Daily Chart Analysis of Dogecoin
Dogecoin 일일 차트 분석
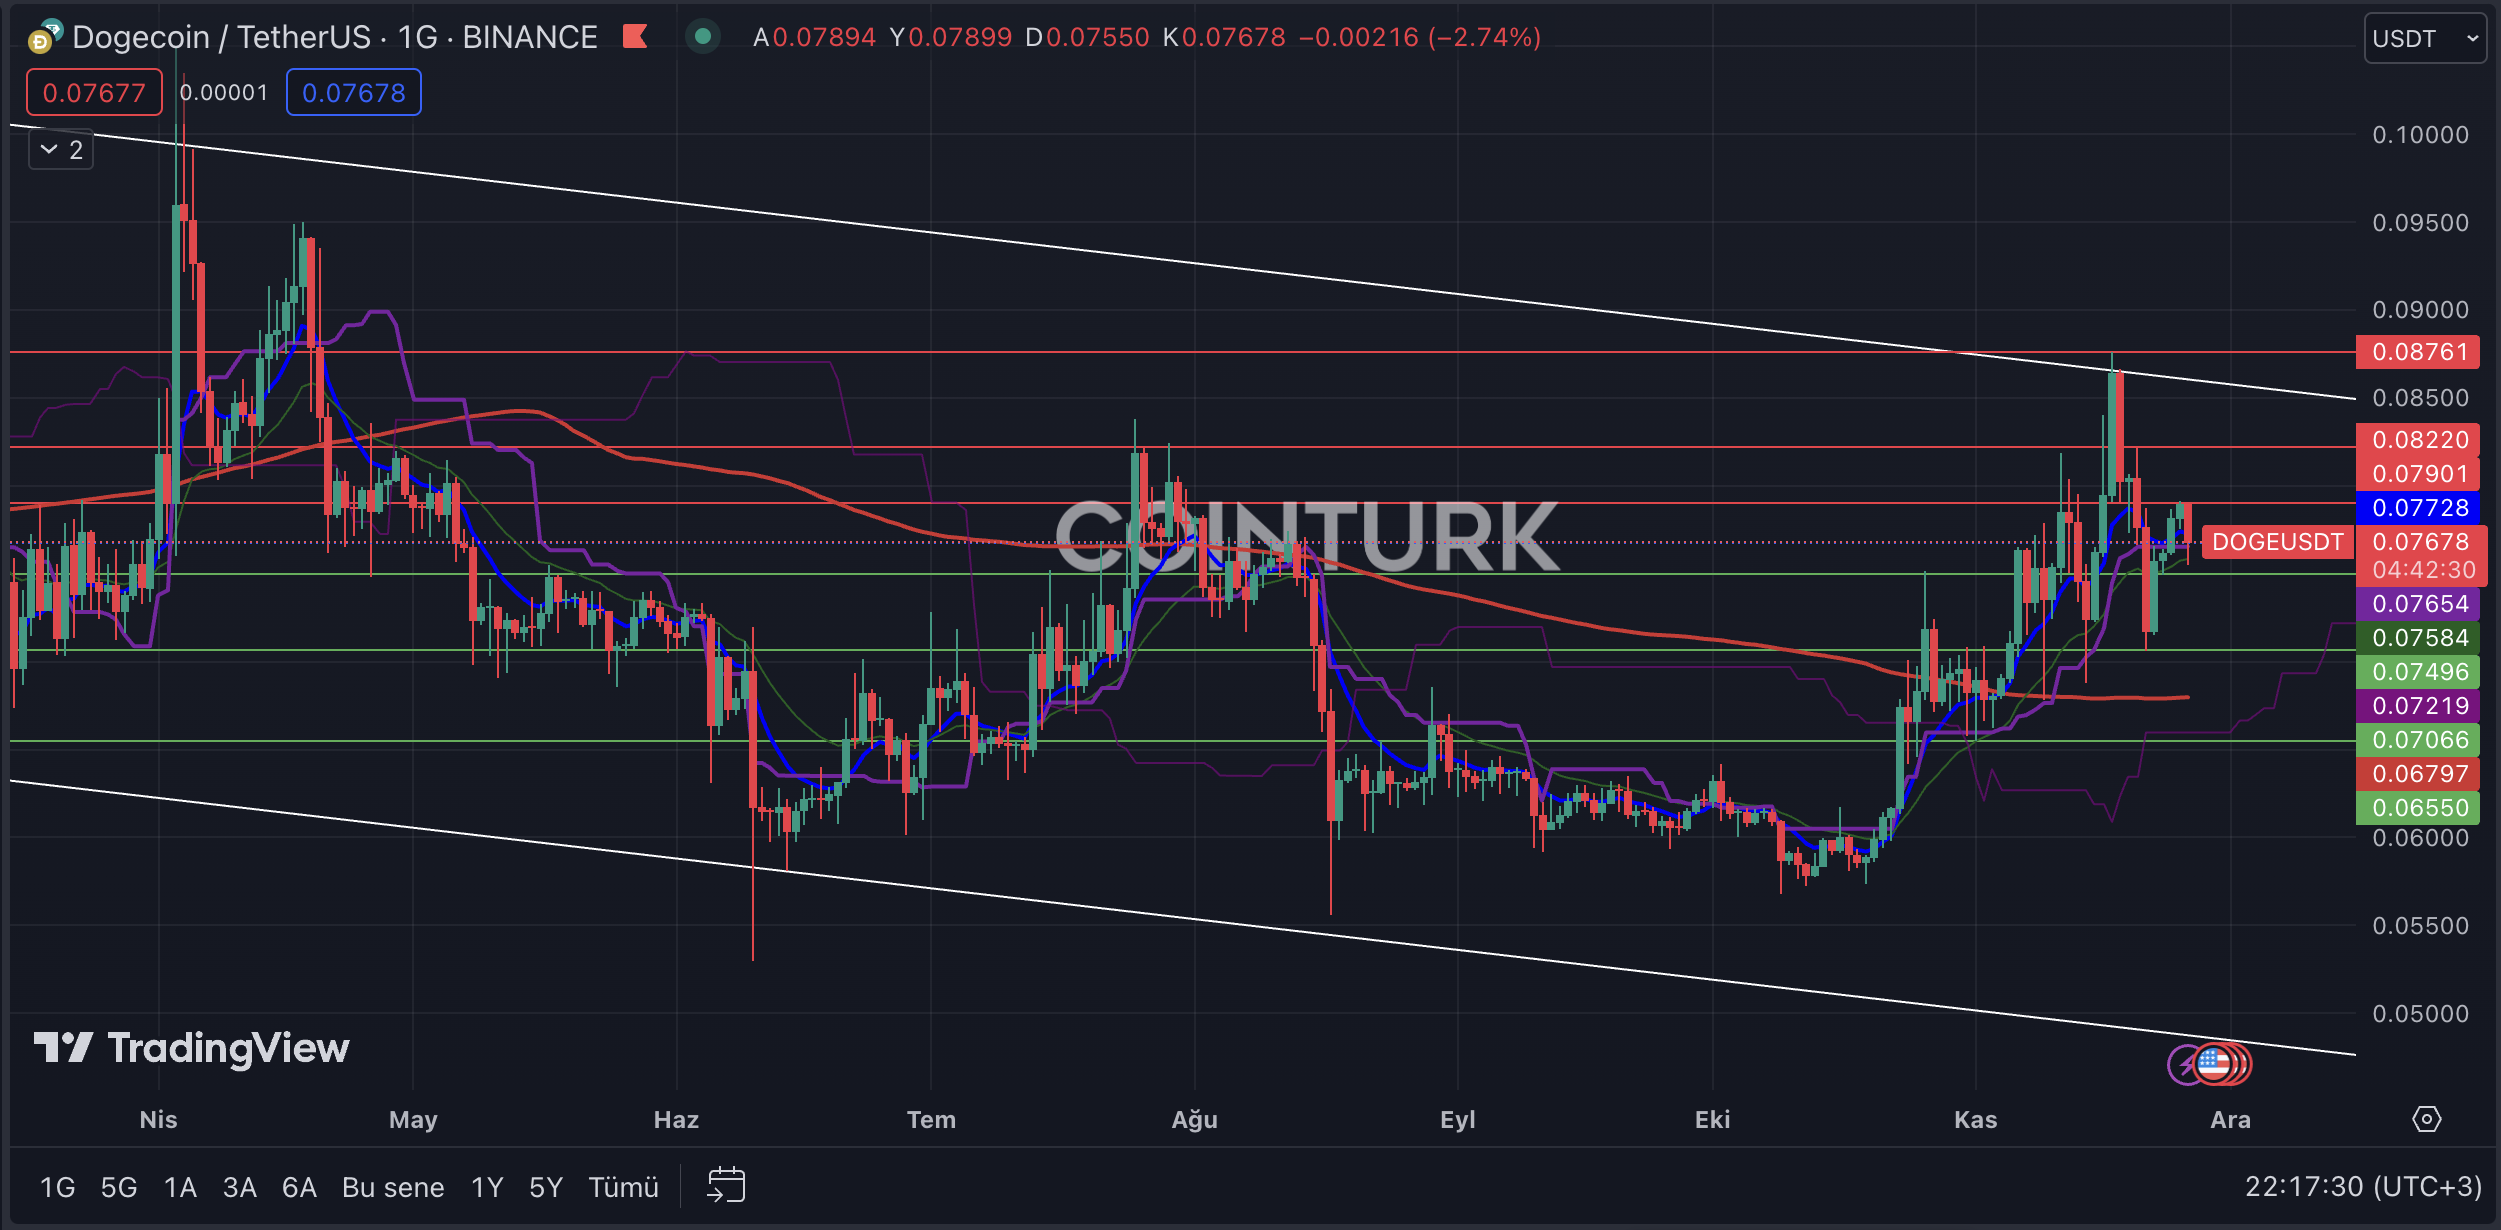
Dogecoin forms a notable descending channel pattern on the daily chart. During its recent attempt to rise, DOGE faced significant resistance, resulting in selling pressure as the channel worked as anticipated. The support or breakout in this narrow range will determine the short-term direction for DOGE. If the price remains below the EMA 7 (blue line) during this period, it may trigger a bearish scenario.
The key support levels for DOGE on the daily chart are $0.07496, $0.07066, and $0.06550. A daily close below the crucial level of $0.07066, which played a significant role in the recent correction, would create selling pressure for DOGE.
일일 차트에서 DOGE의 주요 지원 수준은 $0.07496, $0.07066, $0.06550입니다. 최근 조정에서 중요한 역할을 한 결정적인 수준인 $0.07066 아래로 일일 종가가 형성되면 DOGE에 매도 압력이 가해지게 됩니다.
The important resistance levels to watch for DOGE on the daily chart are $0.07901, $0.08220, and $0.08761. A daily close above the unbroken level of $0.08761, which was not surpassed during the recent uptrend, would trigger a breakout formation for DOGE and help regain bullish momentum.

Two-Hour Chart Analysis of Dogecoin
Dogecoin의 2시간 차트 분석
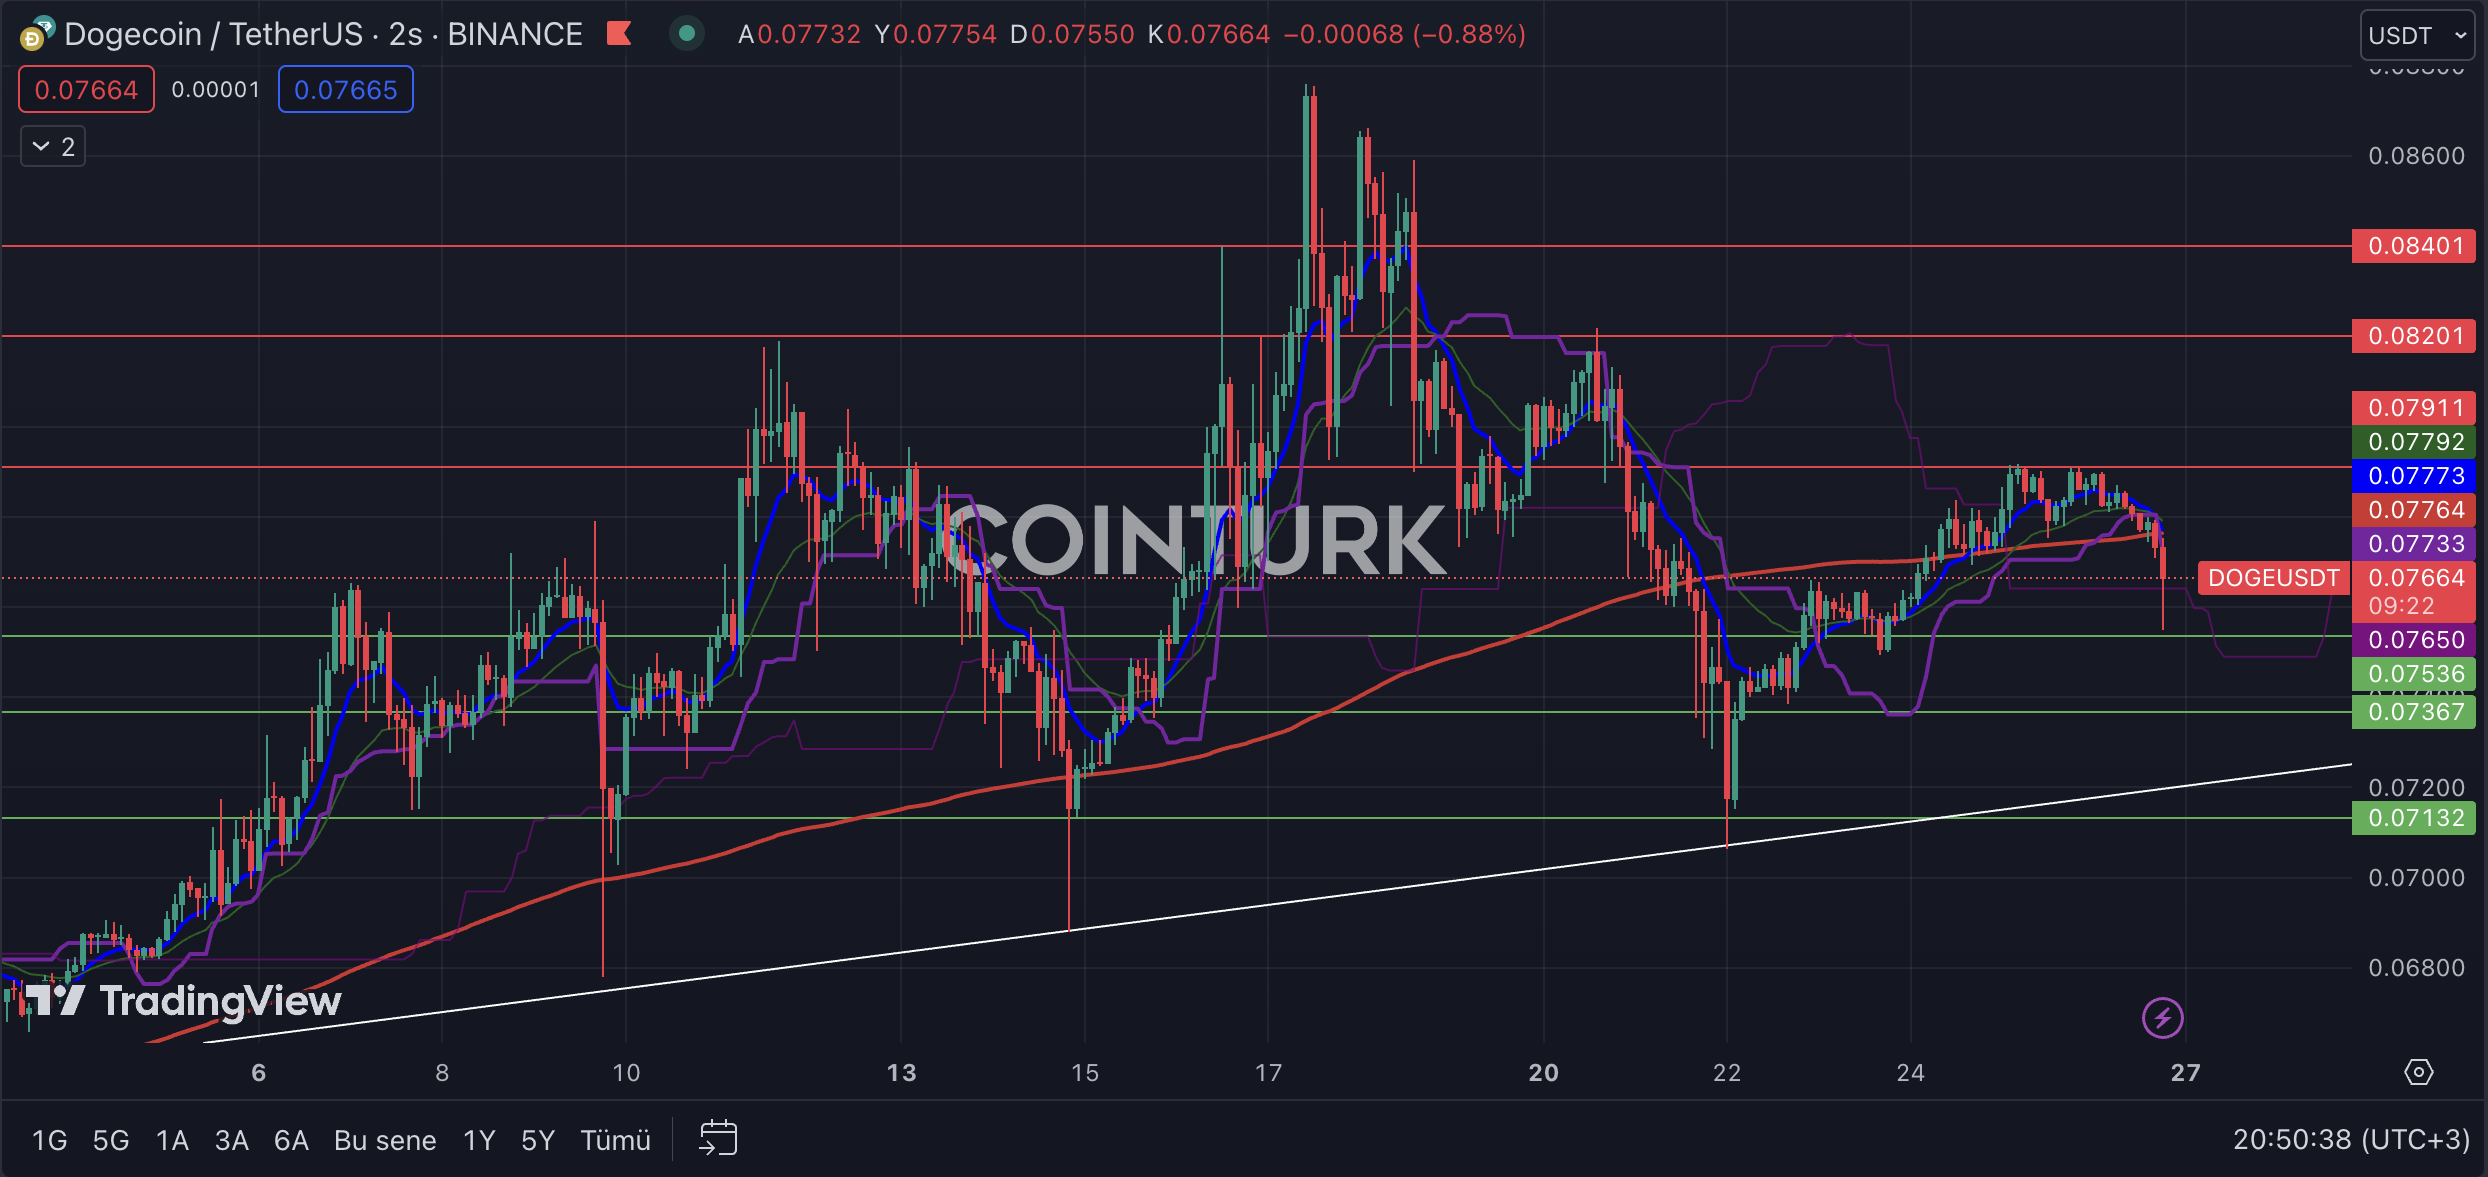
Dogecoin shows a significant formation of a support trendline on the two-hour chart. The presence and importance of this trendline during significant selling pressures at different times highlight its significance. Especially for investors trading in the futures market, monitoring this trendline will serve as a valuable compass.
The key support levels to watch for DOGE on the two-hour chart are $0.07536, $0.07367, and $0.07132. A two-hour close below the level of $0.07132 would lead to a trend breakdown and a loss of momentum for DOGE.
2시간 차트에서 DOGE를 관찰할 주요 지지 수준은 $0.07536, $0.07367, $0.07132입니다. $0.07132 수준 아래로 2시간 마감하면 추세 붕괴와 DOGE의 모멘텀 상실로 이어질 수 있습니다.
The important resistance levels to watch for DOGE on the two-hour chart are $0.07911, $0.08201, and $0.08401. Particularly, a daily close above the significant barrier at $0.07911, which was not overcome during the recent uptrend, would enable DOGE to gain momentum.

계속 읽기: https://en.coin-turk.com/technical-analytic-of-dogecoin-key-support-and-resistance-levels/


 TheCoinrise Media
 CoinPedia News
 DogeHome
 ETHNews
 Bitop Exchange
 CoinPedia News
 DogeHome
 ItsBitcoinWorld
 Cryptopolitan_News


