Technical analysis plays a crucial role in the cryptocurrency market, especially for investors trading in the futures market. So, what does technical analysis suggest for Dogecoin, currently trading at $0.07678? Let’s examine the detailed chart analysis and important support and resistance levels.
技术分析在加密货币市场中发挥着至关重要的作用,尤其是对于在期货市场交易的投资者而言。那么,技术分析对目前交易价格为 0.07678 美元的狗狗币有何建议?让我们来看看详细的图表分析以及重要的支撑位和阻力位。
Daily Chart Analysis of Dogecoin
狗狗币日线图分析
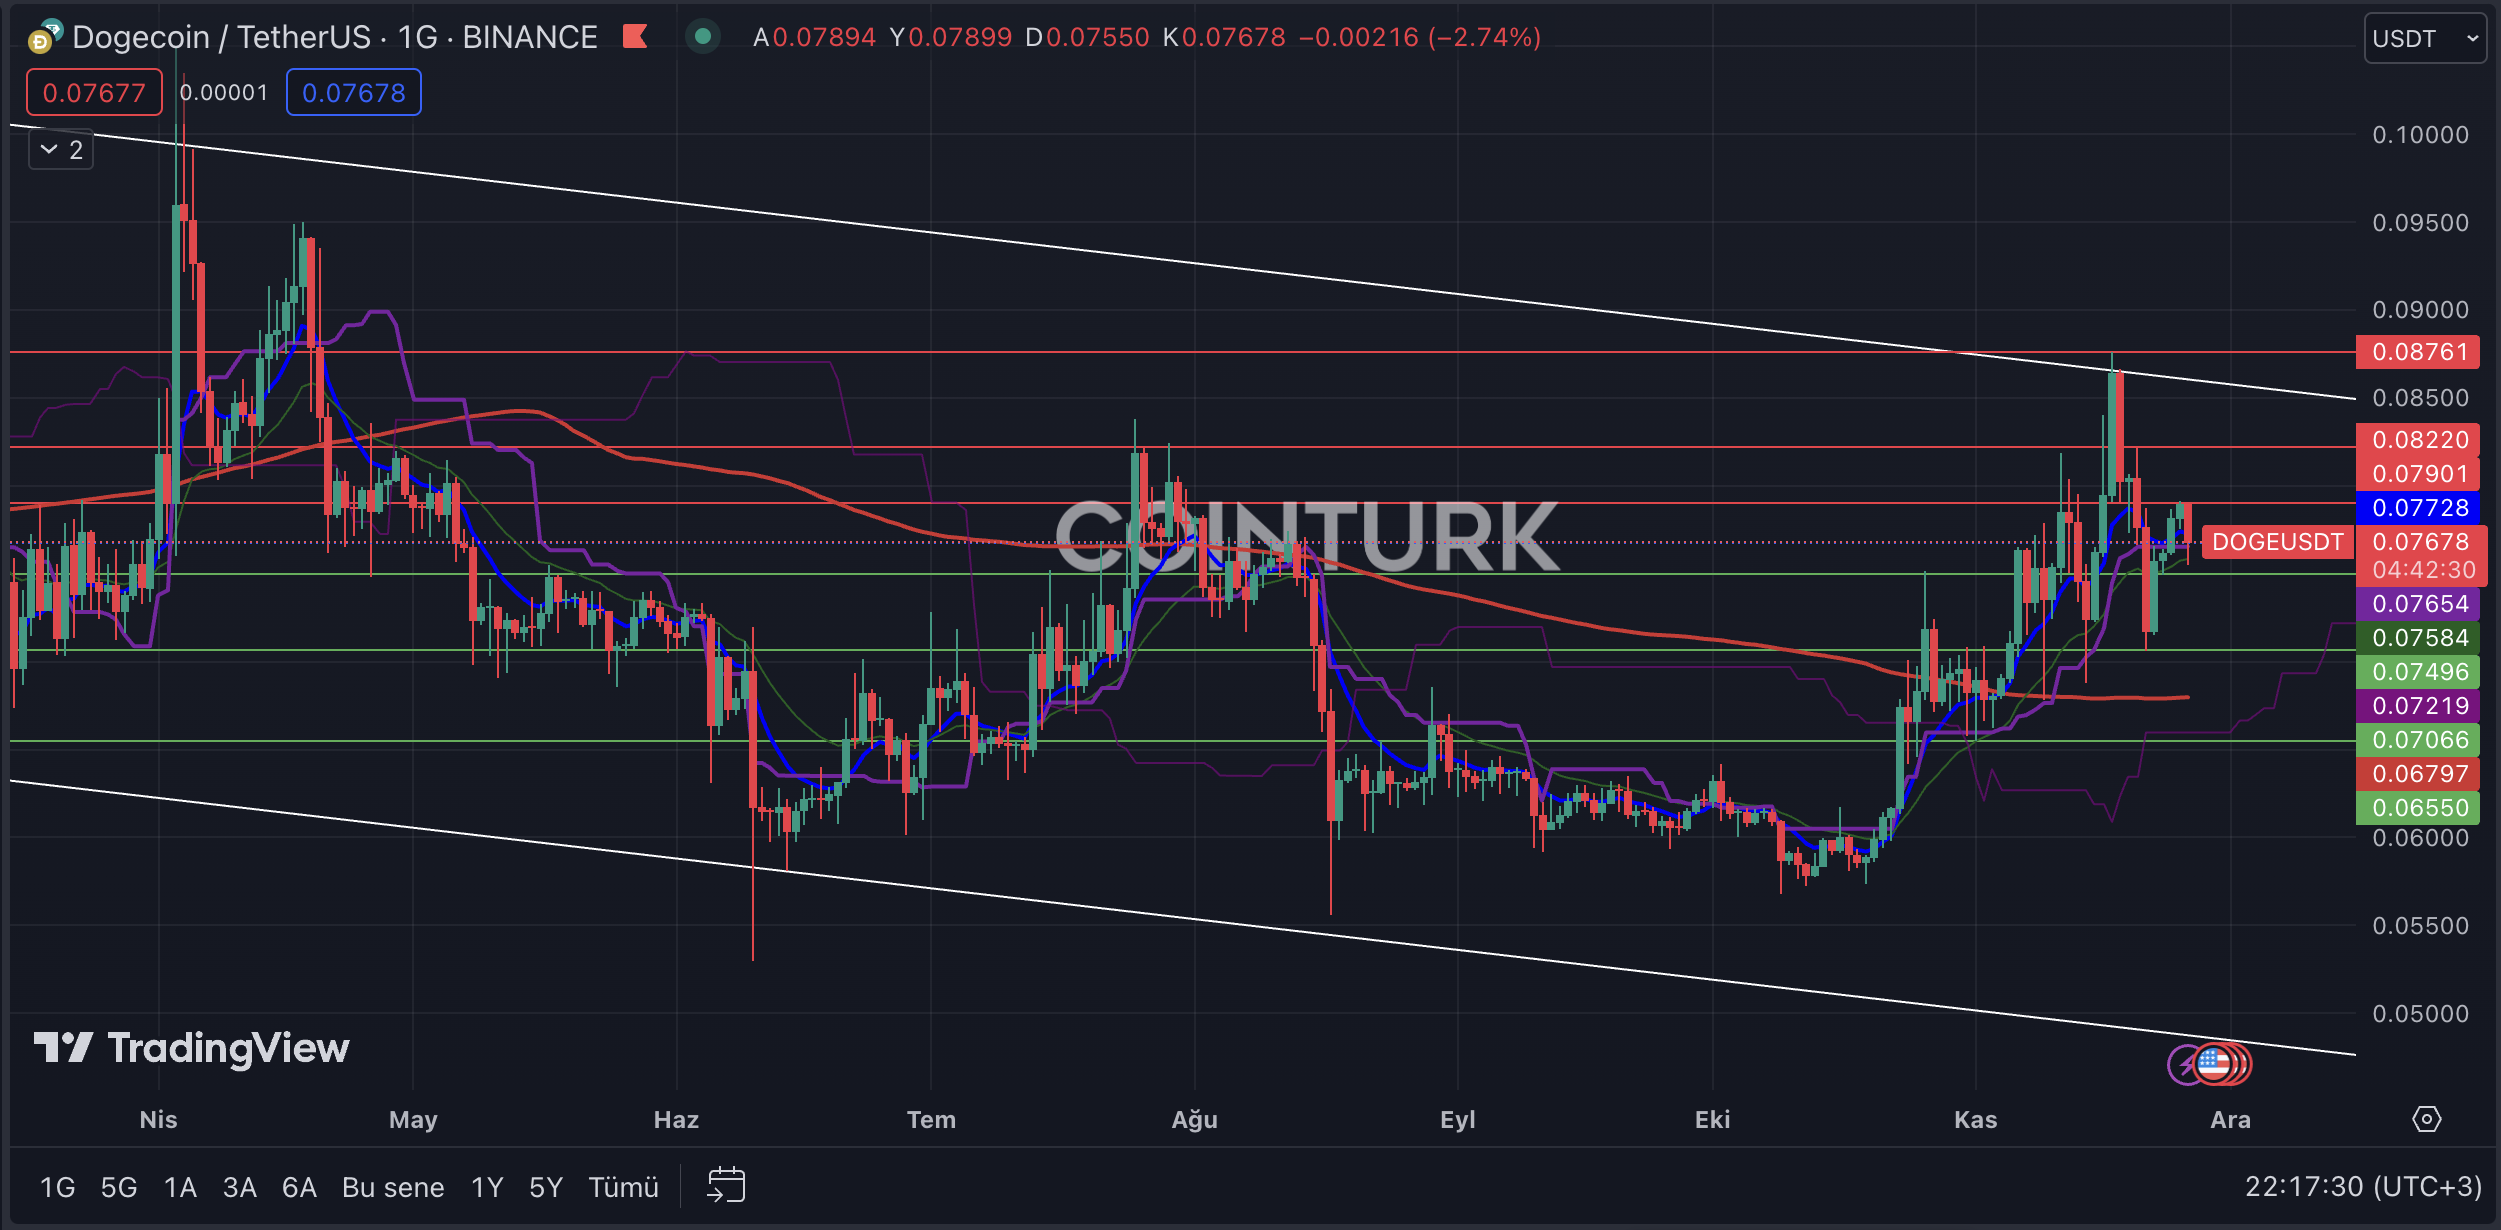
Dogecoin forms a notable descending channel pattern on the daily chart. During its recent attempt to rise, DOGE faced significant resistance, resulting in selling pressure as the channel worked as anticipated. The support or breakout in this narrow range will determine the short-term direction for DOGE. If the price remains below the EMA 7 (blue line) during this period, it may trigger a bearish scenario.
狗狗币在日线图上形成了显着的下降通道模式。在最近的上涨尝试中,DOGE 遇到了重大阻力,由于该通道如预期发挥作用,导致抛售压力。窄幅区间的支撑或突破将决定DOGE的短期方向。如果在此期间价格仍低于 7 EMA(蓝线),则可能会引发看跌情景。
The key support levels for DOGE on the daily chart are $0.07496, $0.07066, and $0.06550. A daily close below the crucial level of $0.07066, which played a significant role in the recent correction, would create selling pressure for DOGE.
DOGE 在日线图上的关键支撑位为 0.07496 美元、0.07066 美元和 0.06550 美元。每日收盘价低于 0.07066 美元的关键水平(该水平在最近的调整中发挥了重要作用)将为 DOGE 带来抛售压力。
The important resistance levels to watch for DOGE on the daily chart are $0.07901, $0.08220, and $0.08761. A daily close above the unbroken level of $0.08761, which was not surpassed during the recent uptrend, would trigger a breakout formation for DOGE and help regain bullish momentum.
日线图上需要关注的 DOGE 重要阻力位为 0.07901 美元、0.08220 美元和 0.08761 美元。每日收盘价高于 0.08761 美元的不间断水平(在最近的上升趋势中未突破该水平)将触发 DOGE 的突破形态,并有助于重新获得看涨势头。

Two-Hour Chart Analysis of Dogecoin
狗狗币两小时图分析
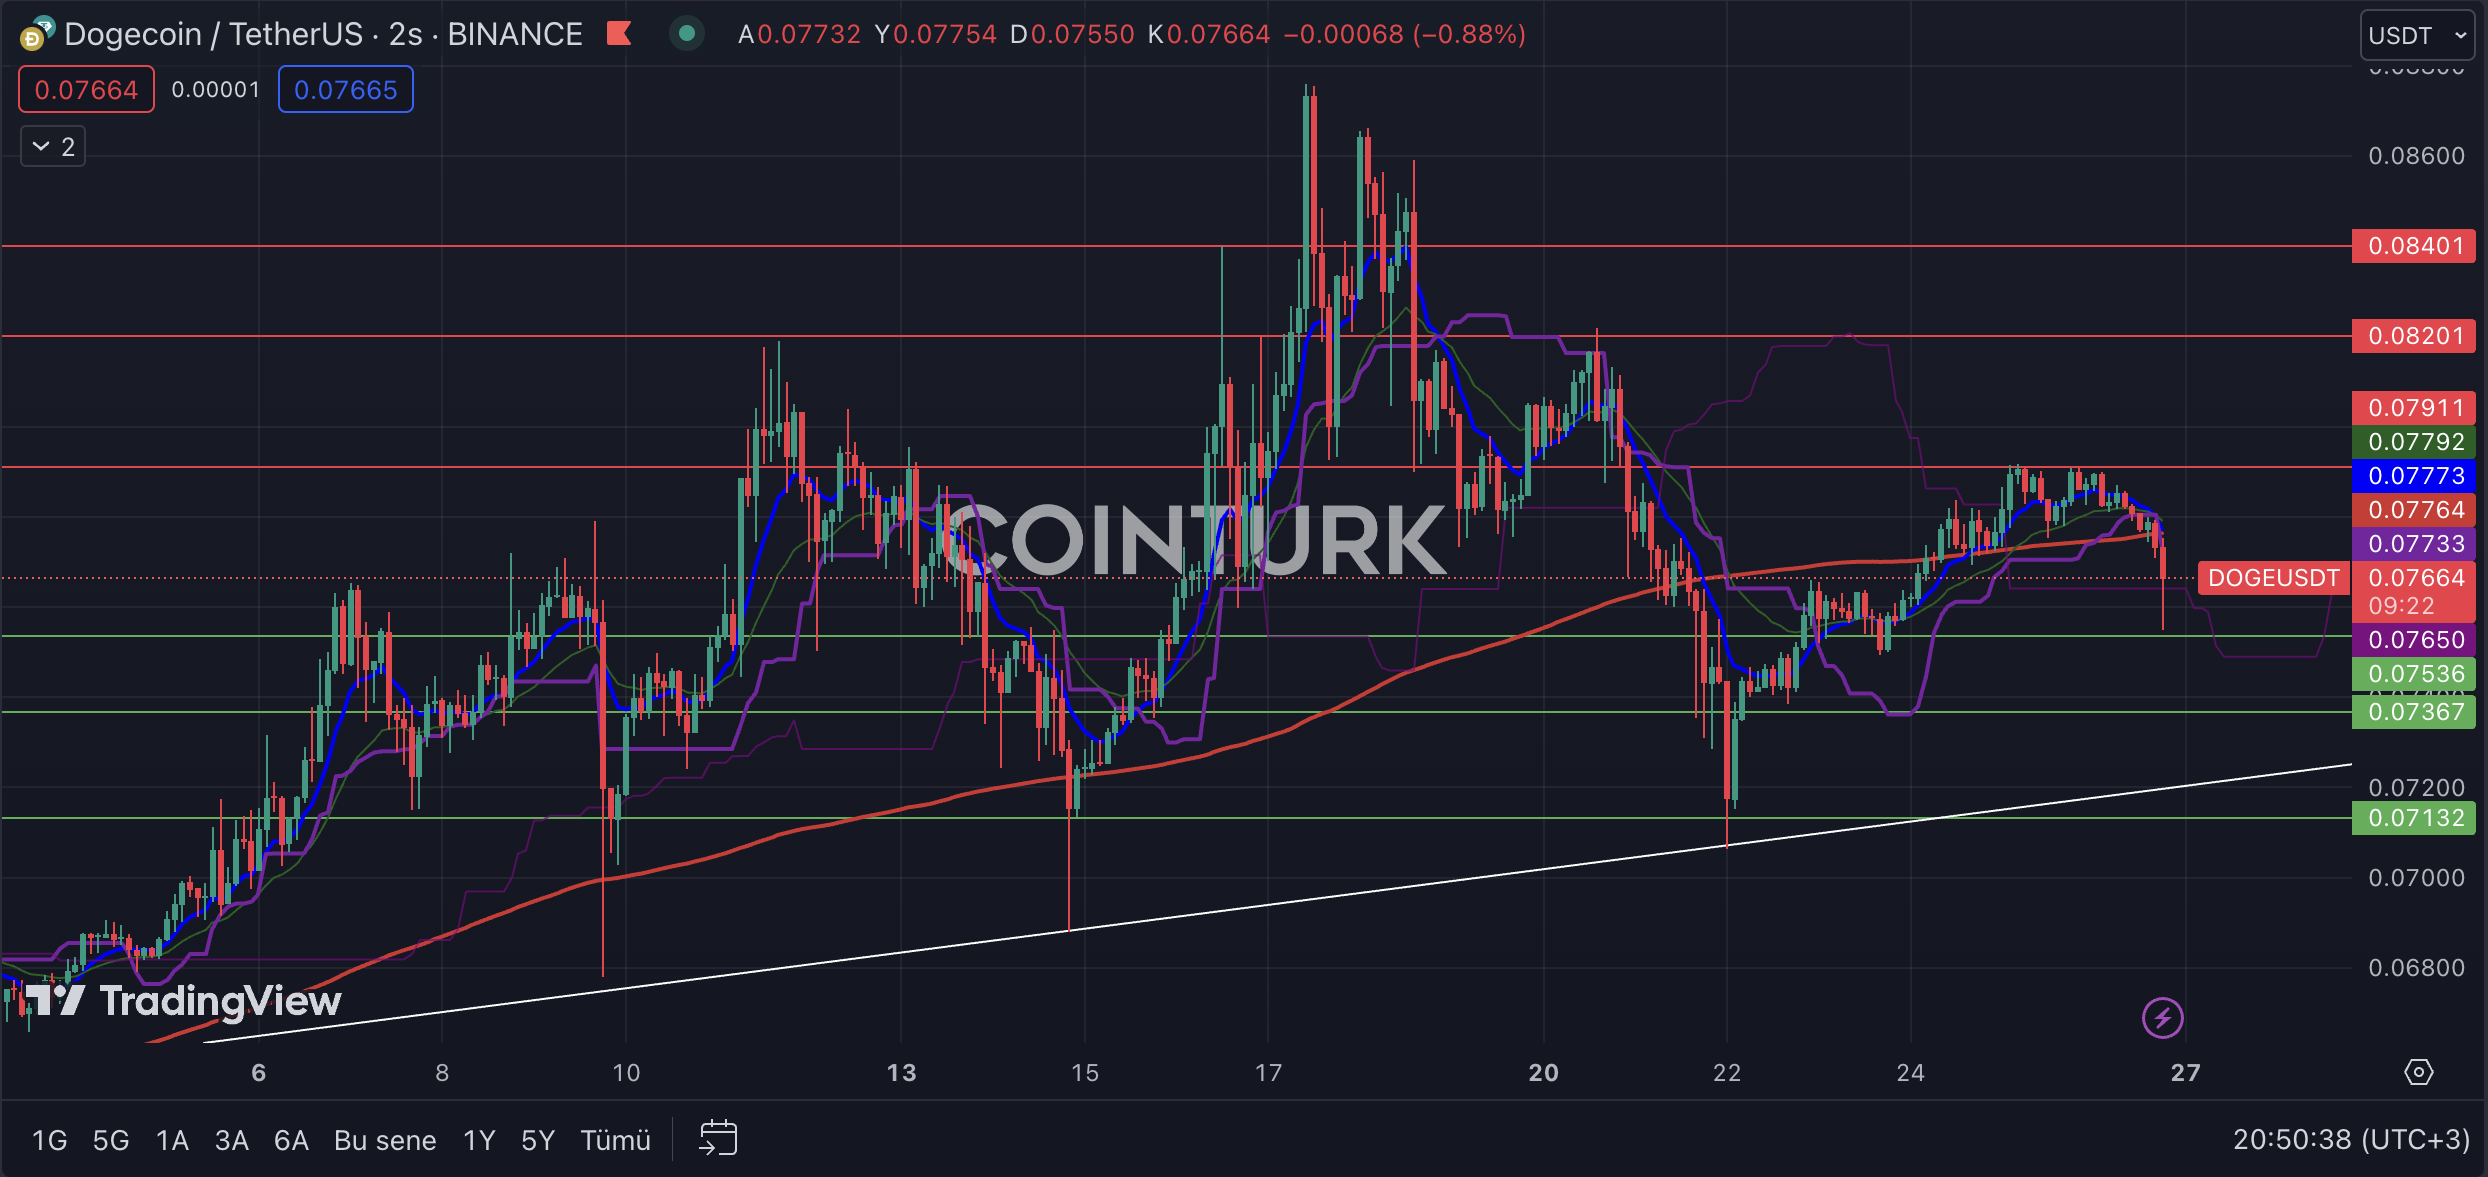
Dogecoin shows a significant formation of a support trendline on the two-hour chart. The presence and importance of this trendline during significant selling pressures at different times highlight its significance. Especially for investors trading in the futures market, monitoring this trendline will serve as a valuable compass.
狗狗币在两小时图表上显示出明显的支撑趋势线形成。该趋势线在不同时期的重大抛售压力期间的存在和重要性凸显了其重要性。特别是对于在期货市场交易的投资者来说,监控这条趋势线将成为一个有价值的指南针。
The key support levels to watch for DOGE on the two-hour chart are $0.07536, $0.07367, and $0.07132. A two-hour close below the level of $0.07132 would lead to a trend breakdown and a loss of momentum for DOGE.
两小时图表上需要关注的 DOGE 关键支撑位为 0.07536 美元、0.07367 美元和 0.07132 美元。两小时收盘价低于 0.07132 美元将导致趋势崩溃和 DOGE 失去动力。
The important resistance levels to watch for DOGE on the two-hour chart are $0.07911, $0.08201, and $0.08401. Particularly, a daily close above the significant barrier at $0.07911, which was not overcome during the recent uptrend, would enable DOGE to gain momentum.
两小时图表上需要关注的 DOGE 重要阻力位为 0.07911 美元、0.08201 美元和 0.08401 美元。特别是,每日收盘价高于 0.07911 美元的重要障碍(在最近的上升趋势中并未突破该障碍)将使 DOGE 获得动力。

继续阅读:https://en.coin-turk.com/technical-analysis-of-dogecoin-key-support-and-resistance-levels/


 Cryptopolitan_News
 CryptoNewsLand
 DogeHome
 CryptoNewsLand
 crypto.ro English
 CoinoMedia
 TheCoinrise


