Technical analysis plays a crucial role in the cryptocurrency market, especially for investors trading in the futures market. So, what does technical analysis suggest for Dogecoin, currently trading at $0.07678? Let’s examine the detailed chart analysis and important support and resistance levels.
テクニカル分析は、暗号通貨市場、特に先物市場で取引する投資家にとって重要な役割を果たします。それでは、現在0.07678ドルで取引されているドージコインについて、テクニカル分析は何を示唆しているのでしょうか?詳細なチャート分析と重要なサポートとレジスタンスのレベルを見てみましょう。
Daily Chart Analysis of Dogecoin
ドージコインの日足チャート分析
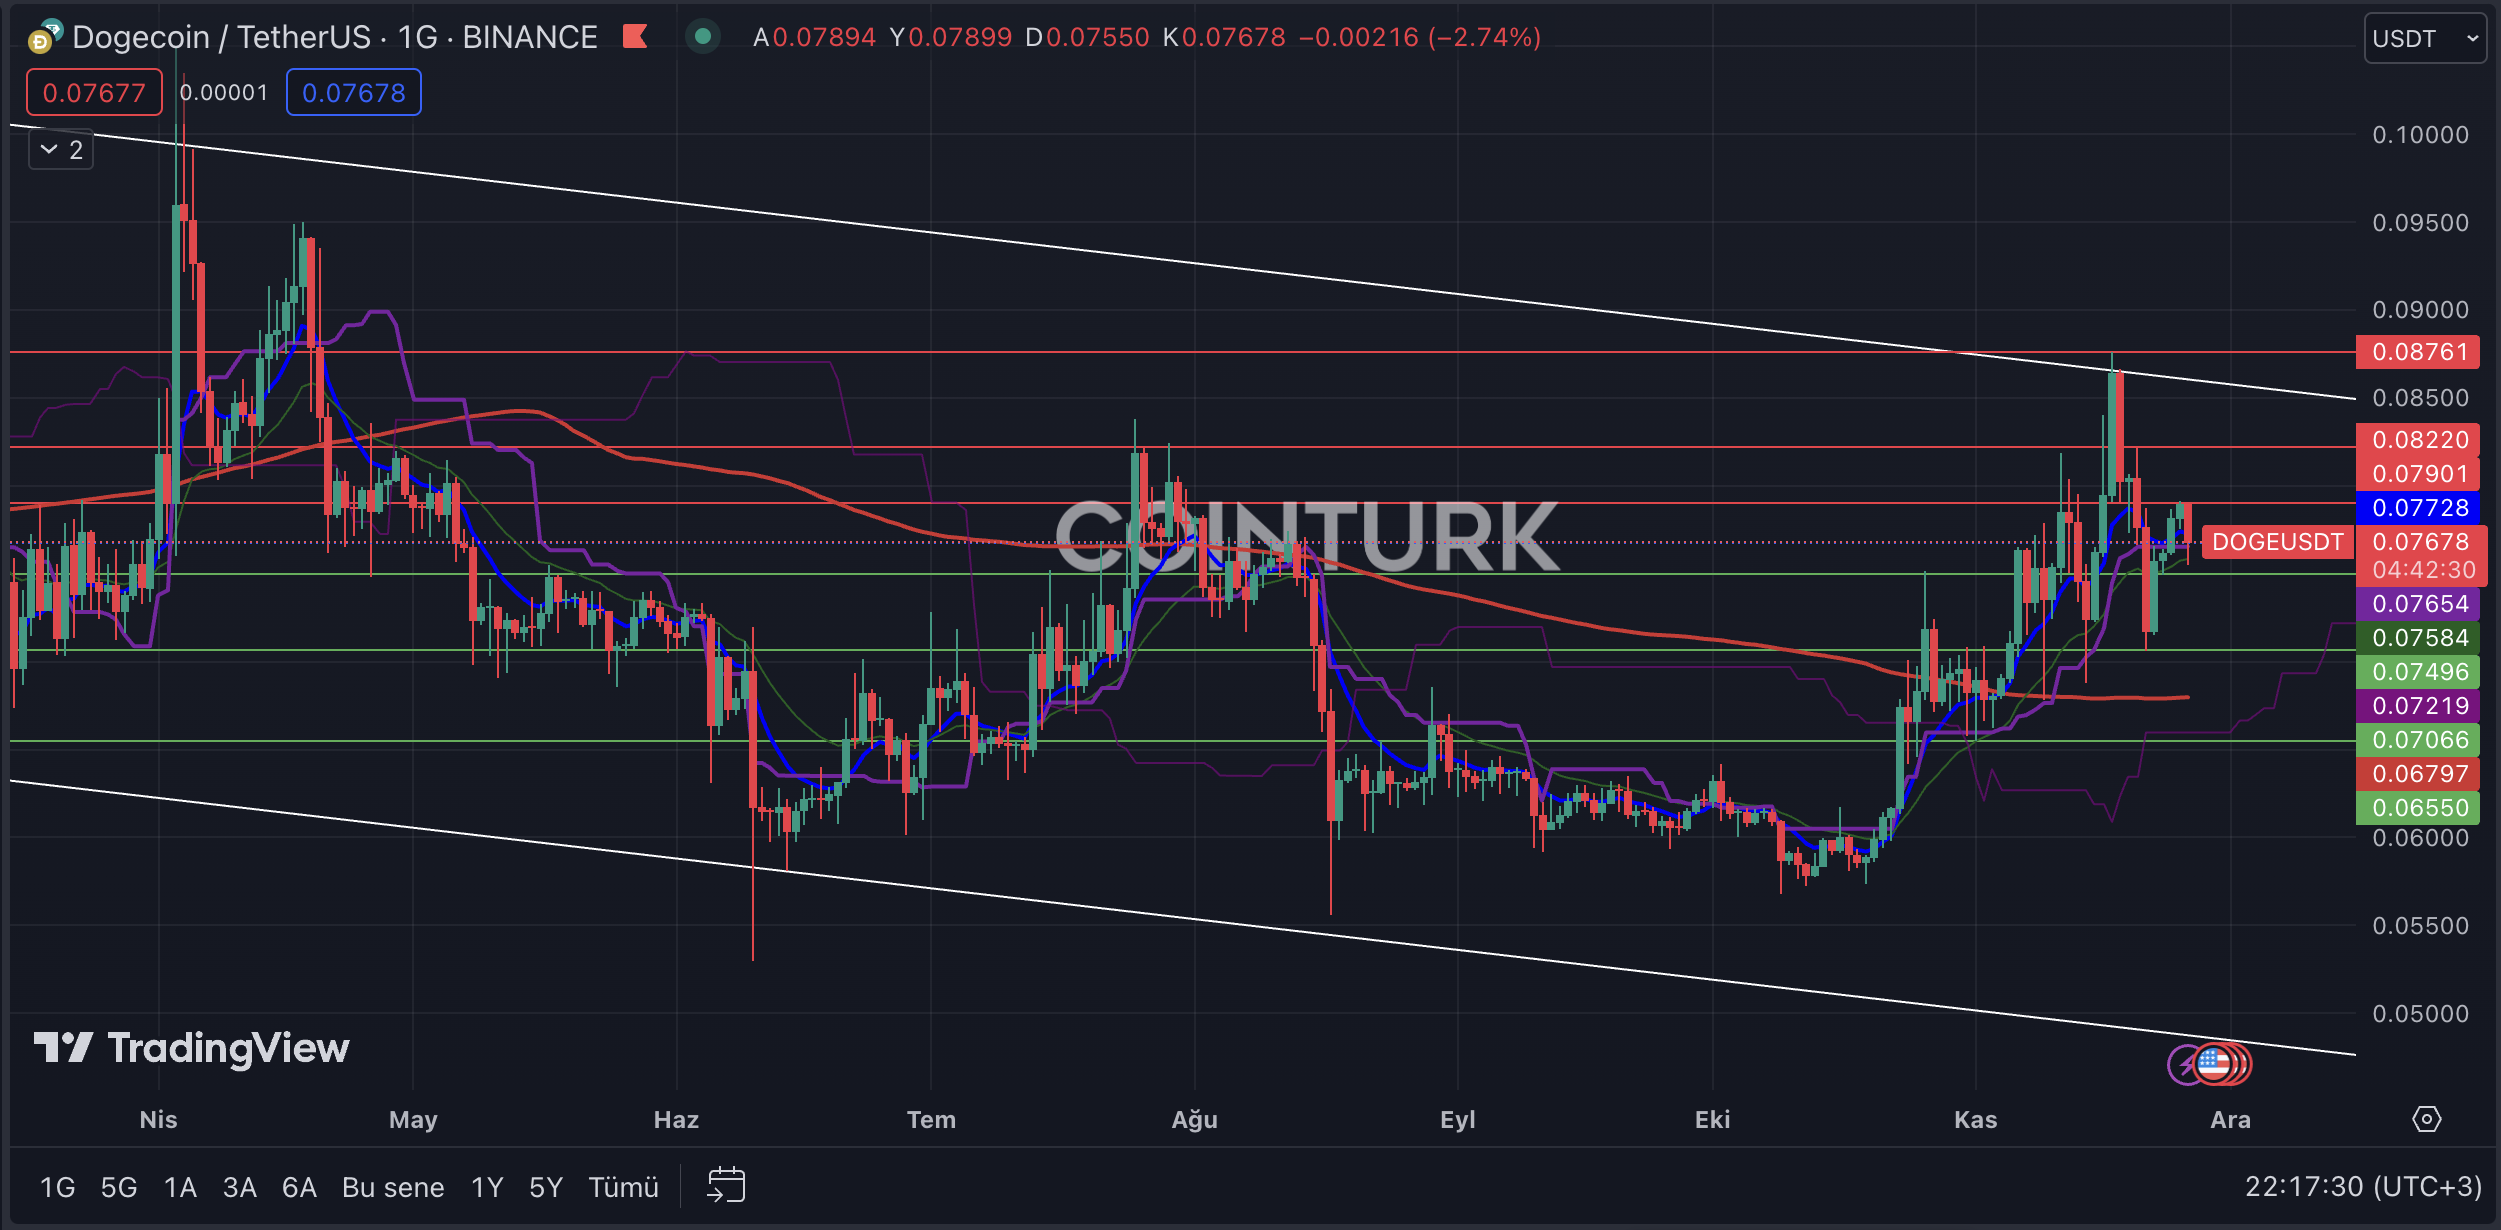
Dogecoin forms a notable descending channel pattern on the daily chart. During its recent attempt to rise, DOGE faced significant resistance, resulting in selling pressure as the channel worked as anticipated. The support or breakout in this narrow range will determine the short-term direction for DOGE. If the price remains below the EMA 7 (blue line) during this period, it may trigger a bearish scenario.
ドージコインは日足チャートで注目すべき下降チャネルパターンを形成しています。最近の上昇の試み中、DOGEは大きな抵抗に直面し、チャネルが予想通りに機能したため売り圧力が生じました。この狭いレンジでのサポートかブレイクアウトがDOGEの短期的な方向性を決定することになる。この期間中、価格が EMA 7 (青い線) を下回ったままであれば、弱気シナリオが引き起こされる可能性があります。
The key support levels for DOGE on the daily chart are $0.07496, $0.07066, and $0.06550. A daily close below the crucial level of $0.07066, which played a significant role in the recent correction, would create selling pressure for DOGE.
日足チャートにおけるDOGEの主なサポートレベルは0.07496ドル、0.07066ドル、0.06550ドルです。最近の調整に重要な役割を果たした重要な水準である0.07066ドルを下回る日次終値は、DOGEに対する売り圧力を生み出すことになるだろう。
The important resistance levels to watch for DOGE on the daily chart are $0.07901, $0.08220, and $0.08761. A daily close above the unbroken level of $0.08761, which was not surpassed during the recent uptrend, would trigger a breakout formation for DOGE and help regain bullish momentum.
日足チャートでDOGEに注目すべき重要な抵抗レベルは、0.07901ドル、0.08220ドル、0.08761ドルです。この日の終値が、最近の上昇トレンド中に超えられなかった途切れることのないレベルの0.08761ドルを上回れば、DOGEのブレイクアウト形成のきっかけとなり、強気の勢いを取り戻すのに役立つだろう。

Two-Hour Chart Analysis of Dogecoin
ドージコインの2時間チャート分析
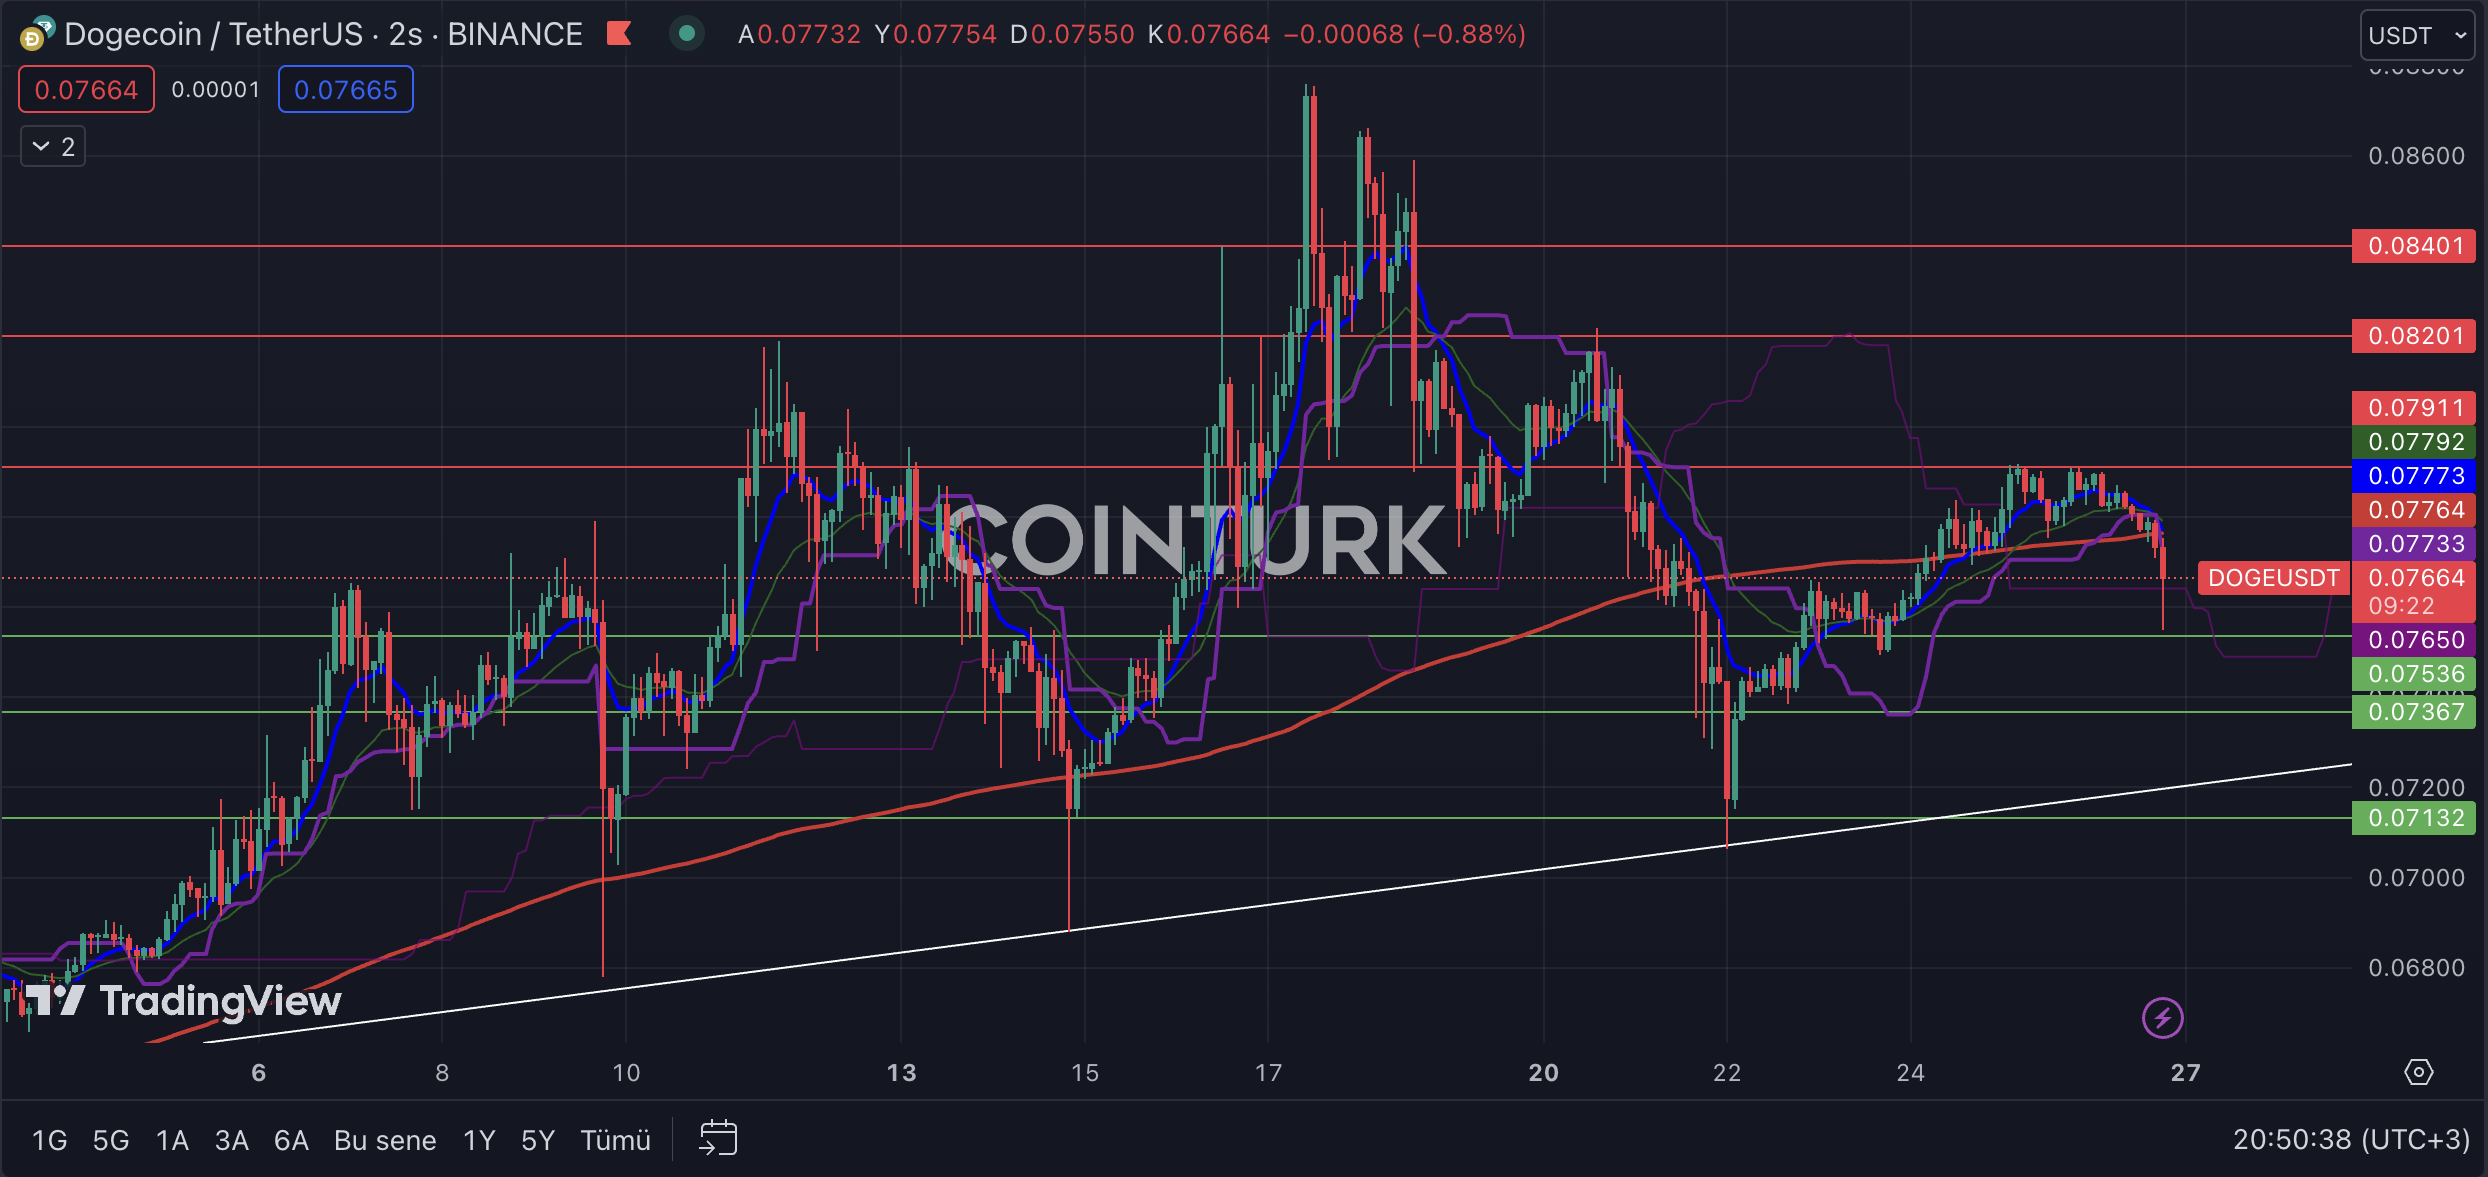
Dogecoin shows a significant formation of a support trendline on the two-hour chart. The presence and importance of this trendline during significant selling pressures at different times highlight its significance. Especially for investors trading in the futures market, monitoring this trendline will serve as a valuable compass.
ドージコインは、2時間足チャートでサポートトレンドラインの顕著な形成を示しています。さまざまな時期に大きな売り圧力がかかる中でのこのトレンドラインの存在と重要性は、その重要性を浮き彫りにします。特に先物市場で取引する投資家にとって、このトレンドラインを監視することは貴重な羅針盤として役立ちます。
The key support levels to watch for DOGE on the two-hour chart are $0.07536, $0.07367, and $0.07132. A two-hour close below the level of $0.07132 would lead to a trend breakdown and a loss of momentum for DOGE.
2時間足チャートでDOGEに注目すべき主要なサポートレベルは、0.07536ドル、0.07367ドル、0.07132ドルです。 2時間終値が0.07132ドルのレベルを下回ると、トレンドの崩壊とDOGEの勢いの喪失につながるだろう。
The important resistance levels to watch for DOGE on the two-hour chart are $0.07911, $0.08201, and $0.08401. Particularly, a daily close above the significant barrier at $0.07911, which was not overcome during the recent uptrend, would enable DOGE to gain momentum.
2時間足チャートでDOGEに注目すべき重要な抵抗レベルは、0.07911ドル、0.08201ドル、0.08401ドルです。特に、最近の上昇トレンド中に克服できなかった0.07911ドルの重要な障壁を超える日次終値は、DOGEが勢いを増すことを可能にするでしょう。

続きを読む: https://en.coin-turk.com/technical-analysis-of-dogecoin-key-support-and-resistance-levels/


 Optimisus
 Cryptopolitan_News
 DogeHome
 Cryptopolitan
 crypto.ro English
 Crypto News Land
 ETHNews


