

Weekly crypto price analysis reveals that most cryptocurrencies have been trading around the support levels, with bearish momentum dominating the market. Bitcoin and most major altcoins are plummeting, but the charts suggest a recovery could be around the corner. The BTC has dropped below $27k after a considerable sell-off.
El análisis semanal de precios de las criptomonedas revela que la mayoría de las criptomonedas se han estado negociando alrededor de los niveles de soporte, con un impulso bajista dominando el mercado. Bitcoin y la mayoría de las principales altcoins están cayendo en picado, pero los gráficos sugieren que una recuperación podría estar a la vuelta de la esquina. El BTC ha caído por debajo de los 27.000 dólares después de una liquidación considerable.
Ethereum (ETH) has been hit hard by the recent market downturn and is currently trading below $1,600. The selling pressure on ETH has been significant, but it has found support at this level. The BNB token, the native cryptocurrency of the Binance exchange, has also been affected by the market downturn and is trading below $210.
Ethereum (ETH) se ha visto muy afectado por la reciente caída del mercado y actualmente cotiza por debajo de los 1.600 dólares. La presión de venta sobre ETH ha sido significativa, pero ha encontrado soporte en este nivel. El token BNB, la criptomoneda nativa del intercambio Binance, también se ha visto afectado por la caída del mercado y se cotiza por debajo de los 210 dólares.
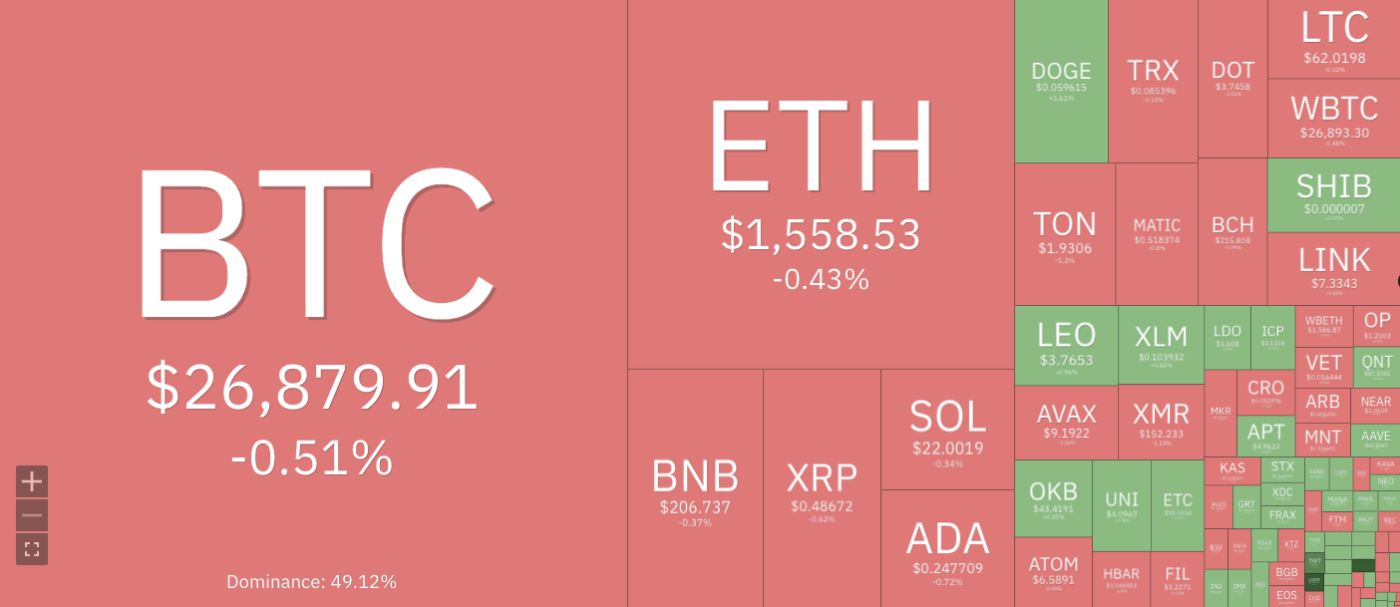
Cryptocurrencies Price Heatmap, Source: Coin360
Mapa de calor de precios de criptomonedas, fuente: Coin360
XRP, the fourth-largest cryptocurrency by market cap, has also been downward in the past few days, with bulls and bears fighting for control. Dogecoin (DOGE), the meme-inspired cryptocurrency, has also been experiencing a significant drop in its price, with a current value of around $0.0590 levels after bulls failed to maintain the $0.0650 resistance level. The Cardano (ADA) price has also steadily declined, breaking below the $0.300 support level and trading at around $0.2470.
XRP, la cuarta criptomoneda más grande por capitalización de mercado, también ha caído en los últimos días, con alcistas y bajistas luchando por el control. Dogecoin (DOGE), la criptomoneda inspirada en memes, también ha experimentado una caída significativa en su precio, con un valor actual de alrededor de $ 0,0590 después de que los alcistas no lograron mantener el nivel de resistencia de $ 0,0650. El precio de Cardano (ADA) también ha disminuido constantemente, rompiendo por debajo del nivel de soporte de $ 0,300 y cotizando en alrededor de $ 0,2470.
BTC/USD
BTC/USD
Bitcoin price analysis shows that BTC has been trading in a bearish trend since the start of the week, with some bullish momentum seen at the start of the week. However, this was short-lived, as bears returned to the market later in the week. The BTC/USD pair currently trades around $26,874, with a 24-hour surge of -4.35%. The overall market sentiment for BTC is still bearish, with the key resistance level observed at $28k and support at $25k.
El análisis de precios de Bitcoin muestra que BTC ha estado cotizando en una tendencia bajista desde el comienzo de la semana, con cierto impulso alcista al comienzo de la semana. Sin embargo, esto duró poco, ya que los bajistas regresaron al mercado a finales de semana. El par BTC/USD cotiza actualmente alrededor de $26.874, con un aumento de 24 horas del -4,35%. El sentimiento general del mercado para BTC sigue siendo bajista, con el nivel de resistencia clave observado en 28.000 dólares y el soporte en 25.000 dólares.
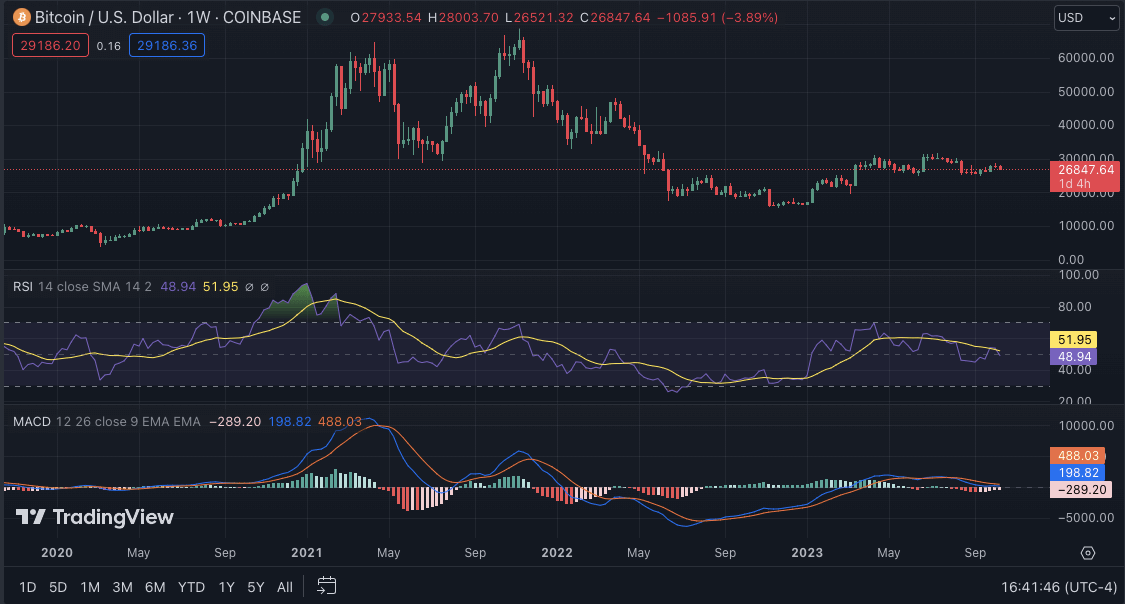
BTC/USD weekly chart, source: TradingView
Gráfico semanal BTC/USD, fuente: TradingView
BTC fell below the 20-EMA and the 50-EMA, indicating a strong bearish trend. The 50-EMA is also below the 200-EMA, with significant downward pressure. The MACD indicator indicates bearish divergence, with the MACD line remaining below the signal line. The Relative Strength Index (RSI) has also been trending down around the 40 levels, indicating a downward trend for BTC.
BTC cayó por debajo de 20-EMA y 50-EMA, lo que indica una fuerte tendencia bajista. La EMA 50 también está por debajo de la EMA 200, con una presión a la baja significativa. El indicador MACD indica una divergencia bajista, con la línea MACD permaneciendo por debajo de la línea de señal. El índice de fuerza relativa (RSI) también ha tenido una tendencia a la baja alrededor de los 40 niveles, lo que indica una tendencia a la baja para BTC.
ETH/USD
ETH/USD
Ethereum price analysis shows that ETH has been trading below its key support level of $1,600 for the past few days. The second-largest cryptocurrency by market cap currently trades at around $1,554 with a 24-hour surge of -0.78%. The bearish sentiment for ETH is still strong, with the key resistance level observed at $1,700 and support at $1,500. If bears continue to dominate, a further drop toward the $1,400 level could be seen; however, if bulls manage to take control, ETH could see a push toward the $1,800 level.
El análisis de precios de Ethereum muestra que ETH ha estado cotizando por debajo de su nivel de soporte clave de $1,600 durante los últimos días. La segunda criptomoneda más grande por capitalización de mercado cotiza actualmente en alrededor de $1,554 con un aumento de 24 horas del -0,78%. El sentimiento bajista para ETH sigue siendo fuerte, con el nivel de resistencia clave observado en $1,700 y el soporte en $1,500. Si los bajistas continúan dominando, se podría ver una nueva caída hacia el nivel de 1.400 dólares; sin embargo, si los alcistas logran tomar el control, ETH podría ver un impulso hacia el nivel de $ 1,800.
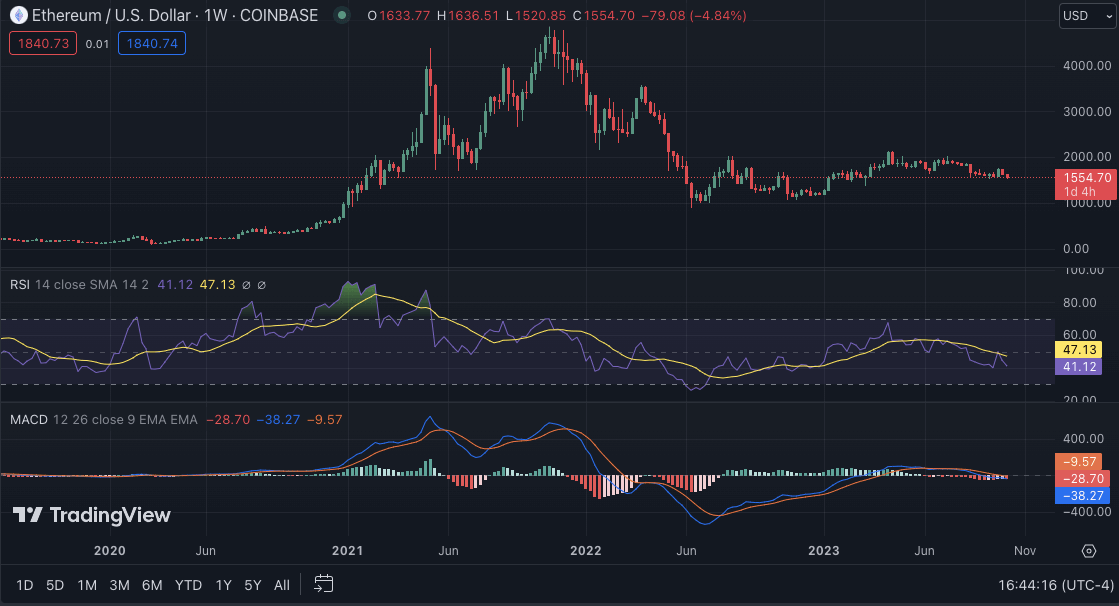
ETH/USD weekly chart, source: TradingView
Gráfico semanal de ETH/USD, fuente: TradingView
The MACD indicator shows bearish momentum as it has formed a negative crossover. The RSI is currently hovering near 40, suggesting that bears are slowly gaining market control. The 50-weekly MA is below the 200-weekly MA, indicating that the price will likely remain bearish soon. The moving averages have been in neutral territory, meaning ETH could consolidate before making its next move.
El indicador MACD muestra un impulso bajista ya que ha formado un cruce negativo. El RSI actualmente ronda los 40, lo que sugiere que los bajistas están ganando lentamente el control del mercado. El MA de 50 semanas está por debajo del MA de 200 semanas, lo que indica que el precio probablemente seguirá siendo bajista pronto. Los promedios móviles han estado en territorio neutral, lo que significa que ETH podría consolidarse antes de realizar su siguiente movimiento.
BNB/USD
BNB/USD
The weekly price analysis for Binance Coin (BNB) reveals that bears have controlled the market for the past few days. On October 08, BNB broke and closed below the symmetrical triangle pattern, signifying that bears prevailed over bulls. The selling pressure increased on October 12, and the BNB/USD pair fell below the crucial $205 support level. At the time of writing, BNB is trading at $206, with a minimal surge of 0.58% in the past 24 hours; however, in the past seven days, BNB has recorded a -2.56% loss. The market sentiment for BNB is still bearish, with the key resistance level observed at $235 and support at $200.
El análisis de precios semanal de Binance Coin (BNB) revela que los bajistas han controlado el mercado durante los últimos días. El 8 de octubre, BNB rompió y cerró por debajo del patrón de triángulo simétrico, lo que significa que los bajistas prevalecieron sobre los alcistas. La presión de venta aumentó el 12 de octubre y el par BNB/USD cayó por debajo del nivel de soporte crucial de $ 205. En el momento de escribir este artículo, BNB cotiza a 206 dólares, con un aumento mínimo del 0,58% en las últimas 24 horas; sin embargo, en los últimos siete días, BNB registró una pérdida del -2,56%. El sentimiento del mercado para BNB sigue siendo bajista, con el nivel de resistencia clave observado en 235 dólares y el soporte en 200 dólares.
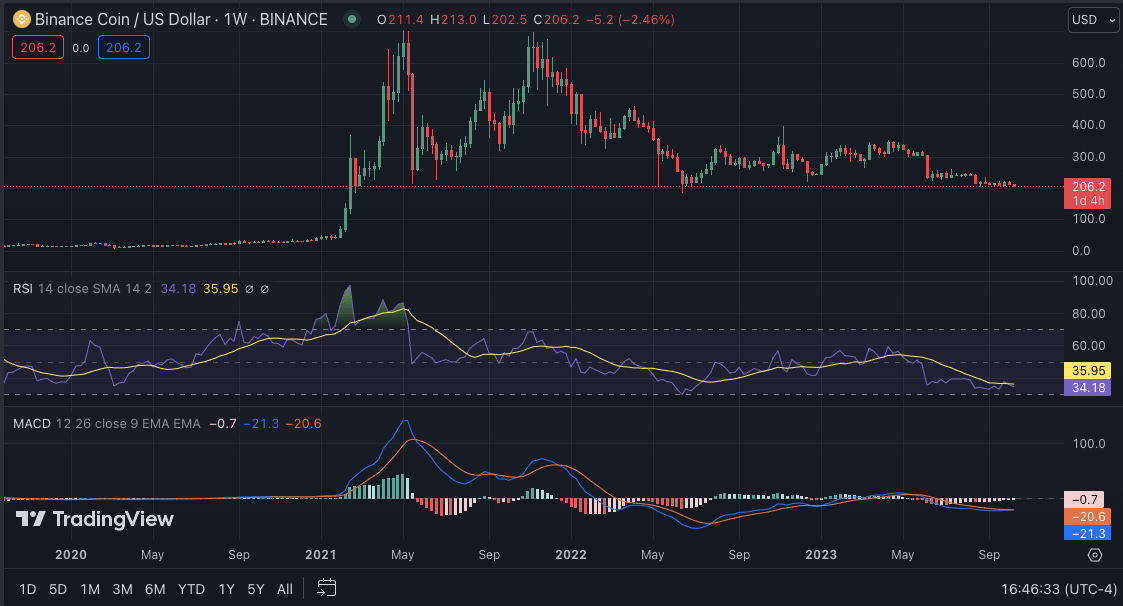
BNB/USD weekly chart, source: TradingView
Gráfico semanal BNB/USD, fuente: TradingView
The MACD and signal lines have crossed over in a bearish divergence, indicating that bears dominate the market and could continue to push the price down soon. The RSI is also currently trending in the bearish zone, suggesting that BNB could see further losses before a bullish trend emerges.
El MACD y las líneas de señal se han cruzado en una divergencia bajista, lo que indica que los bajistas dominan el mercado y podrían continuar haciendo bajar el precio pronto. El RSI también tiene actualmente una tendencia bajista, lo que sugiere que BNB podría sufrir más pérdidas antes de que surja una tendencia alcista.
XRP/USD
XRP/USD
XRP price analysis shows that bears have controlled the market for most of the week, pushing the price to record lows. In the past seven days, XRP has seen a -6.70% loss in its value and is currently trading at $0.4864, with a 24-hour surge of -0.61%. After the SEC’s lawsuit against Ripple, the market sentiment for XRP has been bearish, with the key resistance level observed at $0.550 and support at $0.450. The price of XRP is currently below the 200-EMA, indicating a strong bearish trend in the near future.
El análisis de precios de XRP muestra que los bajistas han controlado el mercado durante la mayor parte de la semana, llevando el precio a mínimos históricos. En los últimos siete días, XRP ha experimentado una pérdida de valor del -6,70% y actualmente cotiza a 0,4864 dólares, con un aumento de 24 horas del -0,61%. Después de la demanda de la SEC contra Ripple, el sentimiento del mercado hacia XRP ha sido bajista, con el nivel de resistencia clave observado en $0,550 y el soporte en $0,450. El precio de XRP se encuentra actualmente por debajo de la 200-EMA, lo que indica una fuerte tendencia bajista en el futuro cercano.
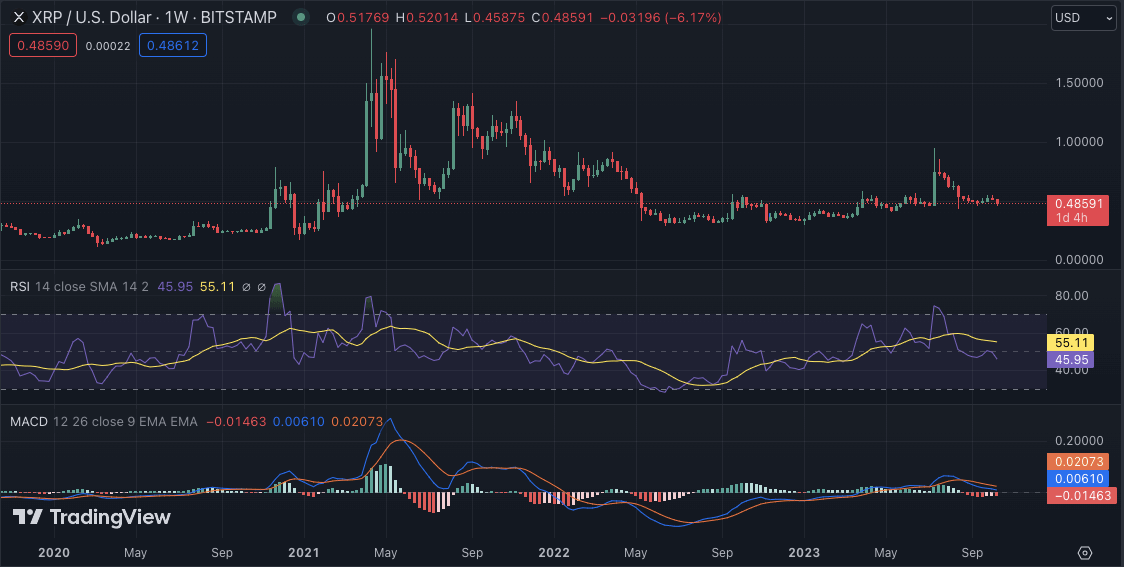
XRP/USD weekly chart, source: TradingView
Gráfico semanal de XRP/USD, fuente: TradingView
The MACD indicator also shows that bears dominate, as the MACD line is below the signal line. The RSI has been trending down and is currently hovering around 40, which indicates a bearish trend for XRP. The 20-SMA is below the 50-SMA, indicating that the bears still control the market. If bulls push the price above the $0.550 level, XRP could recover towards $0.600; however, if they fail, XRP could break further below its current support level.
El indicador MACD también muestra que dominan los bajistas, ya que la línea MACD está por debajo de la línea de señal. El RSI ha tenido una tendencia a la baja y actualmente ronda los 40, lo que indica una tendencia bajista para XRP. La SMA 20 está por debajo de la SMA 50, lo que indica que los bajistas todavía controlan el mercado. Si los alcistas empujan el precio por encima del nivel de $ 0,550, XRP podría recuperarse hacia $ 0,600; sin embargo, si fallan, XRP podría caer aún más por debajo de su nivel de soporte actual.
DOGE/USD
DOGE/USD
Wikely crypto market price analysis for Dogecoin (DOGE) shows that bears have dominated the market, with DOGE trading below its crucial support level of $0.0600. The meme-inspired cryptocurrency currently trades at $0.05878, with a 24-hour surge of -0.55% and a seven-day decrease of -2.67%. The bears and bulls have been fighting for control, and the market sentiment is still bearish, with the key resistance level observed at $0.063 and support at $0.055.
El análisis de precios del mercado criptográfico de Wikely para Dogecoin (DOGE) muestra que los bajistas han dominado el mercado, con DOGE cotizando por debajo de su nivel de soporte crucial de $ 0,0600. La criptomoneda inspirada en memes cotiza actualmente a 0,05878 dólares, con un aumento de -0,55% en 24 horas y una disminución de -2,67% en siete días. Los bajistas y los alcistas han estado luchando por el control, y el sentimiento del mercado sigue siendo bajista, con el nivel de resistencia clave observado en 0,063 dólares y el soporte en 0,055 dólares.
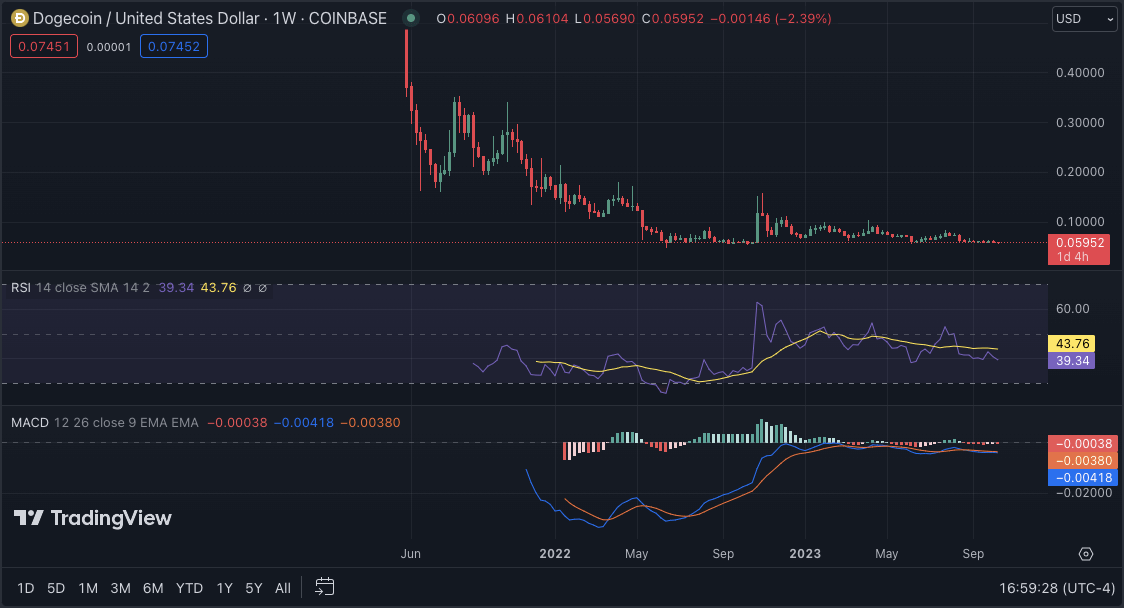
DOGE/USD weekly chart, source: TradingView
Gráfico semanal de DOGE/USD, fuente: TradingView
The moving averages show a strong bearish trend, with the 20-EMA below the 50-EMA and both below the 200-EMA. The MACD indicator also shows that bears are still in control, as the MACD line is below the signal line. The RSI has been trending down and is currently hovering around 39, indicating a bearish trend for DOGE. If bulls push the price above the $0.063 level, DOGE could see a rally toward $0.070; however, if bears continue to dominate, a further drop toward $0.050 could be seen.
Los promedios móviles muestran una fuerte tendencia bajista, con la EMA de 20 por debajo de la EMA de 50 y ambos por debajo de la EMA de 200. El indicador MACD también muestra que los bajistas todavía tienen el control, ya que la línea MACD está por debajo de la línea de señal. El RSI ha tenido una tendencia a la baja y actualmente ronda los 39, lo que indica una tendencia bajista para DOGE. Si los alcistas empujan el precio por encima del nivel de $ 0,063, DOGE podría ver un repunte hacia $ 0,070; sin embargo, si los bajistas continúan dominando, se podría ver una nueva caída hacia $0,050.
ADA/USD
ADA/USD
According to the weekly price analysis, Cardano (ADA) has been trading within a range of $0.2585-0.2430 for the past week, with a light downward trend. The coin had briefly crossed above $0.2500, only to see it slipping back down again due to strong bearish pressure from the markets. At the time of writing, ADA is currently trading at around $0.2471, with the support of the coin being quite weak.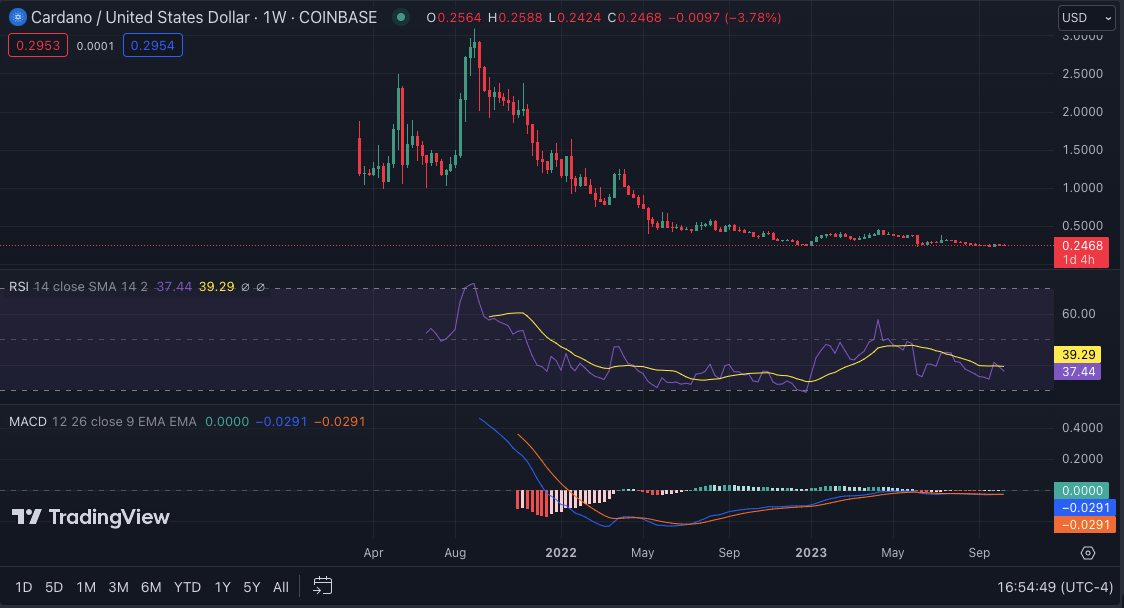
Según el análisis de precios semanal, Cardano (ADA) ha estado cotizando dentro de un rango de 0,2585-0,2430 dólares durante la semana pasada, con una ligera tendencia a la baja. La moneda había cruzado brevemente por encima de $ 0,2500, solo para verla caer nuevamente debido a la fuerte presión bajista de los mercados. En el momento de escribir este artículo, ADA se cotiza actualmente a alrededor de $0,2471, y el soporte de la moneda es bastante débil.
ADA/USD weekly chart, source: TradingView
Gráfico semanal ADA/USD, fuente: TradingView
The RSI is close to the 37 levels, indicating that selling pressure is increasing and that further losses could be in store for this currency. The MACD remains bearish, and a break below the $0.25000 support level could lead to further declines in the near term. The 20-EMA is moving below the 50-EMA, meaning bears dominate the market. The MACD is also in the red, indicating that bearish sentiment is strong.
El RSI está cerca de los niveles 37, lo que indica que la presión de venta está aumentando y que esta moneda podría sufrir más pérdidas. El MACD sigue siendo bajista y una ruptura por debajo del nivel de soporte de 0,25000 dólares podría provocar nuevas caídas en el corto plazo. La EMA 20 se está moviendo por debajo de la EMA 50, lo que significa que los bajistas dominan el mercado. El MACD también está en rojo, lo que indica que el sentimiento bajista es fuerte.
SOL/USD
SOL/USD
The altcoin Solana (SOL) has been one of the top losses this week, with a price decrease of over 5.33% in the past seven days. SOL is currently trading at $21.98, with a 24-hour gain of 1.74%. The market sentiment for SOL is still bearish, with the key resistance level observed at $25 and support at $20. The coming week will be crucial for SOL, with bulls and bears fighting for control.
La altcoin Solana (SOL) ha sido una de las mayores pérdidas esta semana, con una caída de precio de más del 5,33% en los últimos siete días. SOL cotiza actualmente a 21,98 dólares, con una ganancia en 24 horas del 1,74%. El sentimiento del mercado para SOL sigue siendo bajista, con el nivel de resistencia clave observado en 25 dólares y el soporte en 20 dólares. La próxima semana será crucial para SOL, con alcistas y bajistas luchando por el control.
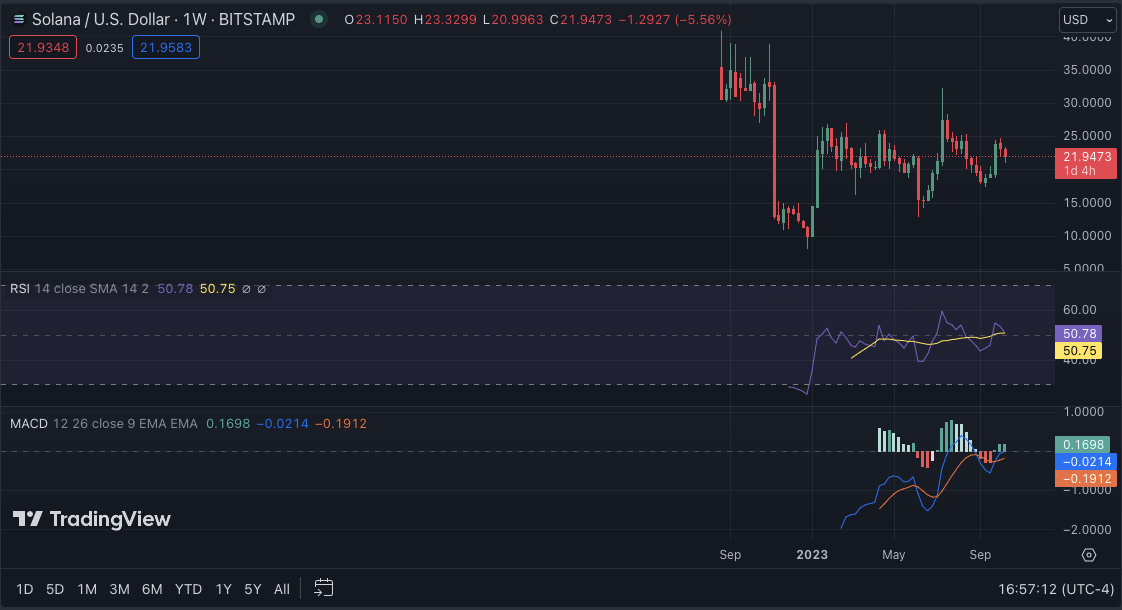
SOL/USD weekly chart, source: TradingView
Gráfico semanal SOL/USD, fuente: TradingView
The MACD indicator shows that bears dominate the market, with the signal line above the MACD line. The RSI is currently hovering around 45, indicating a bearish sentiment for SOL. However, if bulls push the price above $25, SOL could recover towards $30; however, if bears continue to dominate, a drop towards $20 could be seen. The 50-weekly MA is also below the 200-weekly MA, indicating that bears are now in market control.
El indicador MACD muestra que los bajistas dominan el mercado, con la línea de señal por encima de la línea MACD. El RSI actualmente ronda los 45, lo que indica un sentimiento bajista para SOL. Sin embargo, si los alcistas elevan el precio por encima de los 25 dólares, SOL podría recuperarse hacia los 30 dólares; sin embargo, si los bajistas continúan dominando, se podría ver una caída hacia los 20 dólares. El MA de 50 semanas también está por debajo del MA de 200 semanas, lo que indica que los bajistas ahora tienen el control del mercado.
Weekly Crypto Price Analysis Conclusion
Conclusión del análisis semanal de precios de criptomonedas
In conclusion, despite some minor price surges in certain cryptocurrencies, overall bearish sentiment remains strong in the crypto market. Bulls must work hard to turn the tide and push prices back up, with many major coins trading below crucial support levels. Monitor key resistance levels and market trends for potential trading opportunities in the coming weeks.
En conclusión, a pesar de algunos aumentos menores de precios en ciertas criptomonedas, el sentimiento bajista general sigue siendo fuerte en el mercado de las criptomonedas. Los alcistas deben trabajar duro para cambiar el rumbo y hacer que los precios vuelvan a subir, ya que muchas monedas importantes cotizan por debajo de niveles de soporte cruciales. Supervise los niveles de resistencia clave y las tendencias del mercado para detectar posibles oportunidades comerciales en las próximas semanas.
 Crypto Daily™
 CaptainAltcoin
 Thecryptoupdates
 Crypto Intelligence
 CoinsProbe
 Crypto News Land
 DogeHome
 InsideBitcoin News
 Coin Edition


