

Weekly crypto price analysis reveals that most cryptocurrencies have been trading around the support levels, with bearish momentum dominating the market. Bitcoin and most major altcoins are plummeting, but the charts suggest a recovery could be around the corner. The BTC has dropped below $27k after a considerable sell-off.
毎週の暗号通貨価格分析では、ほとんどの暗号通貨がサポートレベル付近で取引されており、弱気の勢いが市場を支配していることが明らかになりました。ビットコインとほとんどの主要アルトコインは急落しているが、チャートを見ると回復が間近に迫っている可能性があることが示唆されている。 BTCは大幅な下落の後、27,000ドルを下回りました。
Ethereum (ETH) has been hit hard by the recent market downturn and is currently trading below $1,600. The selling pressure on ETH has been significant, but it has found support at this level. The BNB token, the native cryptocurrency of the Binance exchange, has also been affected by the market downturn and is trading below $210.
イーサリアム(ETH)は最近の市場低迷で大きな打撃を受けており、現在は1,600ドル以下で取引されている。 ETHに対する売り圧力はかなり大きかったが、このレベルでサポートされていることがわかった。バイナンス取引所のネイティブ暗号通貨であるBNBトークンも市場低迷の影響を受け、210ドル以下で取引されている。
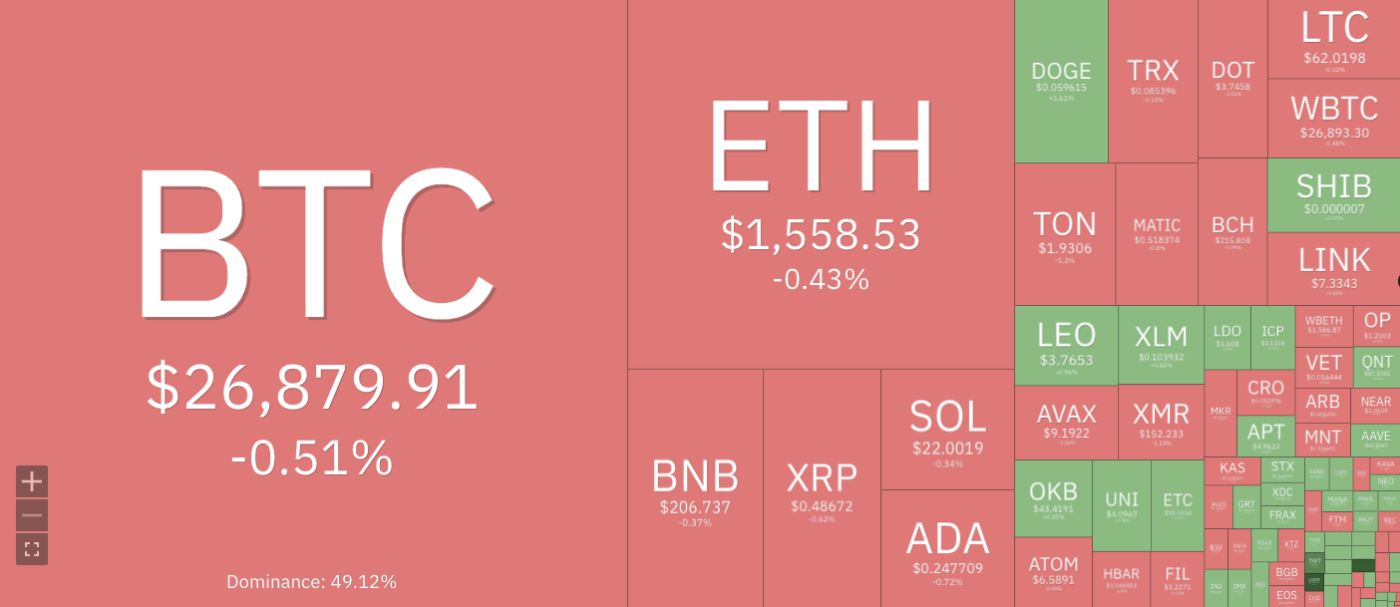
Cryptocurrencies Price Heatmap, Source: Coin360
暗号通貨価格ヒートマップ、出典: Coin360
XRP, the fourth-largest cryptocurrency by market cap, has also been downward in the past few days, with bulls and bears fighting for control. Dogecoin (DOGE), the meme-inspired cryptocurrency, has also been experiencing a significant drop in its price, with a current value of around $0.0590 levels after bulls failed to maintain the $0.0650 resistance level. The Cardano (ADA) price has also steadily declined, breaking below the $0.300 support level and trading at around $0.2470.
時価総額で4番目に大きい仮想通貨であるXRPもここ数日下落しており、強気派と弱気派が主導権を争っている。ミームにインスピレーションを得た暗号通貨であるドージコイン(DOGE)も価格が大幅に下落しており、強気派が0.0650ドルのレジスタンスレベルを維持できなかったため、現在の価値は約0.0590ドルレベルとなっている。カルダノ(ADA)価格も着実に下落し、0.300ドルのサポートレベルを下回り、0.2470ドル付近で取引されている。
BTC/USD
BTC/USD
Bitcoin price analysis shows that BTC has been trading in a bearish trend since the start of the week, with some bullish momentum seen at the start of the week. However, this was short-lived, as bears returned to the market later in the week. The BTC/USD pair currently trades around $26,874, with a 24-hour surge of -4.35%. The overall market sentiment for BTC is still bearish, with the key resistance level observed at $28k and support at $25k.
ビットコイン価格分析によると、BTCは週初めから弱気傾向で取引されており、週初めには若干の強気の勢いが見られた。しかし、これも長くは続かず、週の後半には弱気派が市場に戻ってきた。 BTC/USDペアは現在26,874ドル付近で取引されており、24時間の上昇率は-4.35%となっている。 BTC に対する市場全体のセンチメントは依然として弱気であり、主要な抵抗線は 28,000 ドル、支持線は 25,000 ドルと観測されています。
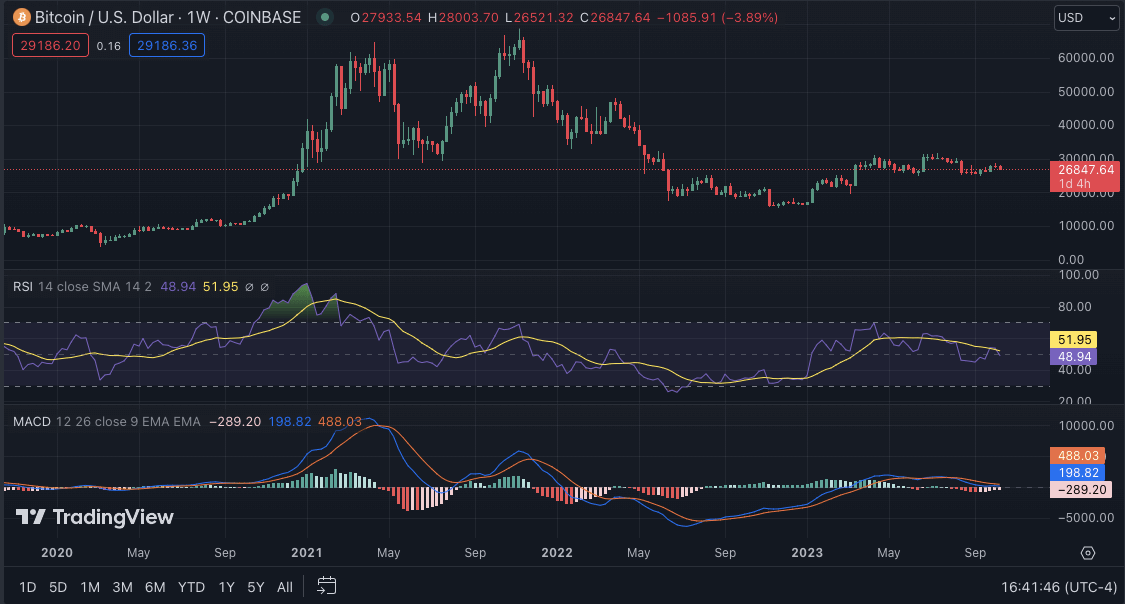
BTC/USD weekly chart, source: TradingView
BTC/USD週足チャート、出典:TradingView
BTC fell below the 20-EMA and the 50-EMA, indicating a strong bearish trend. The 50-EMA is also below the 200-EMA, with significant downward pressure. The MACD indicator indicates bearish divergence, with the MACD line remaining below the signal line. The Relative Strength Index (RSI) has also been trending down around the 40 levels, indicating a downward trend for BTC.
BTC は 20-EMA と 50-EMA を下回り、強い弱気傾向を示しています。 50-EMA も 200-EMA を下回っており、大幅な下押し圧力がかかっています。 MACD インジケーターは弱気の発散を示し、MACD ラインはシグナルラインの下に留まります。相対強度指数 (RSI) も 40 レベル付近で低下傾向にあり、BTC の下落傾向を示しています。
ETH/USD
ETH/USD
Ethereum price analysis shows that ETH has been trading below its key support level of $1,600 for the past few days. The second-largest cryptocurrency by market cap currently trades at around $1,554 with a 24-hour surge of -0.78%. The bearish sentiment for ETH is still strong, with the key resistance level observed at $1,700 and support at $1,500. If bears continue to dominate, a further drop toward the $1,400 level could be seen; however, if bulls manage to take control, ETH could see a push toward the $1,800 level.
イーサリアムの価格分析によると、ETHは過去数日間、主要なサポートレベルである1,600ドルを下回って取引されている。時価総額で2番目に大きい仮想通貨は現在約1,554ドルで取引されており、24時間の上昇率は-0.78%となっている。 ETHに対する弱気感情は依然として強く、主要な抵抗線は1,700ドル、支持線は1,500ドルにあると見られています。弱気派が優勢を続ければ、1,400ドルレベルに向けてさらなる下落が見られる可能性がある。しかし、強気派がなんとか主導権を握ることができれば、ETHは1,800ドルレベルに向けて上昇する可能性がある。
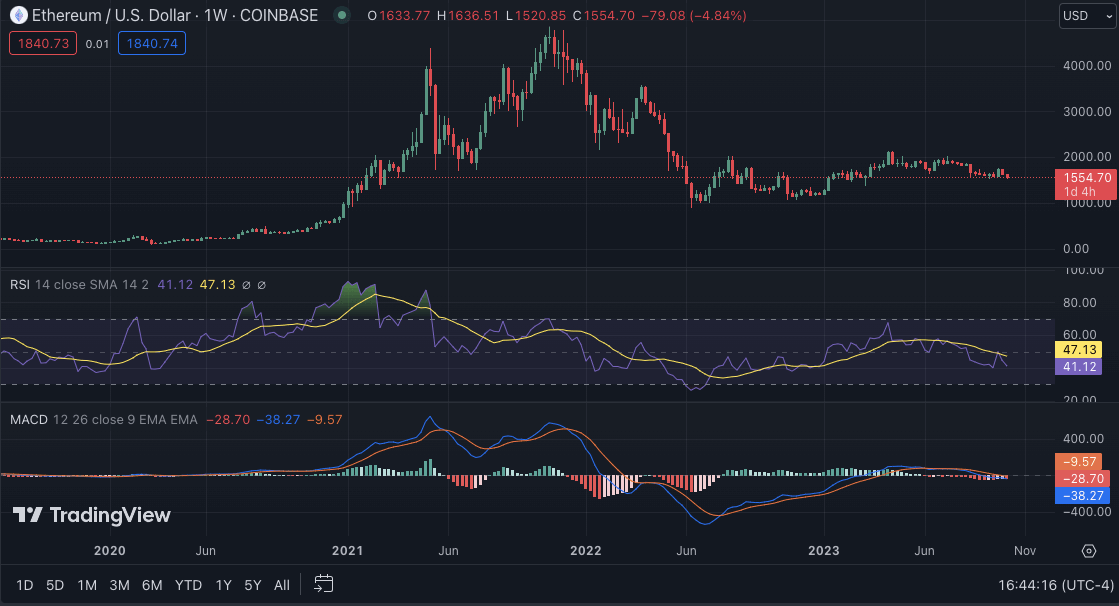
ETH/USD weekly chart, source: TradingView
ETH/USD週足チャート、出典:TradingView
The MACD indicator shows bearish momentum as it has formed a negative crossover. The RSI is currently hovering near 40, suggesting that bears are slowly gaining market control. The 50-weekly MA is below the 200-weekly MA, indicating that the price will likely remain bearish soon. The moving averages have been in neutral territory, meaning ETH could consolidate before making its next move.
MACD 指標はマイナスのクロスオーバーを形成しているため、弱気の勢いを示しています。 RSIは現在40付近で推移しており、弱気派が徐々に市場支配権を獲得していることを示唆している。 50週間移動平均線は200週間移動平均線を下回っており、価格がすぐに弱気のままになる可能性が高いことを示しています。移動平均線は中立領域にあり、ETHが次の動きをする前に値固めされる可能性があることを意味します。
BNB/USD
BNB/USD
The weekly price analysis for Binance Coin (BNB) reveals that bears have controlled the market for the past few days. On October 08, BNB broke and closed below the symmetrical triangle pattern, signifying that bears prevailed over bulls. The selling pressure increased on October 12, and the BNB/USD pair fell below the crucial $205 support level. At the time of writing, BNB is trading at $206, with a minimal surge of 0.58% in the past 24 hours; however, in the past seven days, BNB has recorded a -2.56% loss. The market sentiment for BNB is still bearish, with the key resistance level observed at $235 and support at $200.
バイナンスコイン(BNB)の週次価格分析では、ここ数日間弱気派が市場を支配していることが明らかになった。 10月8日、BNBは対称的な三角形のパターンを下回って終値となり、弱気派が強気派に勝ったことを示した。 10月12日には売り圧力が高まり、BNB/USDペアは重要なサポートレベルである205ドルを下回った。この記事の執筆時点では、BNBは206ドルで取引されており、過去24時間での最小値上がり率は0.58%です。しかし、過去 7 日間で、BNB は -2.56% の損失を記録しました。 BNB に対する市場センチメントは依然として弱気であり、主要な抵抗線は 235 ドル、支持線は 200 ドルと見られています。
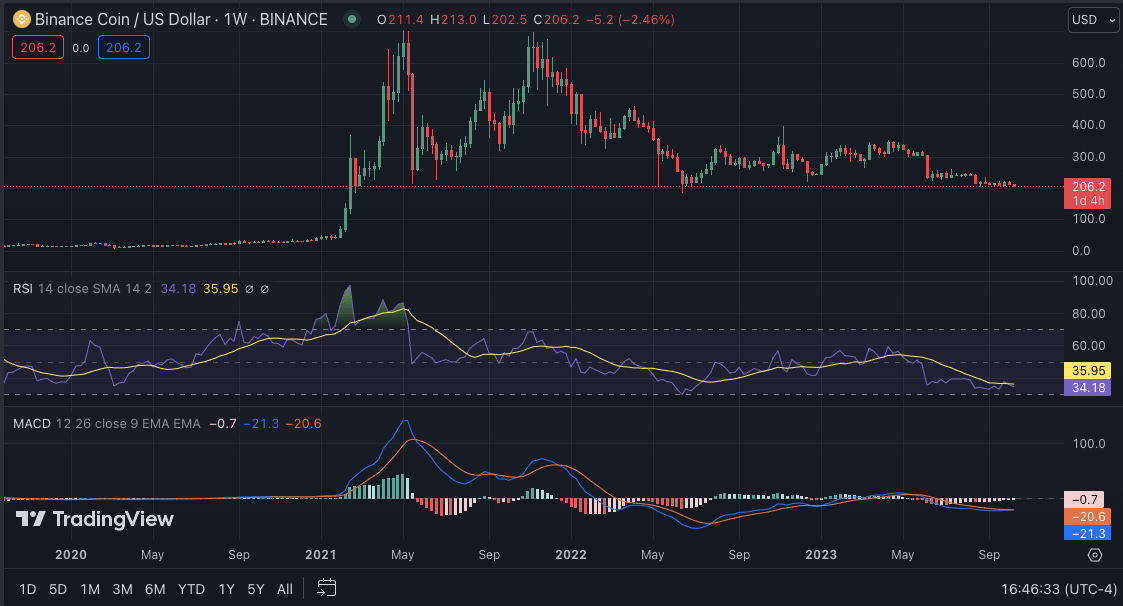
BNB/USD weekly chart, source: TradingView
BNB/USD週足チャート、出典:TradingView
The MACD and signal lines have crossed over in a bearish divergence, indicating that bears dominate the market and could continue to push the price down soon. The RSI is also currently trending in the bearish zone, suggesting that BNB could see further losses before a bullish trend emerges.
MACD とシグナルラインは弱気のダイバージェンスでクロスオーバーしており、弱気派が市場を支配しており、間もなく価格を押し下げ続ける可能性があることを示しています。 RSIも現在弱気ゾーンで推移しており、強気トレンドが現れる前にBNBがさらに損失を被る可能性があることを示唆している。
XRP/USD
XRP/米ドル
XRP price analysis shows that bears have controlled the market for most of the week, pushing the price to record lows. In the past seven days, XRP has seen a -6.70% loss in its value and is currently trading at $0.4864, with a 24-hour surge of -0.61%. After the SEC’s lawsuit against Ripple, the market sentiment for XRP has been bearish, with the key resistance level observed at $0.550 and support at $0.450. The price of XRP is currently below the 200-EMA, indicating a strong bearish trend in the near future.
XRP価格分析によると、弱気派が週の大半で市場を支配し、価格を記録的な安値に押し上げた。過去7日間でXRPの価値は-6.70%下落し、現在は0.4864ドルで取引されており、24時間の上昇率は-0.61%となっています。 SECによるリップルに対する訴訟後、XRPに対する市場センチメントは弱気となっており、主要な抵抗線は0.550ドル、支持線は0.450ドルとなっている。 XRPの価格は現在200-EMAを下回っており、近い将来の強い弱気傾向を示しています。
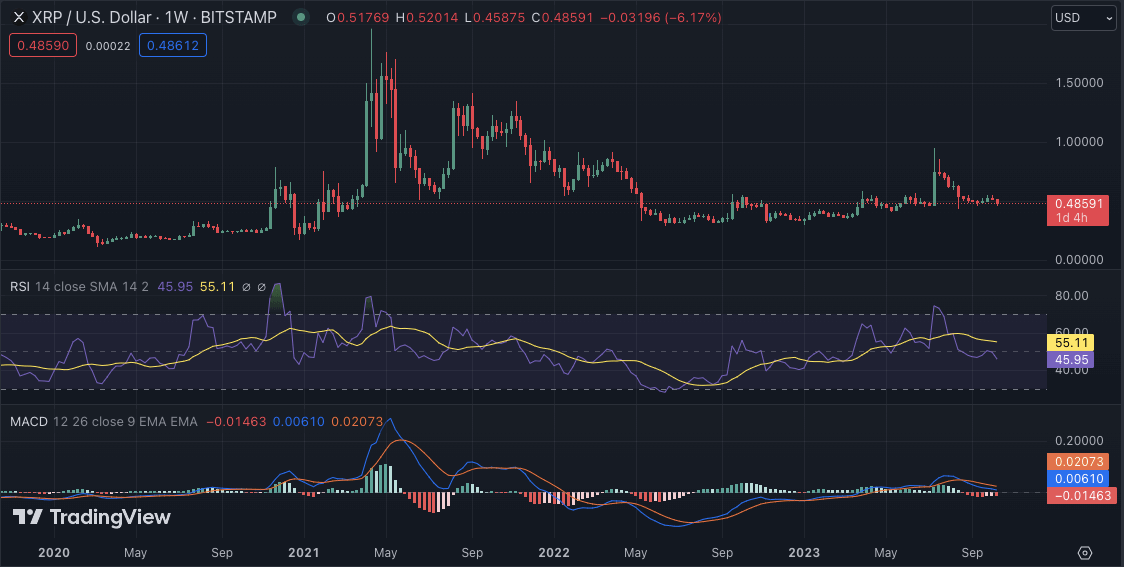
XRP/USD weekly chart, source: TradingView
XRP/USD週足チャート、出典:TradingView
The MACD indicator also shows that bears dominate, as the MACD line is below the signal line. The RSI has been trending down and is currently hovering around 40, which indicates a bearish trend for XRP. The 20-SMA is below the 50-SMA, indicating that the bears still control the market. If bulls push the price above the $0.550 level, XRP could recover towards $0.600; however, if they fail, XRP could break further below its current support level.
MACD インジケーターも、MACD ラインがシグナルラインを下回っているため、弱気派が優勢であることを示しています。 RSIは低下傾向にあり、現在は40付近で推移しており、XRPの弱気傾向を示しています。 20-SMA は 50-SMA を下回っており、弱気派が依然として市場を支配していることを示しています。強気派が価格を0.550ドルのレベルを超えて押し上げれば、XRPは0.600ドルに向けて回復する可能性がある。ただし、それらが失敗した場合、XRPは現在のサポートレベルをさらに下回る可能性があります。
DOGE/USD
ドージ/米ドル
Wikely crypto market price analysis for Dogecoin (DOGE) shows that bears have dominated the market, with DOGE trading below its crucial support level of $0.0600. The meme-inspired cryptocurrency currently trades at $0.05878, with a 24-hour surge of -0.55% and a seven-day decrease of -2.67%. The bears and bulls have been fighting for control, and the market sentiment is still bearish, with the key resistance level observed at $0.063 and support at $0.055.
Wikelyのドージコイン(DOGE)の仮想通貨市場価格分析では、弱気派が市場を支配しており、DOGEは重要なサポートレベルである0.0600ドルを下回って取引されていることが示されている。ミームにインスピレーションを得たこの仮想通貨は現在、0.05878ドルで取引されており、24時間の上昇率は-0.55%、7日間の下落率は-2.67%となっている。弱気派と強気派が主導権を争っており、市場心理は依然弱気で、主要な抵抗線は0.063ドル、支持線は0.055ドルとなっている。
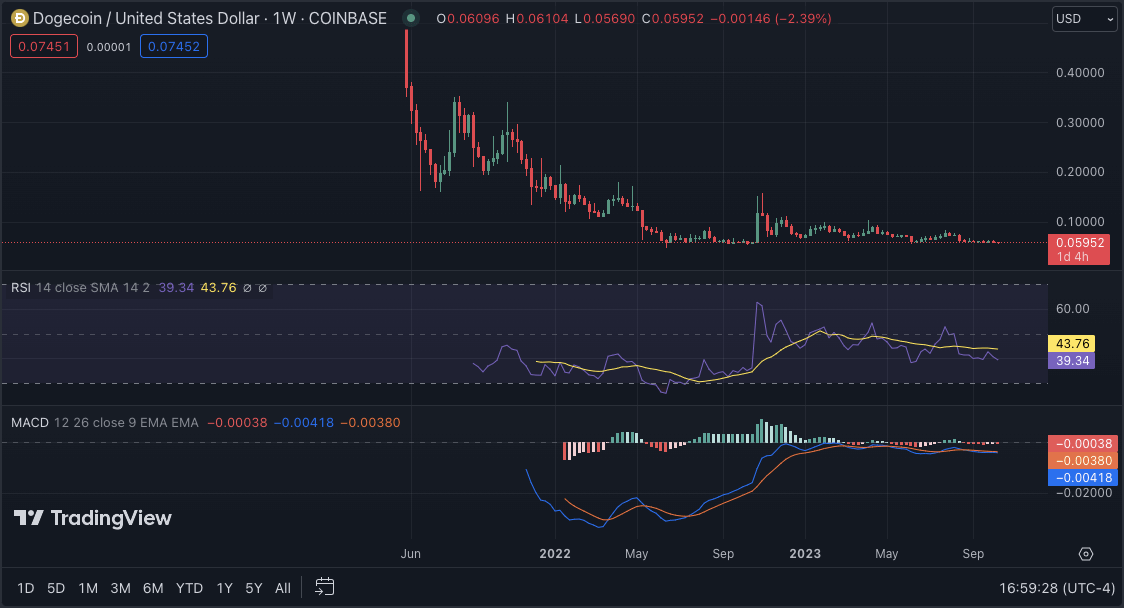
DOGE/USD weekly chart, source: TradingView
DOGE/USD週足チャート、出典:TradingView
The moving averages show a strong bearish trend, with the 20-EMA below the 50-EMA and both below the 200-EMA. The MACD indicator also shows that bears are still in control, as the MACD line is below the signal line. The RSI has been trending down and is currently hovering around 39, indicating a bearish trend for DOGE. If bulls push the price above the $0.063 level, DOGE could see a rally toward $0.070; however, if bears continue to dominate, a further drop toward $0.050 could be seen.
移動平均は強い弱気傾向を示しており、20-EMA は 50-EMA を下回り、両方とも 200-EMA を下回っています。 MACD インジケーターはまた、MACD ラインがシグナルラインを下回っているため、弱気相場がまだ支配していることを示しています。 RSIは低下傾向にあり、現在は39付近で推移しており、DOGEの弱気傾向を示しています。強気派が価格を0.063ドルのレベルを超えて押し上げれば、DOGEは0.070ドルに向けて上昇する可能性がある。ただし、弱気派が優勢を続ければ、0.050ドルに向けてさらなる下落が見られる可能性がある。
ADA/USD
ADA/米ドル
According to the weekly price analysis, Cardano (ADA) has been trading within a range of $0.2585-0.2430 for the past week, with a light downward trend. The coin had briefly crossed above $0.2500, only to see it slipping back down again due to strong bearish pressure from the markets. At the time of writing, ADA is currently trading at around $0.2471, with the support of the coin being quite weak.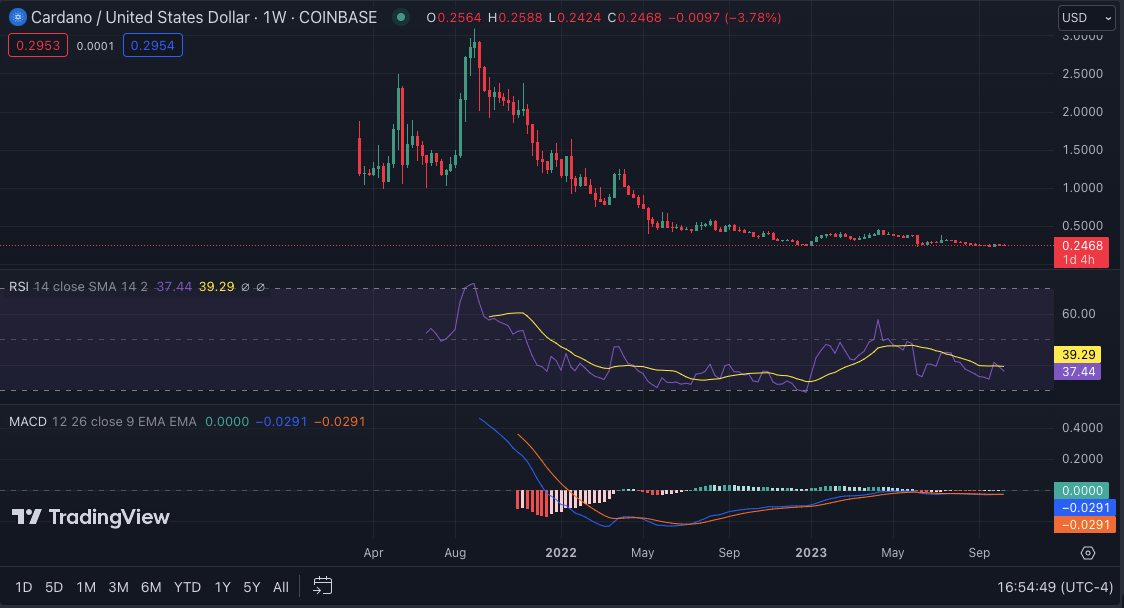
週次価格分析によると、カルダノ(ADA)は過去1週間、0.2585ドルから0.2430ドルの範囲内で取引されており、軽い下降傾向にあります。このコインは一時0.2500ドルを超えたが、市場からの強い弱気圧力により再び下落した。執筆時点では、ADAは現在約0.2471ドルで取引されており、コインのサポートは非常に弱いです。
ADA/USD weekly chart, source: TradingView
ADA/USD週足チャート、出典:TradingView
The RSI is close to the 37 levels, indicating that selling pressure is increasing and that further losses could be in store for this currency. The MACD remains bearish, and a break below the $0.25000 support level could lead to further declines in the near term. The 20-EMA is moving below the 50-EMA, meaning bears dominate the market. The MACD is also in the red, indicating that bearish sentiment is strong.
RSIは37レベルに近く、売り圧力が高まっており、この通貨にはさらなる損失が待ち受けている可能性があることを示しています。 MACDは依然として弱気であり、0.25000ドルのサポートレベルを下回ると、短期的にはさらなる下落につながる可能性がある。 20-EMA は 50-EMA を下回っており、弱気派が市場を支配していることを意味します。 MACDも赤字となっており、弱気ムードが強いことを示している。
SOL/USD
ソル/米ドル
The altcoin Solana (SOL) has been one of the top losses this week, with a price decrease of over 5.33% in the past seven days. SOL is currently trading at $21.98, with a 24-hour gain of 1.74%. The market sentiment for SOL is still bearish, with the key resistance level observed at $25 and support at $20. The coming week will be crucial for SOL, with bulls and bears fighting for control.
アルトコインのソラナ(SOL)は今週最も下落した銘柄の一つで、過去7日間で価格が5.33%以上下落した。 SOLは現在21.98ドルで取引されており、24時間で1.74%上昇した。 SOL に対する市場センチメントは依然として弱気であり、主な抵抗線は 25 ドル、支持線は 20 ドルと見られています。来週は強気派と弱気派が主導権を争うため、SOLにとって重要な週となるだろう。
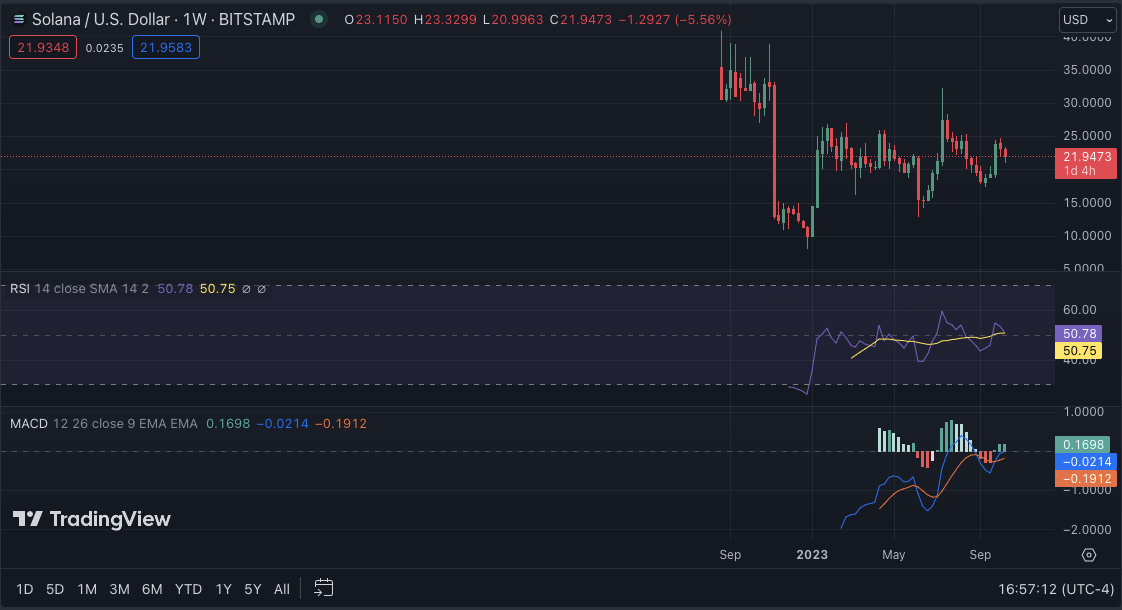
SOL/USD weekly chart, source: TradingView
SOL/USD週足チャート、出典:TradingView
The MACD indicator shows that bears dominate the market, with the signal line above the MACD line. The RSI is currently hovering around 45, indicating a bearish sentiment for SOL. However, if bulls push the price above $25, SOL could recover towards $30; however, if bears continue to dominate, a drop towards $20 could be seen. The 50-weekly MA is also below the 200-weekly MA, indicating that bears are now in market control.
MACD インジケーターは、シグナルラインが MACD ラインより上にあり、弱気派が市場を支配していることを示しています。 RSIは現在45付近で推移しており、SOLに対する弱気なセンチメントを示している。しかし、強気派が価格を25ドル以上に押し上げれば、SOLは30ドルに向けて回復する可能性がある。ただし、弱気派が優勢を続ければ、20ドルに向けての下落が見られる可能性がある。 50週間移動平均も200週間移動平均を下回っており、弱気派が現在市場を支配していることを示している。
Weekly Crypto Price Analysis Conclusion
毎週の仮想通貨価格分析の結論
In conclusion, despite some minor price surges in certain cryptocurrencies, overall bearish sentiment remains strong in the crypto market. Bulls must work hard to turn the tide and push prices back up, with many major coins trading below crucial support levels. Monitor key resistance levels and market trends for potential trading opportunities in the coming weeks.
結論として、特定の仮想通貨で若干の価格上昇があったにもかかわらず、仮想通貨市場全体の弱気センチメントは依然として強いと言えます。多くの主要コインが重要なサポートレベルを下回って取引されているため、強気派は流れを変えて価格を押し戻すために懸命に努力する必要がある。今後数週間の潜在的な取引機会について、主要な抵抗レベルと市場動向を監視します。
 Crypto Daily™
 Crypto Daily™
 DogeHome
 TheCoinrise Media
 Thecoinrepublic.com
 TheCoinrise Media
 TheCoinrise Media
 Cryptopolitan_News


