

Weekly crypto price analysis reveals that most cryptocurrencies have been trading around the support levels, with bearish momentum dominating the market. Bitcoin and most major altcoins are plummeting, but the charts suggest a recovery could be around the corner. The BTC has dropped below $27k after a considerable sell-off.
주간 암호화폐 가격 분석에 따르면 대부분의 암호화폐는 지지 수준을 중심으로 거래되었으며 약세 모멘텀이 시장을 지배하고 있는 것으로 나타났습니다. 비트코인과 대부분의 주요 알트코인은 급락하고 있지만 차트에 따르면 회복이 코앞으로 다가올 수 있음을 시사합니다. 상당한 매도 이후 BTC는 27,000달러 아래로 떨어졌습니다.
Ethereum (ETH) has been hit hard by the recent market downturn and is currently trading below $1,600. The selling pressure on ETH has been significant, but it has found support at this level. The BNB token, the native cryptocurrency of the Binance exchange, has also been affected by the market downturn and is trading below $210.
이더리움(ETH)은 최근 시장 침체로 큰 타격을 받아 현재 1,600달러 미만으로 거래되고 있습니다. ETH에 대한 매도 압력은 상당했지만 이 수준에서 지지를 찾았습니다. 바이낸스 거래소의 기본 암호화폐인 BNB 토큰도 시장 침체의 영향을 받아 210달러 미만으로 거래되고 있습니다.
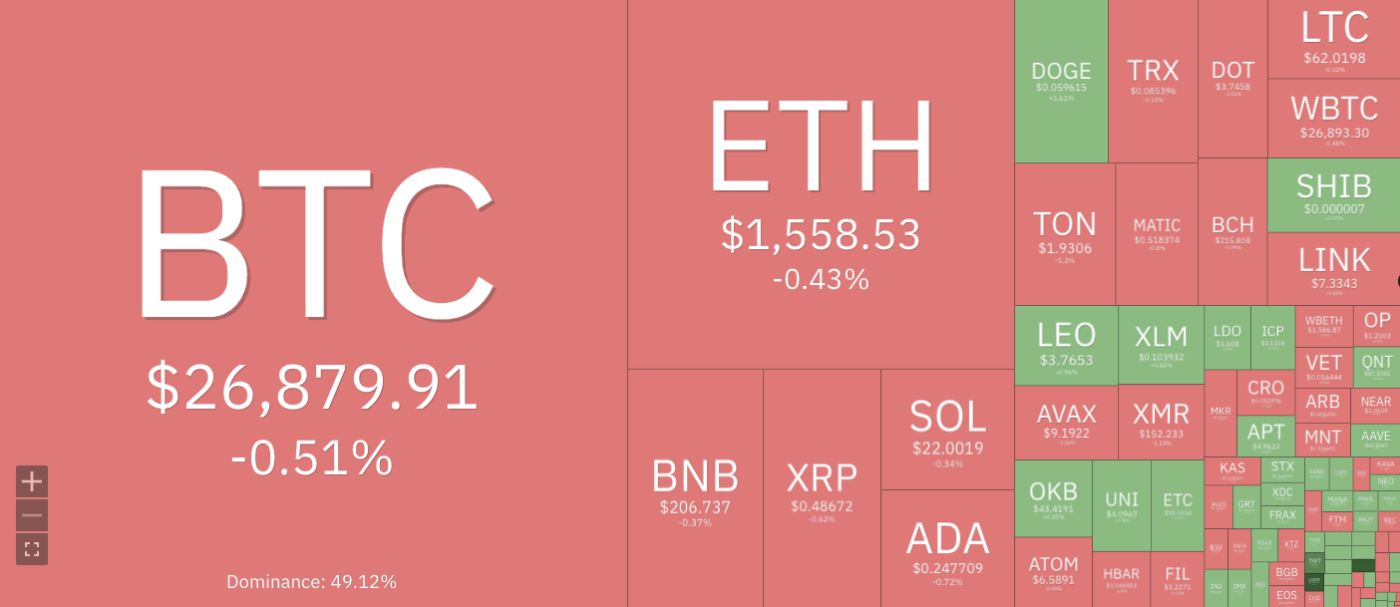
Cryptocurrencies Price Heatmap, Source: Coin360
XRP, the fourth-largest cryptocurrency by market cap, has also been downward in the past few days, with bulls and bears fighting for control. Dogecoin (DOGE), the meme-inspired cryptocurrency, has also been experiencing a significant drop in its price, with a current value of around $0.0590 levels after bulls failed to maintain the $0.0650 resistance level. The Cardano (ADA) price has also steadily declined, breaking below the $0.300 support level and trading at around $0.2470.
시가총액 기준으로 네 번째로 큰 암호화폐인 XRP 역시 지난 며칠간 하락세를 보이며 하락세를 보이고 있습니다. 밈에서 영감을 받은 암호화폐인 도지코인(DOGE)도 상승세가 $0.0650 저항 수준을 유지하지 못한 후 현재 약 $0.0590 수준으로 가격이 크게 하락했습니다. 카르다노(ADA) 가격도 꾸준히 하락해 $0.300 지원 수준을 밑돌고 약 $0.2470에 거래되고 있습니다.
BTC/USD
Bitcoin price analysis shows that BTC has been trading in a bearish trend since the start of the week, with some bullish momentum seen at the start of the week. However, this was short-lived, as bears returned to the market later in the week. The BTC/USD pair currently trades around $26,874, with a 24-hour surge of -4.35%. The overall market sentiment for BTC is still bearish, with the key resistance level observed at $28k and support at $25k.
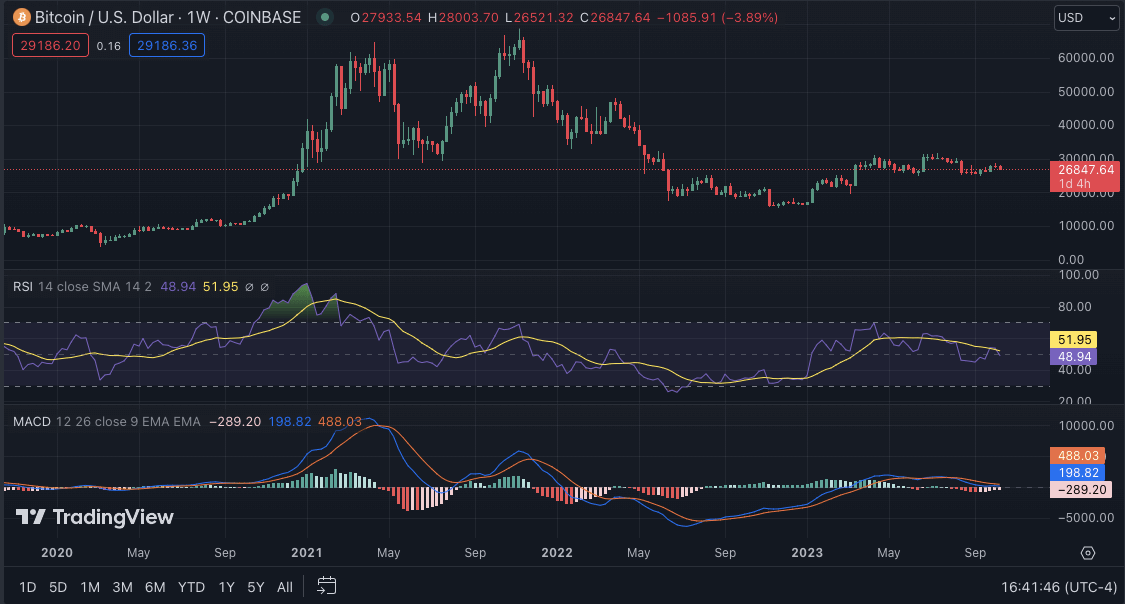
BTC/USD weekly chart, source: TradingView
BTC/USD 주간 차트, 출처: TradingView
BTC fell below the 20-EMA and the 50-EMA, indicating a strong bearish trend. The 50-EMA is also below the 200-EMA, with significant downward pressure. The MACD indicator indicates bearish divergence, with the MACD line remaining below the signal line. The Relative Strength Index (RSI) has also been trending down around the 40 levels, indicating a downward trend for BTC.
BTC는 20-EMA와 50-EMA 아래로 떨어졌으며 이는 강한 약세 추세를 나타냅니다. 50-EMA도 200-EMA보다 낮아 상당한 하향 압력을 받고 있습니다. MACD 표시기는 약세 다이버전스를 나타내며, MACD 선은 신호 선 아래에 남아 있습니다. 상대강도지수(RSI)도 40레벨 부근에서 하락 추세를 보이고 있어 BTC의 하락 추세를 나타냅니다.
ETH/USD
ETH/USD
Ethereum price analysis shows that ETH has been trading below its key support level of $1,600 for the past few days. The second-largest cryptocurrency by market cap currently trades at around $1,554 with a 24-hour surge of -0.78%. The bearish sentiment for ETH is still strong, with the key resistance level observed at $1,700 and support at $1,500. If bears continue to dominate, a further drop toward the $1,400 level could be seen; however, if bulls manage to take control, ETH could see a push toward the $1,800 level.
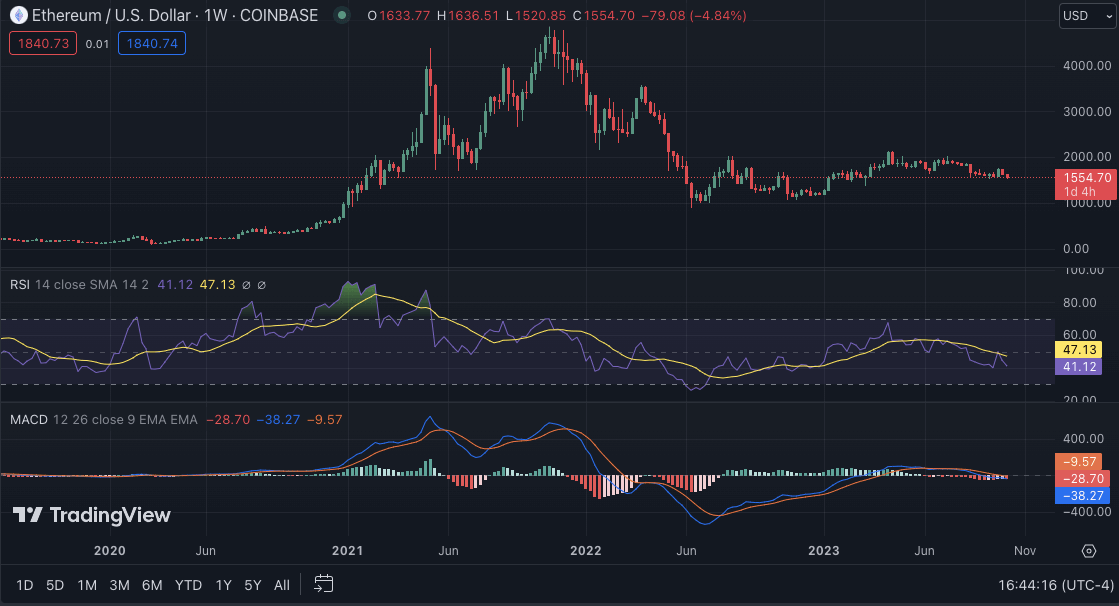
ETH/USD weekly chart, source: TradingView
The MACD indicator shows bearish momentum as it has formed a negative crossover. The RSI is currently hovering near 40, suggesting that bears are slowly gaining market control. The 50-weekly MA is below the 200-weekly MA, indicating that the price will likely remain bearish soon. The moving averages have been in neutral territory, meaning ETH could consolidate before making its next move.
BNB/USD
BNB/USD
The weekly price analysis for Binance Coin (BNB) reveals that bears have controlled the market for the past few days. On October 08, BNB broke and closed below the symmetrical triangle pattern, signifying that bears prevailed over bulls. The selling pressure increased on October 12, and the BNB/USD pair fell below the crucial $205 support level. At the time of writing, BNB is trading at $206, with a minimal surge of 0.58% in the past 24 hours; however, in the past seven days, BNB has recorded a -2.56% loss. The market sentiment for BNB is still bearish, with the key resistance level observed at $235 and support at $200.
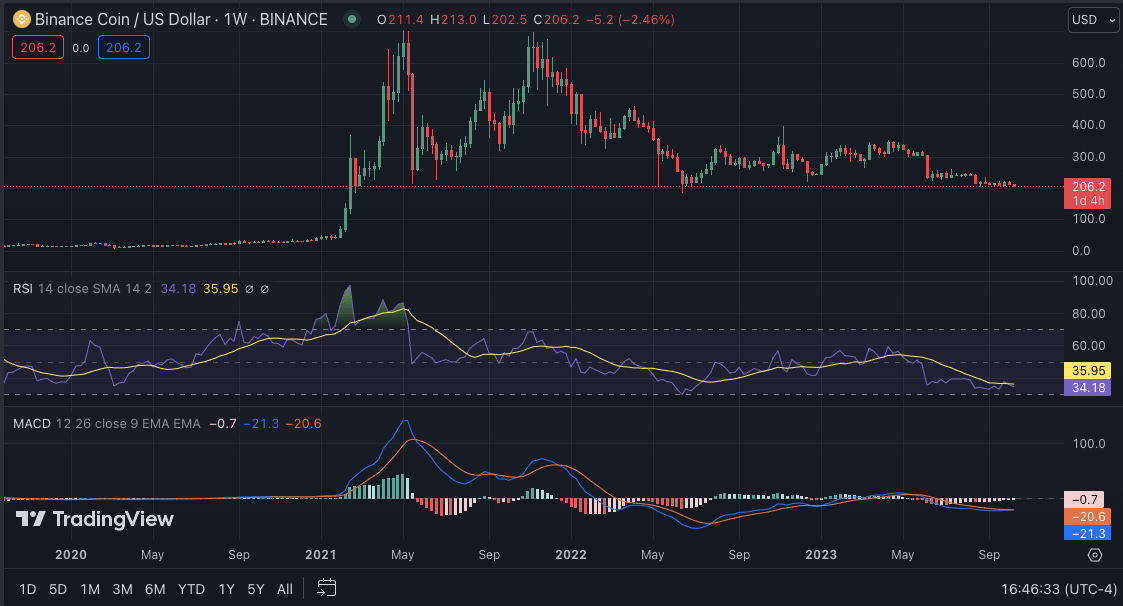
BNB/USD weekly chart, source: TradingView
BNB/USD 주간 차트, 출처: TradingView
The MACD and signal lines have crossed over in a bearish divergence, indicating that bears dominate the market and could continue to push the price down soon. The RSI is also currently trending in the bearish zone, suggesting that BNB could see further losses before a bullish trend emerges.
MACD와 신호선이 약세 다이버전스에서 교차했는데, 이는 약세가 시장을 장악하고 있으며 조만간 가격이 계속해서 하락할 수 있음을 나타냅니다. RSI도 현재 약세 영역에서 추세를 보이고 있으며, 이는 강세 추세가 나타나기 전에 BNB가 추가 손실을 볼 수 있음을 시사합니다.
XRP/USD
XRP/USD
XRP price analysis shows that bears have controlled the market for most of the week, pushing the price to record lows. In the past seven days, XRP has seen a -6.70% loss in its value and is currently trading at $0.4864, with a 24-hour surge of -0.61%. After the SEC’s lawsuit against Ripple, the market sentiment for XRP has been bearish, with the key resistance level observed at $0.550 and support at $0.450. The price of XRP is currently below the 200-EMA, indicating a strong bearish trend in the near future.
XRP 가격 분석에 따르면 하락세는 일주일 내내 시장을 장악해 가격을 사상 최저 수준으로 끌어올렸습니다. 지난 7일 동안 XRP의 가치는 -6.70% 하락했으며 현재 0.4864달러에 거래되고 있으며 24시간 동안 -0.61% 급등했습니다. SEC가 Ripple을 상대로 소송을 제기한 후 XRP에 대한 시장 심리는 약세였으며 주요 저항 수준은 0.550달러, 지지 수준은 0.450달러였습니다. XRP의 가격은 현재 200-EMA보다 낮으며 가까운 미래에 강한 약세 추세를 나타냅니다.
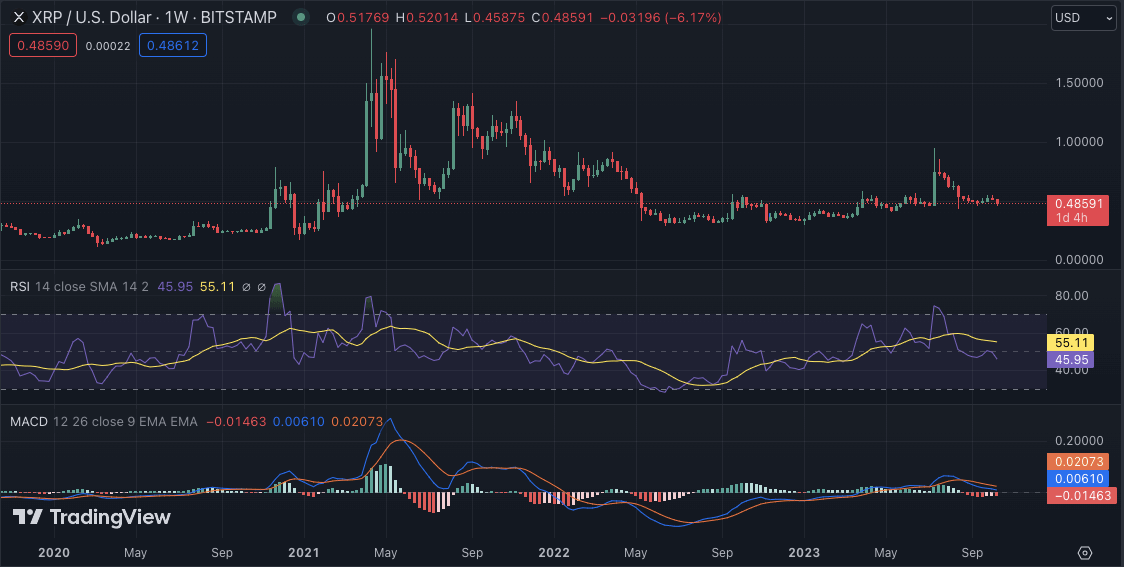
XRP/USD weekly chart, source: TradingView
The MACD indicator also shows that bears dominate, as the MACD line is below the signal line. The RSI has been trending down and is currently hovering around 40, which indicates a bearish trend for XRP. The 20-SMA is below the 50-SMA, indicating that the bears still control the market. If bulls push the price above the $0.550 level, XRP could recover towards $0.600; however, if they fail, XRP could break further below its current support level.
DOGE/USD
도지/USD
Wikely crypto market price analysis for Dogecoin (DOGE) shows that bears have dominated the market, with DOGE trading below its crucial support level of $0.0600. The meme-inspired cryptocurrency currently trades at $0.05878, with a 24-hour surge of -0.55% and a seven-day decrease of -2.67%. The bears and bulls have been fighting for control, and the market sentiment is still bearish, with the key resistance level observed at $0.063 and support at $0.055.
Dogecoin(DOGE)에 대한 Wikly 암호화폐 시장 가격 분석에 따르면 DOGE 거래는 중요한 지원 수준인 $0.0600 미만으로 하락세가 시장을 지배하고 있는 것으로 나타났습니다. 밈에서 영감을 받은 암호화폐는 현재 0.05878달러에 거래되고 있으며, 24시간 급등률은 -0.55%, 7일 하락폭은 -2.67%입니다. 하락세와 황소세는 통제권을 놓고 싸우고 있으며 시장 정서는 여전히 하락세를 보이고 있으며 주요 저항선은 0.063달러, 지지선은 0.055달러입니다.
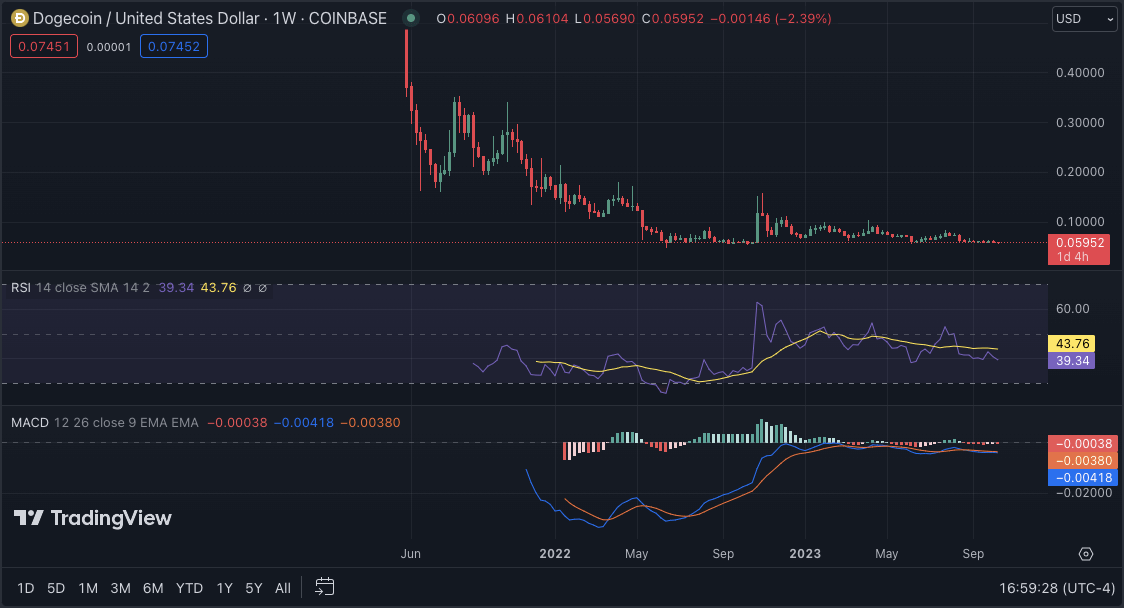
DOGE/USD weekly chart, source: TradingView
DOGE/USD 주간 차트, 출처: TradingView
The moving averages show a strong bearish trend, with the 20-EMA below the 50-EMA and both below the 200-EMA. The MACD indicator also shows that bears are still in control, as the MACD line is below the signal line. The RSI has been trending down and is currently hovering around 39, indicating a bearish trend for DOGE. If bulls push the price above the $0.063 level, DOGE could see a rally toward $0.070; however, if bears continue to dominate, a further drop toward $0.050 could be seen.
이동 평균은 20-EMA가 50-EMA 아래에 있고 둘 다 200-EMA 아래에 있는 강한 약세 추세를 보여줍니다. MACD 지표는 또한 MACD 선이 신호선 아래에 있기 때문에 하락세가 여전히 통제되고 있음을 보여줍니다. RSI는 하향 추세를 보이고 있으며 현재 39 부근에 머물고 있으며 이는 DOGE의 약세 추세를 나타냅니다. 황소가 가격을 $0.063 수준 이상으로 올리면 DOGE는 $0.070을 향한 랠리를 볼 수 있습니다. 그러나 약세가 계속해서 지배한다면 $0.050까지 추가 하락할 수 있습니다.
ADA/USD
According to the weekly price analysis, Cardano (ADA) has been trading within a range of $0.2585-0.2430 for the past week, with a light downward trend. The coin had briefly crossed above $0.2500, only to see it slipping back down again due to strong bearish pressure from the markets. At the time of writing, ADA is currently trading at around $0.2471, with the support of the coin being quite weak.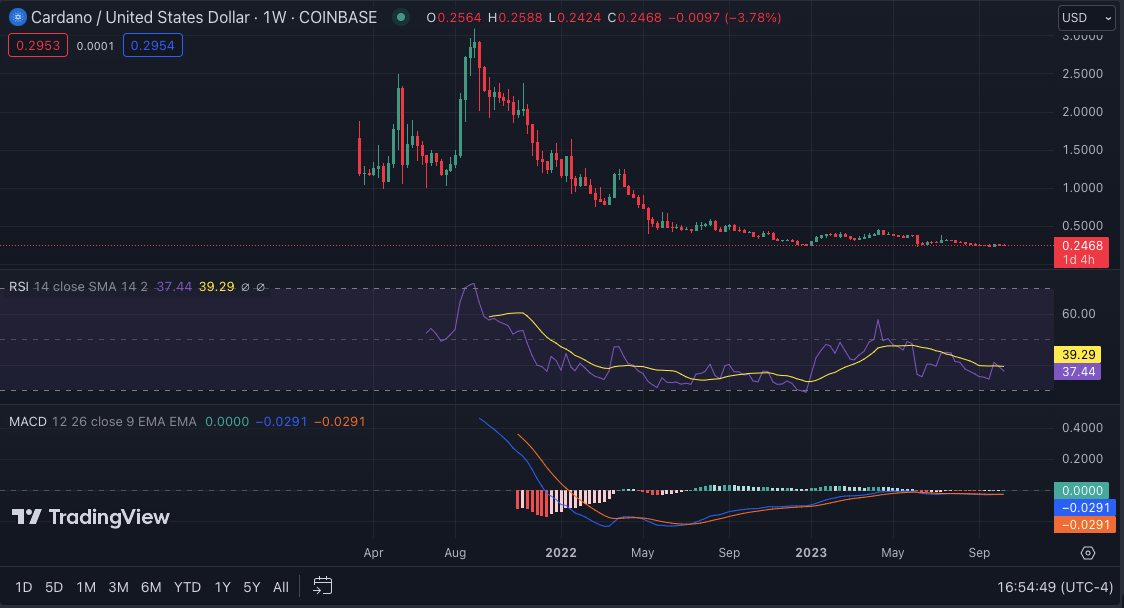
주간 가격 분석에 따르면 카르다노(ADA)는 지난 주 동안 $0.2585-0.2430 범위 내에서 거래되었으며 가벼운 하락 추세를 보였습니다. 해당 코인은 잠시 0.2500달러를 넘어섰으나 시장의 강한 약세 압력으로 인해 다시 하락세를 보였습니다. 이 글을 쓰는 시점에서 ADA는 현재 약 $0.2471에 거래되고 있으며 코인의 지원은 매우 약합니다.
ADA/USD weekly chart, source: TradingView
The RSI is close to the 37 levels, indicating that selling pressure is increasing and that further losses could be in store for this currency. The MACD remains bearish, and a break below the $0.25000 support level could lead to further declines in the near term. The 20-EMA is moving below the 50-EMA, meaning bears dominate the market. The MACD is also in the red, indicating that bearish sentiment is strong.
RSI가 37 수준에 가깝습니다. 이는 매도 압력이 증가하고 있으며 이 통화에 추가 손실이 발생할 수 있음을 나타냅니다. MACD는 여전히 약세를 유지하고 있으며, $0.25000 지지선 아래로 떨어지면 단기적으로 추가 하락세를 보일 수 있습니다. 20-EMA는 50-EMA 아래로 이동하고 있습니다. 이는 약세가 시장을 지배한다는 의미입니다. MACD도 빨간색으로 표시되어 약세 심리가 강함을 나타냅니다.
SOL/USD
솔/달러
The altcoin Solana (SOL) has been one of the top losses this week, with a price decrease of over 5.33% in the past seven days. SOL is currently trading at $21.98, with a 24-hour gain of 1.74%. The market sentiment for SOL is still bearish, with the key resistance level observed at $25 and support at $20. The coming week will be crucial for SOL, with bulls and bears fighting for control.
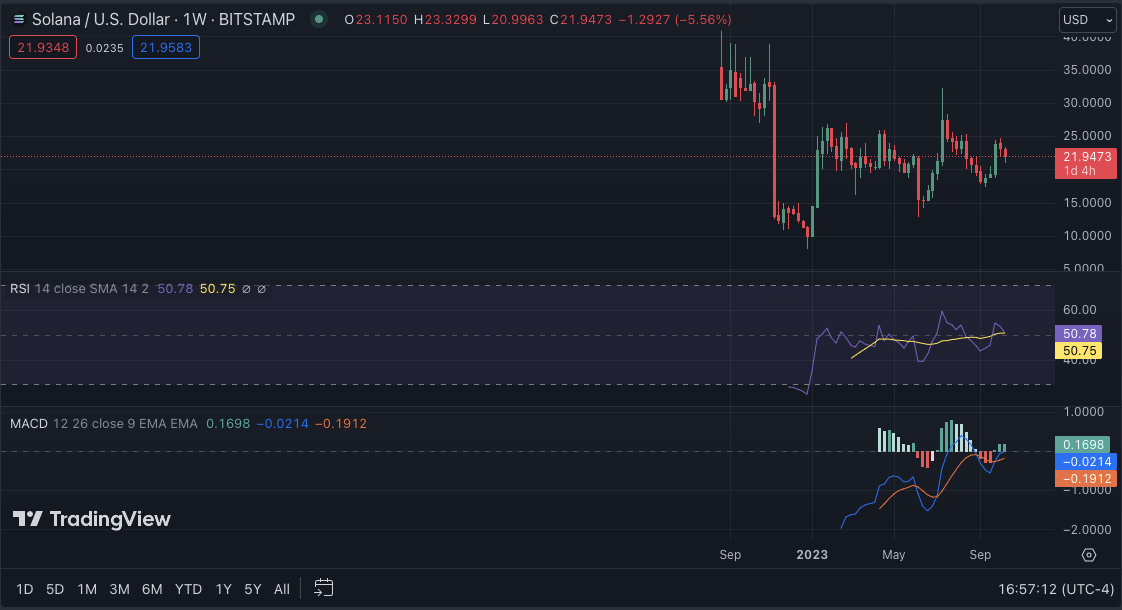
SOL/USD weekly chart, source: TradingView
SOL/USD 주간 차트, 출처: TradingView
The MACD indicator shows that bears dominate the market, with the signal line above the MACD line. The RSI is currently hovering around 45, indicating a bearish sentiment for SOL. However, if bulls push the price above $25, SOL could recover towards $30; however, if bears continue to dominate, a drop towards $20 could be seen. The 50-weekly MA is also below the 200-weekly MA, indicating that bears are now in market control.
MACD 지표는 하락세가 시장을 지배하고 있음을 보여주며, 신호선은 MACD선 위에 있습니다. RSI는 현재 45 주변을 맴돌고 있어 SOL에 대한 약세 심리를 나타냅니다. 그러나 황소가 가격을 25달러 이상으로 올리면 SOL은 30달러로 회복될 수 있습니다. 그러나 약세가 계속해서 지배한다면 $20까지 하락할 수 있습니다. 50주 MA도 200주 MA보다 낮아 하락세가 이제 시장을 장악하고 있음을 나타냅니다.
Weekly Crypto Price Analysis Conclusion
주간 암호화폐 가격 분석 결론
In conclusion, despite some minor price surges in certain cryptocurrencies, overall bearish sentiment remains strong in the crypto market. Bulls must work hard to turn the tide and push prices back up, with many major coins trading below crucial support levels. Monitor key resistance levels and market trends for potential trading opportunities in the coming weeks.
결론적으로, 특정 암호화폐의 약간의 가격 급등에도 불구하고 암호화폐 시장에서는 전반적인 약세 정서가 여전히 강합니다. 강세론자들은 많은 주요 코인들이 중요한 지지선 아래에서 거래되는 상황에서 상황을 바꾸고 가격을 다시 끌어올리기 위해 열심히 노력해야 합니다. 앞으로 몇 주 동안 잠재적인 거래 기회에 대한 주요 저항 수준과 시장 추세를 모니터링하십시오.
 Crypto Daily™
 Crypto Daily™
 DogeHome
 TheCoinrise Media
 Thecoinrepublic.com
 TheCoinrise Media
 TheCoinrise Media
 Cryptopolitan_News


