

Weekly crypto price analysis reveals that most cryptocurrencies have been trading around the support levels, with bearish momentum dominating the market. Bitcoin and most major altcoins are plummeting, but the charts suggest a recovery could be around the corner. The BTC has dropped below $27k after a considerable sell-off.
每週加密貨幣價格分析顯示,大多數加密貨幣一直在支撐位附近交易,看跌勢頭主導市場。比特幣和大多數主要山寨幣正在暴跌,但圖表表明復甦可能即將到來。經過大幅拋售後,BTC 已跌至 2.7 萬美元以下。
Ethereum (ETH) has been hit hard by the recent market downturn and is currently trading below $1,600. The selling pressure on ETH has been significant, but it has found support at this level. The BNB token, the native cryptocurrency of the Binance exchange, has also been affected by the market downturn and is trading below $210.
以太坊(ETH)受到近期市場低迷的嚴重打擊,目前交易價格低於 1,600 美元。 ETH 的拋售壓力很大,但在該水平上找到了支撐。幣安交易所的原生加密貨幣BNB代幣也受到市場低迷的影響,交易價格低於210美元。
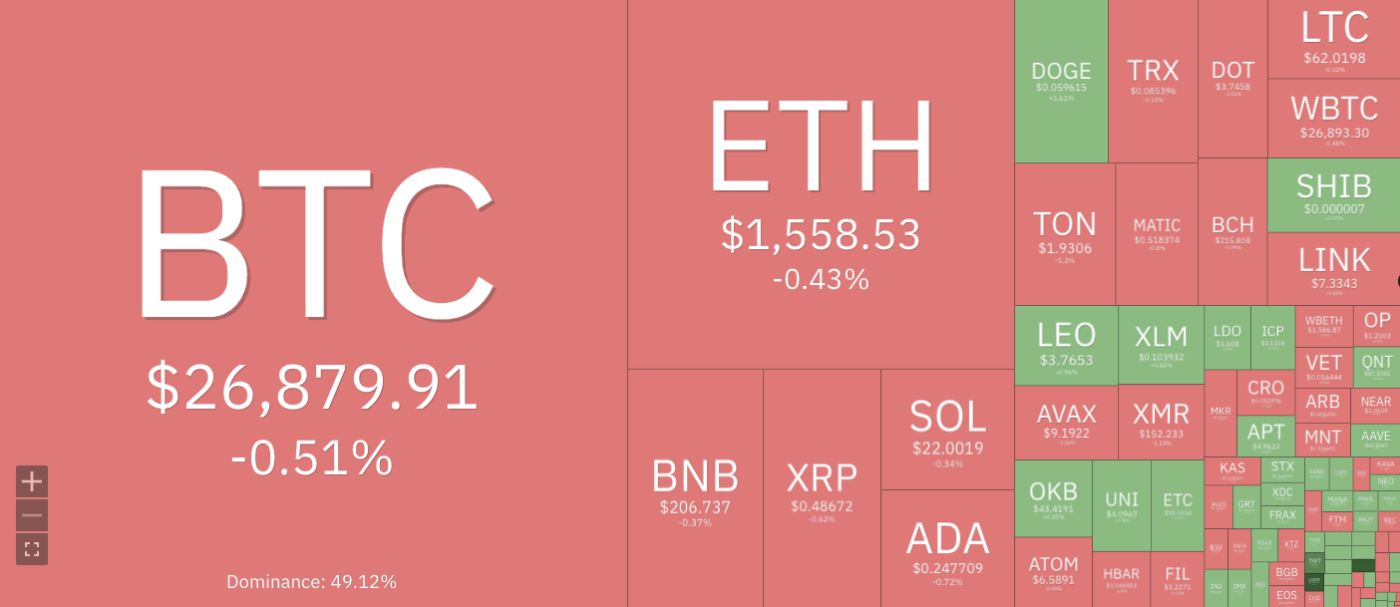
Cryptocurrencies Price Heatmap, Source: Coin360
加密貨幣價格熱圖,來源:Coin360
XRP, the fourth-largest cryptocurrency by market cap, has also been downward in the past few days, with bulls and bears fighting for control. Dogecoin (DOGE), the meme-inspired cryptocurrency, has also been experiencing a significant drop in its price, with a current value of around $0.0590 levels after bulls failed to maintain the $0.0650 resistance level. The Cardano (ADA) price has also steadily declined, breaking below the $0.300 support level and trading at around $0.2470.
以市值計算的第四大加密貨幣 XRP 在過去幾天也出現下跌,多頭和空頭爭奪控制權。受模因啟發的加密貨幣狗狗幣 (DOGE) 的價格也經歷了大幅下跌,在多頭未能維持 0.0650 美元的阻力位後,目前價值約為 0.0590 美元。卡爾達諾(ADA)價格也穩定下跌,跌破 0.300 美元的支撐位,交易價格約為 0.2470 美元。
BTC/USD
比特幣/美元
Bitcoin price analysis shows that BTC has been trading in a bearish trend since the start of the week, with some bullish momentum seen at the start of the week. However, this was short-lived, as bears returned to the market later in the week. The BTC/USD pair currently trades around $26,874, with a 24-hour surge of -4.35%. The overall market sentiment for BTC is still bearish, with the key resistance level observed at $28k and support at $25k.
比特幣價格分析顯示,自本周初以來,BTC 一直處於看跌趨勢,但本周初出現了一些看漲勢頭。然而,這種情況是短暫的,空頭在本週晚些時候重返市場。 BTC/USD目前交易價格約26,874美元,24小時漲幅為-4.35%。 BTC 的整體市場情緒仍然看跌,關鍵阻力位為 28,000 美元,支撐位為 25,000 美元。
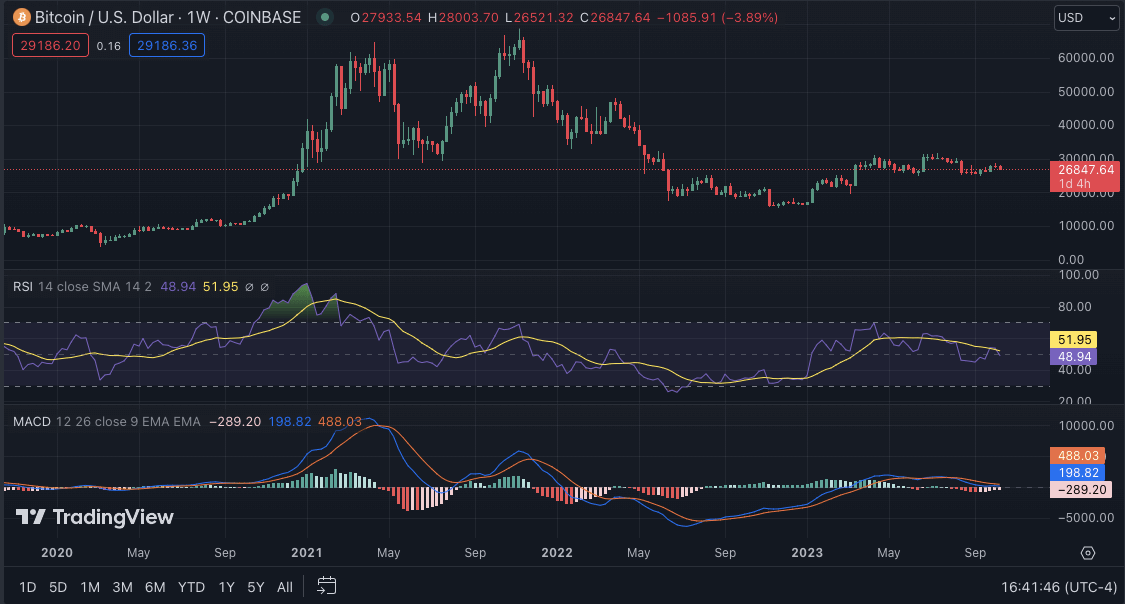
BTC/USD weekly chart, source: TradingView
BTC/美元週線圖,資料來源:TradingView
BTC fell below the 20-EMA and the 50-EMA, indicating a strong bearish trend. The 50-EMA is also below the 200-EMA, with significant downward pressure. The MACD indicator indicates bearish divergence, with the MACD line remaining below the signal line. The Relative Strength Index (RSI) has also been trending down around the 40 levels, indicating a downward trend for BTC.
BTC跌破20日均線及50日均線,顯示看跌趨勢強勁。 50 日均線也低於 200 日均線,下行壓力較大。 MACD 指標顯示看跌背離,MACD 線仍低於訊號線。相對強弱指數(RSI)也一直在 40 水平附近呈下降趨勢,顯示 BTC 呈下降趨勢。
ETH/USD
以太坊/美元
Ethereum price analysis shows that ETH has been trading below its key support level of $1,600 for the past few days. The second-largest cryptocurrency by market cap currently trades at around $1,554 with a 24-hour surge of -0.78%. The bearish sentiment for ETH is still strong, with the key resistance level observed at $1,700 and support at $1,500. If bears continue to dominate, a further drop toward the $1,400 level could be seen; however, if bulls manage to take control, ETH could see a push toward the $1,800 level.
以太坊價格分析顯示,過去幾天 ETH 的交易價格一直低於 1,600 美元的關鍵支撐位。以市值計算的第二大加密貨幣目前交易價格約為 1,554 美元,24 小時漲幅為 -0.78%。 ETH 的看跌情緒依然強勁,關鍵阻力位在 1,700 美元,支撐位在 1,500 美元。如果空頭繼續佔據主導地位,則可能會進一步跌向 1,400 美元水準;然而,如果多頭設法控制局面,ETH 可能會推向 1,800 美元的水平。
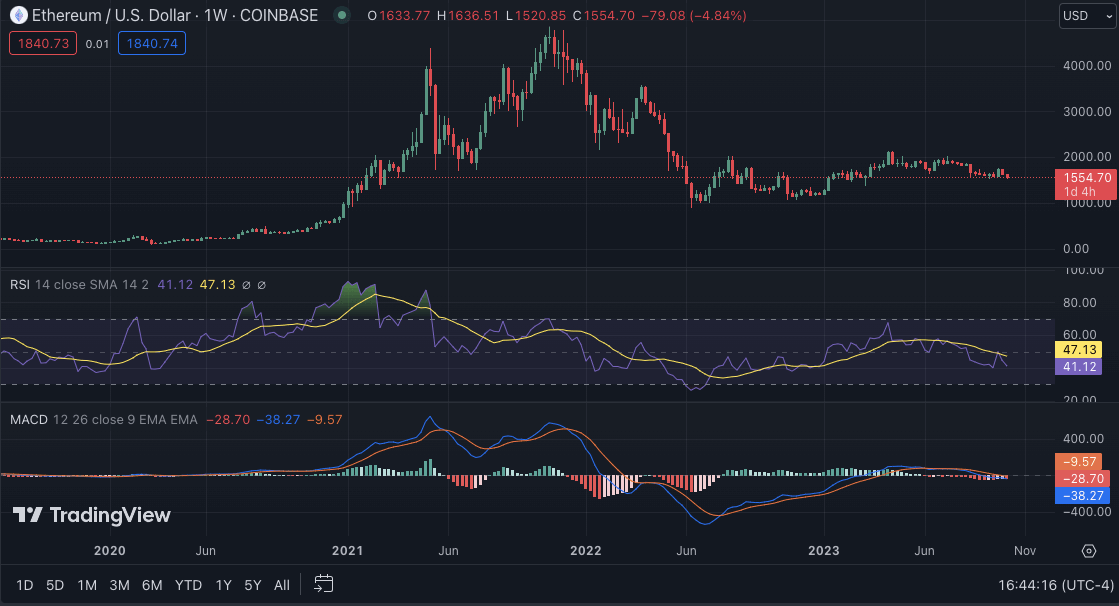
ETH/USD weekly chart, source: TradingView
ETH/美元週線圖,來源:TradingView
The MACD indicator shows bearish momentum as it has formed a negative crossover. The RSI is currently hovering near 40, suggesting that bears are slowly gaining market control. The 50-weekly MA is below the 200-weekly MA, indicating that the price will likely remain bearish soon. The moving averages have been in neutral territory, meaning ETH could consolidate before making its next move.
MACD 指標顯示看跌勢頭,因為它已形成負交叉。 RSI 目前徘徊在 40 附近,表明空頭正在慢慢獲得市場控制權。 50 週均線低於 200 週均線,表明價格可能很快就會保持看跌。移動平均線一直處於中性區域,這意味著 ETH 可能會在採取下一步行動之前進行盤整。
BNB/USD
幣安幣/美元
The weekly price analysis for Binance Coin (BNB) reveals that bears have controlled the market for the past few days. On October 08, BNB broke and closed below the symmetrical triangle pattern, signifying that bears prevailed over bulls. The selling pressure increased on October 12, and the BNB/USD pair fell below the crucial $205 support level. At the time of writing, BNB is trading at $206, with a minimal surge of 0.58% in the past 24 hours; however, in the past seven days, BNB has recorded a -2.56% loss. The market sentiment for BNB is still bearish, with the key resistance level observed at $235 and support at $200.
幣安幣(BNB)的每週價格分析顯示,空頭在過去幾天控制了市場。 10 月 8 日,BNB 突破並收於對稱三角形下方,顯示空頭擊敗多頭。 10 月 12 日拋售壓力加大,BNB/美元跌破關鍵的 205 美元支撐位。截至本文撰寫時,BNB 交易價格為 206 美元,過去 24 小時內小幅上漲 0.58%;然而,在過去的7天裡,BNB卻錄得-2.56%的損失。 BNB 的市場情緒仍然看跌,關鍵阻力位為 235 美元,支撐位為 200 美元。
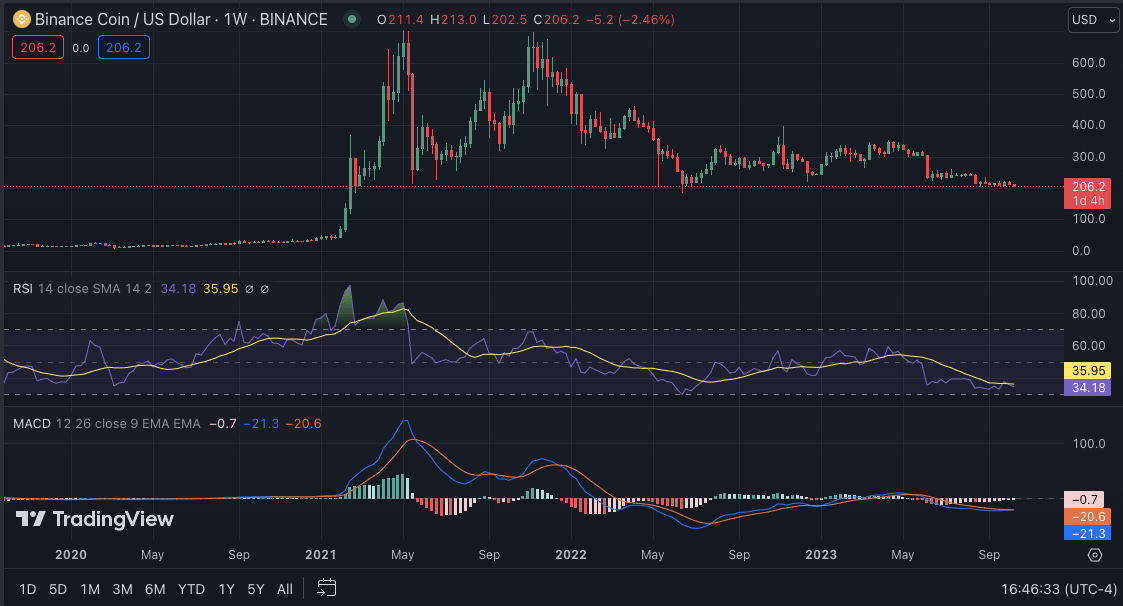
BNB/USD weekly chart, source: TradingView
BNB/美元週線圖,來源:TradingView
The MACD and signal lines have crossed over in a bearish divergence, indicating that bears dominate the market and could continue to push the price down soon. The RSI is also currently trending in the bearish zone, suggesting that BNB could see further losses before a bullish trend emerges.
MACD 和訊號線已形成看跌背離,表明空頭主導市場,並可能很快繼續壓低價格。 RSI 目前也處於看跌區域,這表明 BNB 在看漲趨勢出現之前可能會進一步下跌。
XRP/USD
瑞波幣/美元
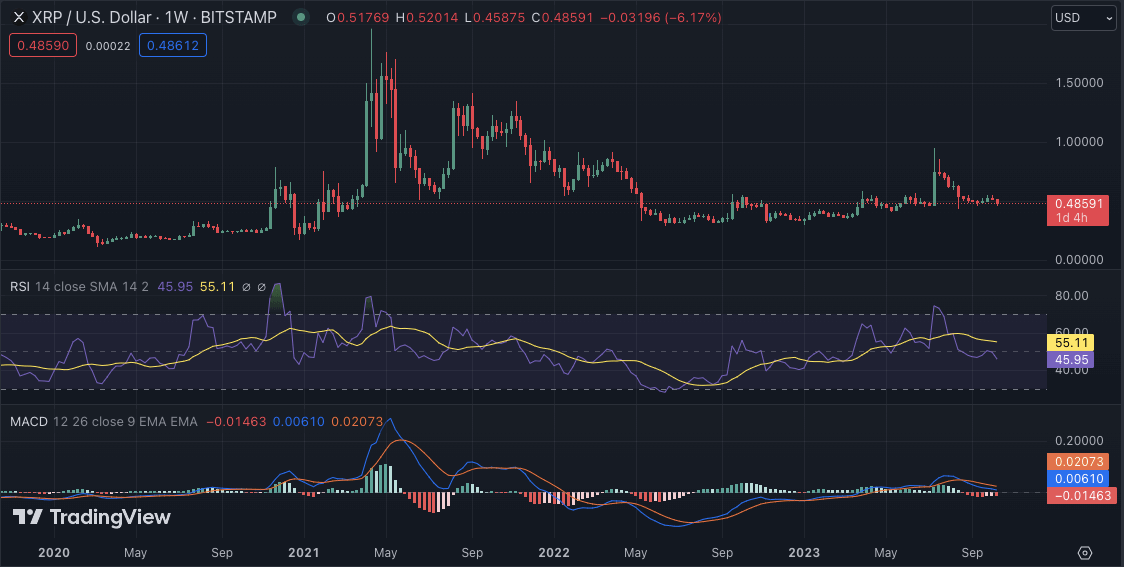
XRP price analysis shows that bears have controlled the market for most of the week, pushing the price to record lows. In the past seven days, XRP has seen a -6.70% loss in its value and is currently trading at $0.4864, with a 24-hour surge of -0.61%. After the SEC’s lawsuit against Ripple, the market sentiment for XRP has been bearish, with the key resistance level observed at $0.550 and support at $0.450. The price of XRP is currently below the 200-EMA, indicating a strong bearish trend in the near future.
XRP 價格分析顯示,本周大部分時間空頭控制了市場,將價格推至歷史低點。過去 7 天,XRP 價值下跌 -6.70%,目前交易價格為 0.4864 美元,24 小時飆升 -0.61%。在 SEC 對 Ripple 提起訴訟後,XRP 的市場情緒一直看跌,關鍵阻力位為 0.550 美元,支撐位為 0.450 美元。 XRP 的價格目前低於 200 均線,顯示近期將出現強勁的看跌趨勢。
XRP/USD weekly chart, source: TradingView
XRP/美元週線圖,來源:TradingView
The MACD indicator also shows that bears dominate, as the MACD line is below the signal line. The RSI has been trending down and is currently hovering around 40, which indicates a bearish trend for XRP. The 20-SMA is below the 50-SMA, indicating that the bears still control the market. If bulls push the price above the $0.550 level, XRP could recover towards $0.600; however, if they fail, XRP could break further below its current support level.
MACD 指標也顯示空頭佔據主導地位,因為 MACD 線位於訊號線下方。 RSI一直呈下降趨勢,目前徘徊在40左右,顯示XRP有看跌趨勢。 20 移動平均線低於 50 移動平均線,表示空頭仍控制市場。如果多頭將價格推高至 0.550 美元以上,XRP 可能會回升至 0.600 美元;然而,如果他們失敗,XRP 可能會進一步跌破目前的支撐位。
DOGE/USD
狗狗幣/美元
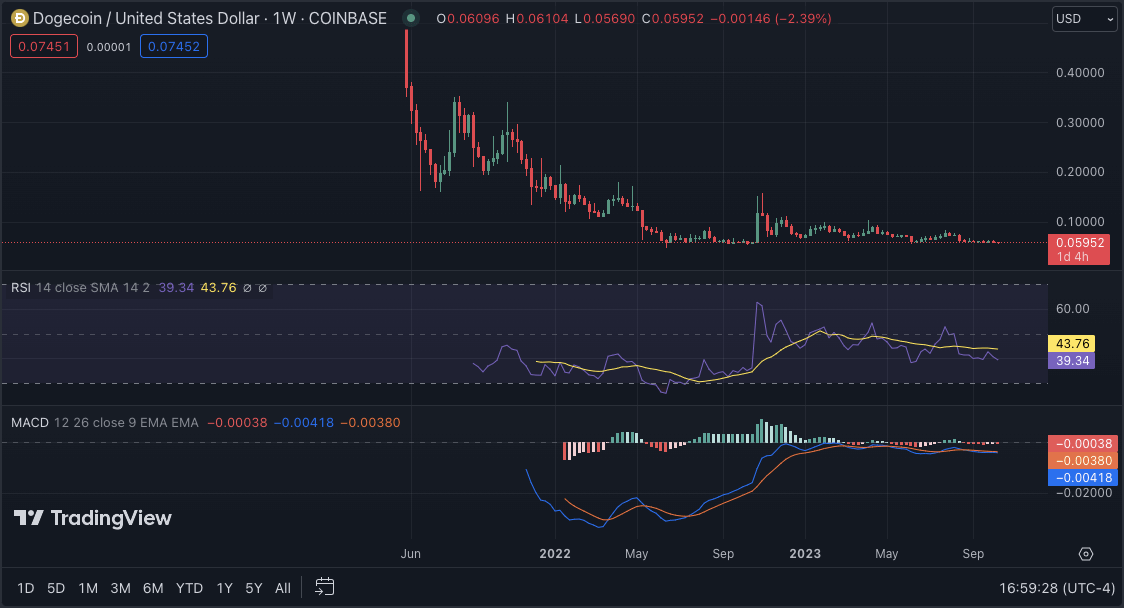
Wikely crypto market price analysis for Dogecoin (DOGE) shows that bears have dominated the market, with DOGE trading below its crucial support level of $0.0600. The meme-inspired cryptocurrency currently trades at $0.05878, with a 24-hour surge of -0.55% and a seven-day decrease of -2.67%. The bears and bulls have been fighting for control, and the market sentiment is still bearish, with the key resistance level observed at $0.063 and support at $0.055.
Wikely 對狗狗幣 (DOGE) 的加密貨幣市場價格分析顯示,空頭主導了市場,DOGE 的交易價格低於 0.0600 美元的關鍵支撐位。這種受 meme 啟發的加密貨幣目前交易價格為 0.05878 美元,24 小時飆升 -0.55%,7 天下跌 -2.67%。空頭和多頭一直在爭奪控制權,市場情緒仍然偏空,關鍵阻力位在0.063美元,支撐位為0.055美元。
DOGE/USD weekly chart, source: TradingView
DOGE/USD 週線圖,來源:TradingView
The moving averages show a strong bearish trend, with the 20-EMA below the 50-EMA and both below the 200-EMA. The MACD indicator also shows that bears are still in control, as the MACD line is below the signal line. The RSI has been trending down and is currently hovering around 39, indicating a bearish trend for DOGE. If bulls push the price above the $0.063 level, DOGE could see a rally toward $0.070; however, if bears continue to dominate, a further drop toward $0.050 could be seen.
移動平均線顯示出強烈的看跌趨勢,20 日均線低於 50 日均線,且均低於 200 日均線。 MACD 指標也顯示空頭仍處於控制之中,因為 MACD 線位於訊號線下方。 RSI一直呈下降趨勢,目前徘徊在39左右,顯示DOGE呈現看跌趨勢。如果多頭將價格推高至 0.063 美元以上,DOGE 可能會上漲至 0.070 美元;然而,如果空頭繼續佔據主導地位,則可能會進一步跌向 0.050 美元。
ADA/USD
艾達/美元
According to the weekly price analysis, Cardano (ADA) has been trading within a range of $0.2585-0.2430 for the past week, with a light downward trend. The coin had briefly crossed above $0.2500, only to see it slipping back down again due to strong bearish pressure from the markets. At the time of writing, ADA is currently trading at around $0.2471, with the support of the coin being quite weak.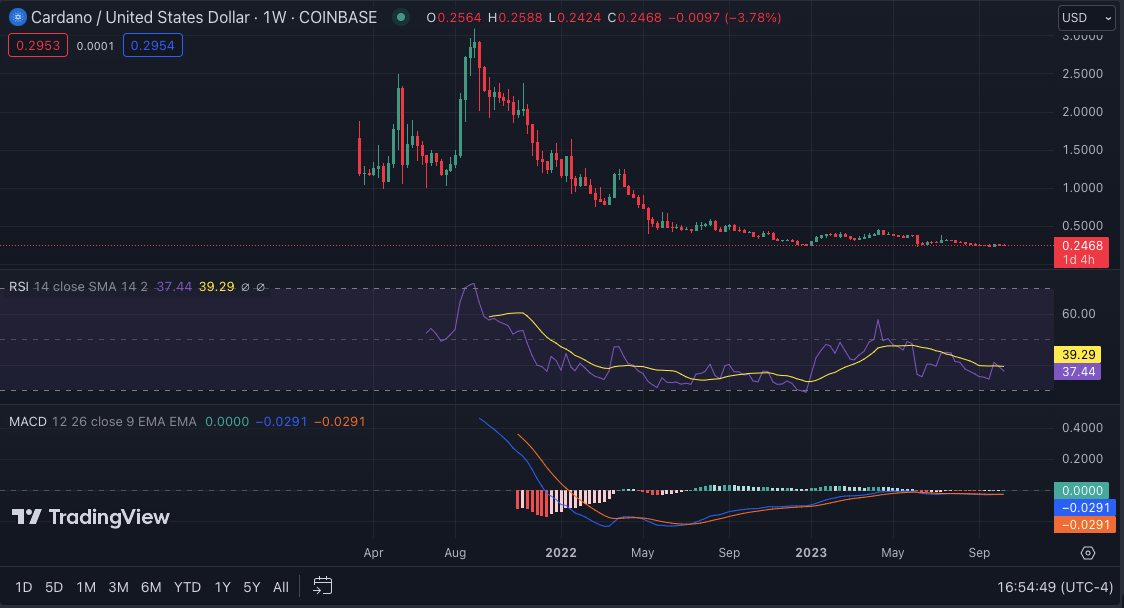
根據每週價格分析,卡爾達諾(ADA)過去一週一直在 0.2585-0.2430 美元區間內交易,呈現小幅下跌趨勢。該代幣曾短暫突破 0.2500 美元上方,但由於市場強勁的看跌壓力,其再次下滑。截至撰寫本文時,ADA 目前的交易價格約為 0.2471 美元,該代幣的支撐相當弱。
ADA/USD weekly chart, source: TradingView
ADA/美元週線圖,來源:TradingView
The RSI is close to the 37 levels, indicating that selling pressure is increasing and that further losses could be in store for this currency. The MACD remains bearish, and a break below the $0.25000 support level could lead to further declines in the near term. The 20-EMA is moving below the 50-EMA, meaning bears dominate the market. The MACD is also in the red, indicating that bearish sentiment is strong.
RSI 接近 37 水平,表明拋售壓力正在增加,該貨幣可能會進一步下跌。 MACD 仍然看跌,跌破 0.25000 美元支撐位可能會導致近期進一步下跌。 20 日均線正在低於 50 日均線,這意味著空頭主導市場。 MACD也呈現紅色,顯示看空情緒較強。
SOL/USD
索爾/美元
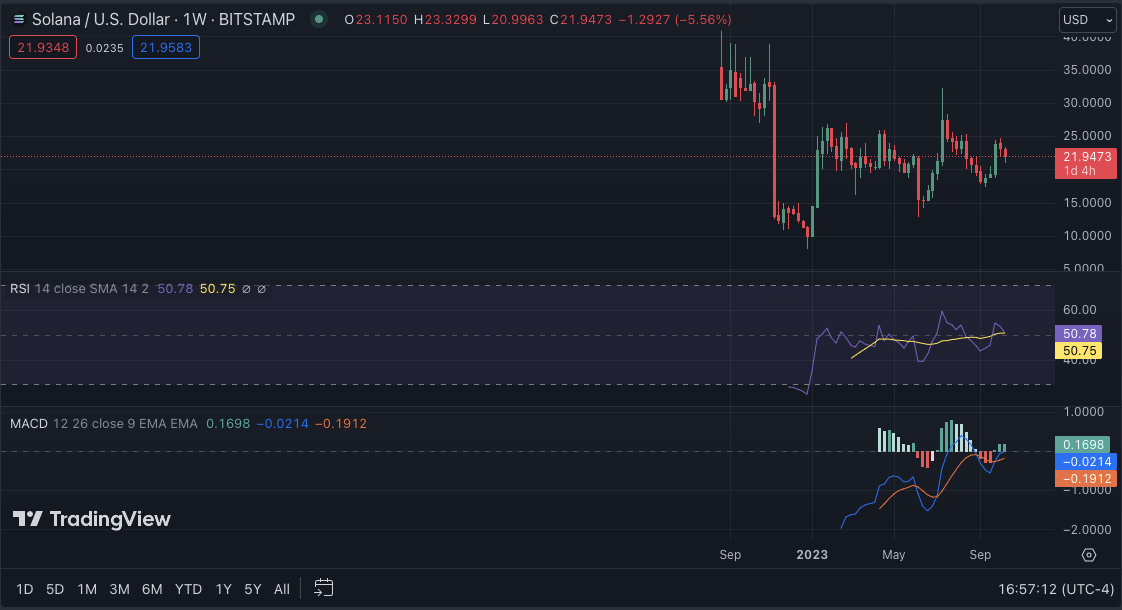
The altcoin Solana (SOL) has been one of the top losses this week, with a price decrease of over 5.33% in the past seven days. SOL is currently trading at $21.98, with a 24-hour gain of 1.74%. The market sentiment for SOL is still bearish, with the key resistance level observed at $25 and support at $20. The coming week will be crucial for SOL, with bulls and bears fighting for control.
山寨幣 Solana (SOL) 是本週跌幅最大的貨幣之一,過去 7 天價格下跌超過 5.33%。 SOL目前交易價格為21.98美元,24小時漲幅為1.74%。 SOL 的市場情緒仍然看跌,關鍵阻力位為 25 美元,支撐位為 20 美元。未來一周對 SOL 來說至關重要,多頭和空頭將爭奪控制權。
SOL/USD weekly chart, source: TradingView
SOL/USD 週線圖,來源:TradingView
The MACD indicator shows that bears dominate the market, with the signal line above the MACD line. The RSI is currently hovering around 45, indicating a bearish sentiment for SOL. However, if bulls push the price above $25, SOL could recover towards $30; however, if bears continue to dominate, a drop towards $20 could be seen. The 50-weekly MA is also below the 200-weekly MA, indicating that bears are now in market control.
MACD指標顯示空頭主導市場,訊號線位於MACD線上方。 RSI 目前徘徊在 45 左右,顯示 SOL 的看跌情緒。然而,如果多頭將價格推高至 25 美元以上,SOL 可能會回升至 30 美元;然而,如果空頭繼續佔據主導地位,則價格可能會跌至 20 美元。 50 週均線也低於 200 週均線,顯示空頭現在控制了市場。
Weekly Crypto Price Analysis Conclusion
每週加密貨幣價格分析結論
In conclusion, despite some minor price surges in certain cryptocurrencies, overall bearish sentiment remains strong in the crypto market. Bulls must work hard to turn the tide and push prices back up, with many major coins trading below crucial support levels. Monitor key resistance levels and market trends for potential trading opportunities in the coming weeks.
總之,儘管某些加密貨幣的價格略有上漲,但加密貨幣市場的整體看跌情緒仍然強勁。多頭必須努力扭轉局勢並推高價格,因為許多主要代幣的交易價格都低於關鍵支撐位。監控關鍵阻力位和市場趨勢,尋找未來幾週潛在的交易機會。
 Crypto Daily™
 Crypto Daily™
 DogeHome
 TheCoinrise Media
 Thecoinrepublic.com
 TheCoinrise Media
 TheCoinrise Media
 Cryptopolitan_News


