Dogecoin Expected to Maintain Uptrend, Analysts Say
ドージコインは上昇傾向を維持すると予想、アナリストらは語る
Dogecoin (DOGE), the prominent meme coin, continues to thrive in the positive zone, boasting a 1.68% weekly gain. Amidst bearish market conditions, DOGE has held onto its gains, and analysts are expressing optimism regarding its continued upward trajectory.
著名なミームコインであるドージコイン(DOGE)はプラスゾーンで成長を続けており、週間で1.68%の上昇を誇っています。弱気の市場環境の中でもDOGEは上昇を維持しており、アナリストらは同社の継続的な上昇軌道に楽観的な見方を示している。
Historical Analysis
歴史分析
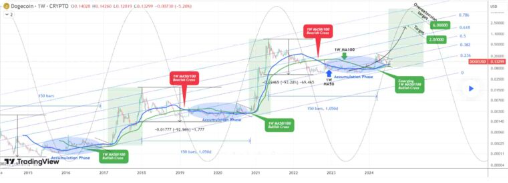
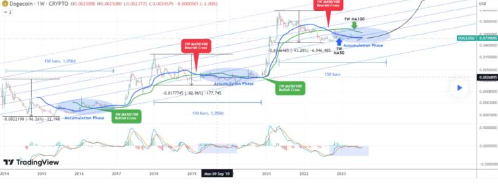
According to TradingShot, a recent chart indicates that Dogecoin may be mirroring past price patterns. From 2014 to 2017, DOGE underwent a decline followed by a consolidation phase. Over this three-year period, its price plummeted by 96.26%, reaching a low of $0.002198. After this decline, DOGE consolidated for approximately 1,050 days (150 weeks).
TradingShot によると、最近のチャートはドージコインが過去の価格パターンを反映している可能性があることを示しています。 2014 年から 2017 年にかけて、DOGE は衰退し、その後統合段階に入りました。この 3 年間で、価格は 96.26% 急落し、最低値は 0.002198 ドルに達しました。この下落の後、DOGE は約 1,050 日 (150 週間) にわたり安定しました。

From 2017 to 2018, the price rallied, but reversed course between 2018 and 2019, experiencing a 92.96% decline. This cycle continued, leading to another accumulation phase after reaching a bottom.
2017年から2018年にかけて価格は上昇しましたが、2018年から2019年にかけて反転し、92.96%下落しました。このサイクルが続き、底に達した後、別の蓄積段階に至りました。
Since 2020, Dogecoin has been accumulating again. Current price movements appear to parallel previous events, suggesting further consolidation before a potential breakout.
2020年以降、ドージコインは再び蓄積されています。現在の価格変動は過去の出来事と平行しているように見え、潜在的なブレイクアウトの前にさらなる値固めが行われることを示唆しています。
Technical Indicators
テクニカル指標
Examining the DOGE chart, the initial support level is between $0.07 and $0.08, reinforced by the 1-week moving average. This level has provided support during past accumulation phases and could indicate an impending breakout.
DOGE チャートを調べると、最初のサポート レベルは 0.07 ドルから 0.08 ドルの間であり、1 週間の移動平均によって補強されています。このレベルは過去の蓄積段階でサポートを提供しており、差し迫ったブレイクアウトを示す可能性があります。
The next significant support is around $0.002198, a crucial level in previous accumulation phases.
次に重要なサポートは約 0.002198 ドルで、これは以前の蓄積段階での重要なレベルです。

On the resistance side, the 0.236 Fibonacci retracement level at $0.20 is a key point. Surpassing this level is essential for the uptrend to gather momentum. The resistance at the 0.618 Fibonacci level, around $2, remains distant at this time.
レジスタンス面では、0.20ドルの0.236フィボナッチリトレースメントレベルが重要なポイントとなる。上昇トレンドが勢いを増すには、このレベルを超えることが不可欠です。現時点では、2ドル付近の0.618フィボナッチレベルの抵抗線はまだ遠い。


 crypto.ro English
 DogeHome
 Crypto News Land
 ETHNews
 CFN
CFN U_Today
 Thecoinrepublic.com
 Optimisus


