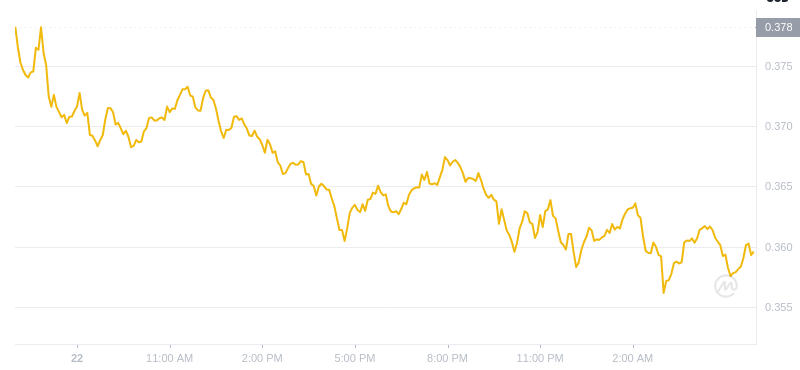
Dogecoin's Potential Upward Trajectory
ドージコインの潜在的な上昇軌道
Dogecoin (DOGE) has exhibited a positive trend, with a 1.68% weekly gain despite the overall market downturn. Analysts are confident in its sustained upward trend based on historical price patterns.
ドージコイン (DOGE) は、市場全体の低迷にもかかわらず、週間で 1.68% 上昇し、プラスの傾向を示しました。アナリストは、過去の価格パターンに基づいて、その持続的な上昇傾向に自信を持っています。
Examining DOGE's Historical Behavior
DOGE の歴史的行動の調査
From 2014 to 2017, DOGE experienced a 96.26% decline, reaching a low of $0.002198. This was followed by a prolonged consolidation period of approximately 1,050 days. Between 2017 and 2018, DOGE surged only to face another significant drop of 92.96% between 2018 and 2019. This cyclical pattern suggests DOGE may be entering another accumulation period akin to previous cycles.
2014 年から 2017 年にかけて、DOGE は 96.26% 下落し、最低値は 0.002198 ドルに達しました。その後、約 1,050 日間にわたる長期にわたる統合期間が続きました。 2017年から2018年にかけてDOGEは急騰したが、2018年から2019年にかけて再び92.96%という大幅な下落に直面した。この循環パターンは、DOGEが以前のサイクルと同様の新たな蓄積期間に入っている可能性を示唆している。
Dogecoin's Current Trajectory
ドージコインの現在の軌跡
Since 2020, DOGE has entered a new accumulation phase. Historical trends indicate that this phase often precedes a breakout, mirroring previous cycles of decline, consolidation, and subsequent rally.
2020 年以降、DOGE は新たな蓄積段階に入りました。過去の傾向によれば、この段階はブレイクアウトに先立って起こることが多く、これまでの下落、地合い、その後の上昇のサイクルを反映しています。
DOGE's Future Prospects
DOGEの将来展望
The current Dogecoin chart indicates a primary support level between $0.07 and $0.08, reinforced by the 1-week moving average line. This level has been historically crucial during accumulation phases. A deeper support level around $0.002198 also aligns with past critical thresholds.
現在のドージコインのチャートは、1週間の移動平均線によって強化された、0.07ドルから0.08ドルの間の主要なサポートレベルを示しています。このレベルは歴史的に蓄積段階において非常に重要でした。 0.002198ドル付近のより深いサポートレベルも、過去の重大なしきい値と一致しています。
For resistance, the 0.236 Fibonacci retracement level at $0.20 is vital. Overcoming this point is essential for sustaining upward momentum. The 0.618 Fibonacci level near $2 remains a long-term target, albeit considered optimistic at present.
レジスタンスとしては、0.20ドルの0.236フィボナッチリトレースメントレベルが重要です。上昇の勢いを維持するには、この点を克服することが不可欠です。現時点では楽観的とみなされているものの、2ドル付近の0.618フィボナッチレベルは依然として長期的な目標である。
Investor Takeaways
投資家向けのポイント
- Historical patterns suggest DOGE is in an accumulation phase.
- Key support resides between $0.07 and $0.08.
- Substantial resistance exists at the 0.236 Fibonacci level, around $0.20.
- Long-term resistance at the 0.618 Fibonacci level, near $2, presents an optimistic target.
Conclusion
過去のパターンは、DOGE が蓄積段階にあることを示唆しています。主なサポートは 0.07 ドルから 0.08 ドルの間にあります。実質的な抵抗線は 0.20 ドル付近の 0.236 フィボナッチレベルに存在します。2 ドル付近の 0.618 フィボナッチレベルの長期抵抗線は、楽観的な目標を示しています。結論
Dogecoin's price movements appear to follow historical cycles of decline and consolidation, indicating potential for future growth. Investors should monitor key support and resistance levels to assess its future trajectory.
ドージコインの価格変動は歴史的な下落と統合のサイクルに従っているように見え、将来の成長の可能性を示しています。投資家は、主要な支持線と抵抗線のレベルを監視して、将来の軌道を評価する必要があります。


 DeFi Planet
 DogeHome
 crypto.news
 crypto.news
 Crypto Intelligence
 Crypto Daily™
 BH NEWS
 COINTURK NEWS
 TheNewsCrypto


