

Dogecoin's network has expanded significantly, with the total number of wallet addresses reaching a new all-time high of 83.48 million, according to crypto expert Ali on X (formerly Twitter). This highlights continued interest in the meme-based cryptocurrency. Dogecoin's price also saw a 6.12% increase in the past 24 hours, sparking discussion about its future price movement.
X(以前のTwitter)のCrypto Expert Aliによると、DogeCoinのネットワークは大幅に拡大し、ウォレットアドレスの総数は8348百万の新しい史上最高値に達しました。 これは、ミームベースの暗号通貨に対する継続的な関心を強調しています。 Dogecoinの価格は、過去24時間で6.12%増加し、将来の価格移動について議論を引き起こしました。
On-chain metrics demonstrate consistent growth in DOGE holders, despite price volatility. This increase in addresses suggests ongoing engagement, whether through long-term investment or portfolio diversification. Historically, increased network adoption has been a positive indicator of long-term market strength.
オンチェーンメトリックは、価格のボラティリティにもかかわらず、Doge保有者の一貫した成長を示しています。 この住所の増加は、長期投資であろうとポートフォリオの多様化を通じて、継続的な関与を示唆しています。歴史的に、ネットワークの採用の増加は、長期的な市場の強さの肯定的な指標でした。
The price trajectory presents a contrasting narrative. Since late January, DOGE's price has fallen from approximately $0.30 to $0.18, with a brief recovery in early March followed by renewed downward pressure. The discrepancy between growing addresses and price stagnation raises questions about the cryptocurrency's current market dynamics.
価格の軌跡は対照的な物語を提示します。 1月下旬以来、Dogeの価格は約0.30ドルから0.18ドルに低下し、3月上旬に短時間回復した後、下向きの圧力が更新されました。 成長する住所と価格の停滞の矛盾は、暗号通貨の現在の市場のダイナミクスに関する疑問を提起します。
Dogecoin Technical Analysis
DogeCoinテクニカル分析
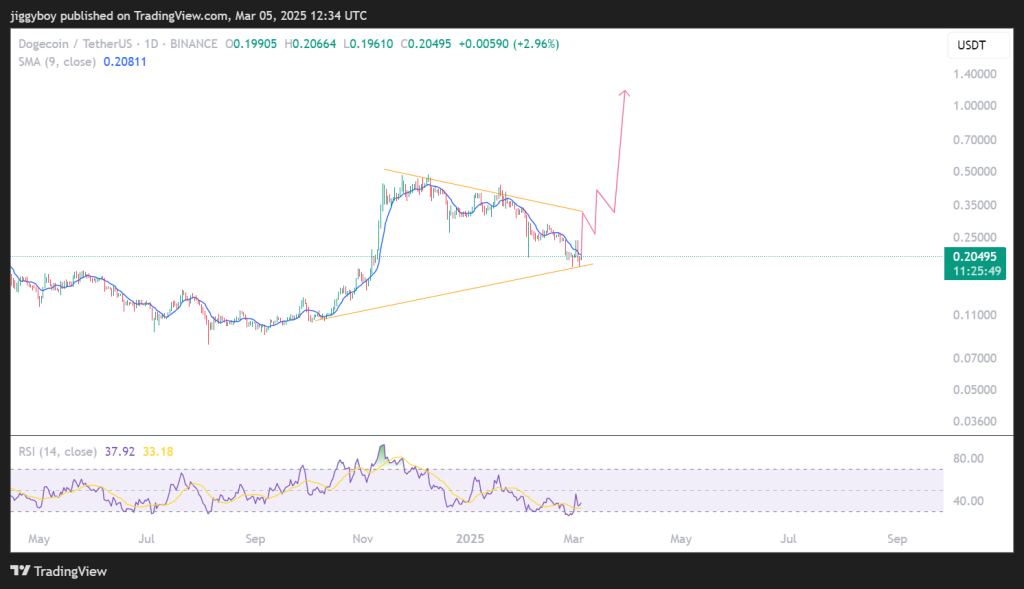
Chart analysis suggests DOGE's price is trading within a descending wedge pattern, often considered a bullish formation. This suggests a potential turning point. A break above the $0.24 resistance level could trigger a significant rally, with optimistic predictions ranging from $0.30 to as high as $1.00.
チャート分析は、Dogeの価格が下降するウェッジパターン内で取引されていることを示唆しており、しばしば強気の形成と考えられています。これは、潜在的なターニングポイントを示唆しています。 0.24ドルのレジスタンスレベルを超えるブレークは、$ 0.30から1.00ドルまでの範囲の楽観的な予測により、重要な集会を引き起こす可能性があります。
The $0.19 support level remains intact after withstanding multiple tests. The 9-day SMA at $0.208 acts as short-term resistance. The RSI at 37.92 indicates DOGE is approaching oversold conditions, increasing the likelihood of a price reversal.
複数のテストに耐えた後、0.19ドルのサポートレベルはそのままです。 0.208ドルの9日間のSMAは、短期抵抗として機能します。 37.92のRSIは、Dogeが売られすぎている状態に近づいており、価格の逆転の可能性を高めていることを示しています。
DOGE Key Levels to Watch
見るべきキーレベル
Traders are closely monitoring the $0.24 resistance level. A break above this level, accompanied by high trading volume, would confirm a bullish trend. Conversely, failure to hold the $0.19 support could lead to further selling pressure. Volume analysis will be crucial in determining whether the asset is gaining genuine momentum or experiencing a temporary relief rally.
トレーダーは、0.24ドルのレジスタンスレベルを綿密に監視しています。高い取引量を伴うこのレベルを超えるブレークは、強気の傾向を確認します。逆に、0.19ドルのサポートを保持できないと、さらなる販売圧力につながる可能性があります。ボリューム分析は、資産が真の勢いを獲得しているのか、それとも一時的な救援ラリーを経験しているのかを判断する上で重要です。
Given DOGE's recent 6.12% price increase, traders are seeking confirmation of an extended rally or a retest of lower support levels. The growing number of holders may support a long-term bullish outlook, but price action remains heavily influenced by broader market trends.
Dogeの最近の6.12%の価格上昇を考えると、トレーダーは延長ラリーまたは低いサポートレベルの再テストの確認を求めています。 保有者の増加は長期的な強気の見通しをサポートする可能性がありますが、価格アクションはより広範な市場動向に大きな影響を受けたままです。

The post This On-Chain Dogecoin Metric Hits ATH, But Where Is The DOGE Price Headed Next? appeared first on CaptainAltcoin.
このオンチェーンドガコインメトリックの投稿はATHにヒットしますが、Doge Priceは次の場所にありますか? Captainaltcoinに最初に登場しました。
 The Coin Republic
 BlockchainReporter
 TheCoinrise Media
 BlockchainReporter
 DogeHome
 CFN
CFN Cointelegraph
 CFN
CFN


