Dogecoin's Price Decline Persists
ドージコインの価格下落は続く
Dogecoin (DOGE) has fallen below $0.12, extending its seven-day decline. This has raised concerns among DOGE investors, who hold the top spot among meme coins by market capitalization. Significant selling pressure at the current price level is also impacting the situation negatively.
ドージコイン(DOGE)は0.12ドルを下回り、下落幅は7日間続いた。これは、ミームコインの時価総額でトップの座を保持しているDOGE投資家の間で懸念を引き起こしている。現在の価格水準での大きな売り圧力も状況に悪影響を及ぼしています。
Resistance and Support Levels for Dogecoin
ドージコインのレジスタンスレベルとサポートレベル
DOGE has experienced a 13.67% drop over the past week, leading to continued investor anxiety. Data from leading market intelligence provider IntoTheBlock presents a similar outlook.
DOGEは過去1週間で13.67%下落し、投資家の不安が続いている。大手市場インテリジェンスプロバイダーである IntoTheBlock のデータも同様の見通しを示しています。
According to IntoTheBlock, the In/Out of the Money Around Price (IOMAP) indicates potential selling pressure at the $0.11 level.
IntoTheBlock によると、マネーアラウンドプライス (IOMAP) のイン/アウトは、0.11 ドルレベルでの潜在的な売り圧力を示しています。

A higher number of addresses within a price range indicates stronger support or resistance at that level. On the left side of DOGE's price range (as shown in the graph above), 1.49 billion coins were purchased by 17,960 addresses, potentially preventing further price declines. However, 2.74 billion coins worth $300 million are held by 40,200 addresses on the right side.
価格範囲内のアドレスの数が多いほど、そのレベルでのサポートまたはレジスタンスがより強いことを示します。 DOGE の価格帯の左側 (上のグラフに示すように) では、17,960 のアドレスによって 14 億 9,000 万コインが購入され、さらなる価格下落を防ぐ可能性があります。ただし、3 億ドル相当の 27 億 4000 万コインが右側の 40,200 のアドレスに保持されています。
This region is seen as a significant resistance barrier, preventing a price recovery to the support level. Failure to break through this level may lead DOGE to drop to the next support levels between $0.10 and $0.09.
この地域は、価格がサポートレベルに回復するのを妨げる重要な抵抗障壁とみなされています。このレベルを突破できない場合、DOGEは0.10ドルから0.09ドルの間の次のサポートレベルに下落する可能性があります。
Will DOGE Recover?
DOGEは回復するでしょうか?
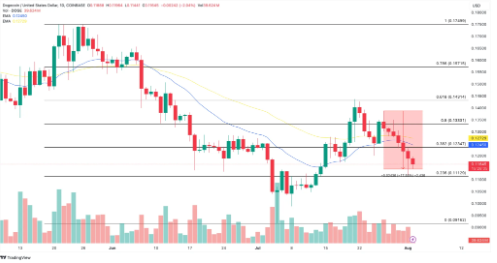
An analysis of the daily chart reveals that the price drop for DOGE started on July 27th, when it rose above $0.13. The decline over this period represents a 17.55% drop.
日次チャートを分析すると、DOGEの価格下落は0.13ドルを超えた7月27日に始まったことがわかります。この期間の減少は 17.55% の減少に相当します。
The Exponential Moving Average (EMA) provides insights into price direction. The EMA is a leading indicator that measures trend direction over a specific period.
指数移動平均 (EMA) は、価格の方向性に関する洞察を提供します。 EMA は、特定の期間におけるトレンドの方向性を測定する先行指標です。
At the time of writing, the 50 EMA (yellow) was below the 20 EMA (blue), indicating a downward trend.
執筆時点では、50 EMA (黄色) は 20 EMA (青色) を下回っており、下降傾向を示しています。

If the current situation continues, DOGE may find support at the $0.11 level. However, selling pressure on Dogecoin could push the price down to $0.09.
現在の状況が続けば、DOGEは0.11ドルレベルでサポートを受ける可能性がある。ただし、ドージコインに対する売り圧力により、価格は0.09ドルまで下落する可能性があります。
However, a "golden cross" formation, where the 50 EMA crosses above the 20 EMA, could invalidate the downward outlook and shift DOGE's trend upward. In this scenario, DOGE's price could rise to $0.12 or $0.13.
しかし、50EMAが20EMAを上抜ける「ゴールデンクロス」形成は、下降見通しを無効にし、DOGEのトレンドを上向きにシフトさせる可能性があります。このシナリオでは、DOGEの価格は0.12ドルまたは0.13ドルに上昇する可能性があります。


 COINTURK NEWS
 BH NEWS
 crypto.news
 DeFi Planet
 DogeHome
 Crypto News Flash
 BlockchainReporter
 Optimisus
 Thecryptoupdates


