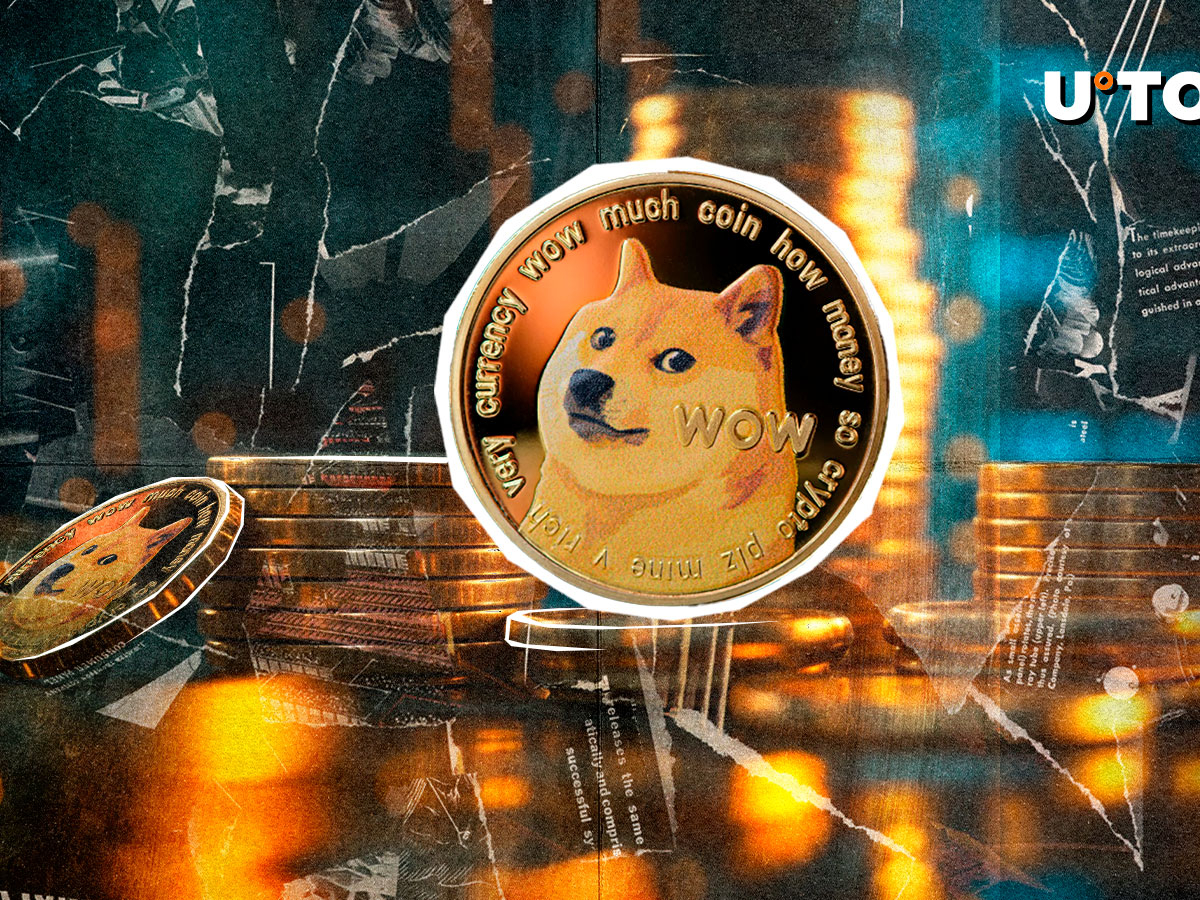
Dogecoin Price Analysis: Is Stabilization Signaling an End to Downward Trend?
ドージコイン価格分析:安定化は下降傾向の終焉を示しているのか?
Dogecoin has likely stabilized at its current price levels, with the Relative Strength Index (RSI) indicating potential improvement. The market is speculating whether this signals a reversal of the downward trend or further declines.
ドージコインは現在の価格レベルで安定している可能性が高く、相対強度指数(RSI)は改善の可能性を示しています。市場はこれが下降傾向の反転を示すのか、それともさらなる下落を示すのかを推測している。
Current Market Conditions
現在の市況
Dogecoin currently trades below its 50 EMA ($0.36), suggesting difficulty in regaining bullish momentum. Despite recent declines, selling pressure is minimal, as the RSI remains near 42. However, the lack of an oversold condition indicates potential for further drops.
ドージコインは現在、50EMA(0.36ドル)を下回って取引されており、強気の勢いを取り戻すのが難しいことを示唆している。最近の下落にもかかわらず、RSI は 42 付近を維持しているため、売り圧力は最小限です。しかし、売られ過ぎの状態ではないことは、さらなる下落の可能性を示しています。
Technical Analysis
テクニカル分析
A recent price pattern breakout has resulted in a descending structure. Dogecoin is now approaching its 100 EMA ($0.28), a crucial support level in case of further declines. If the price breaches this level, the 200 EMA ($0.22) will become the next critical support to monitor.
最近の価格パターンのブレイクアウトにより、下降構造が生じています。ドージコインは現在、さらなる下落の場合に重要なサポートレベルである100EMA(0.28ドル)に近づいています。価格がこのレベルを突破した場合、200EMA(0.22ドル)が次に監視すべき重要なサポートとなるでしょう。
Upside Potential
上振れの可能性
Dogecoin must break above the 50 EMA ($0.36) to restore optimism. A successful breakout could target resistance between $0.38 and $0.40. Past rally attempts have encountered strong resistance in this range.
楽観的な見方を取り戻すには、ドージコインが50EMA(0.36ドル)を上回る必要がある。ブレイクアウトが成功すれば、0.38ドルから0.40ドルの間の抵抗線を狙う可能性がある。過去の上昇の試みは、この範囲で強い抵抗に遭遇しました。
RSI Neutral Zone
RSIニュートラルゾーン
The RSI indicates a neutral position, neither oversold nor overbought. This aligns with the market's current sideways movement, suggesting it is awaiting a definitive signal for future price direction.
RSIは売られすぎでも買われすぎでもない中立のポジションを示します。これは市場の現在の横方向の動きと一致しており、将来の価格の方向性についての決定的なシグナルを待っていることを示唆しています。
Key Indicators to Monitor
監視すべき主要指標
Traders should monitor the RSI and price action around the 100 EMA. A bounce from this support level could signal recovery for DOGE, while failure to hold above it could trigger further selling pressure.
トレーダーはRSIと100EMA付近の価格動向を監視する必要があります。このサポートレベルからの反発はDOGEの回復を示す可能性があるが、このサポートレベルを超えて維持できなければさらなる売り圧力を引き起こす可能性がある。
Disclaimer:
免責事項:
- This article is for informational purposes only and not intended as financial advice.
- CSS styling and JavaScript code have been removed.
- Suspected advertising content has been filtered.
この記事は情報提供のみを目的としており、財務上のアドバイスを目的としたものではありません。CSS スタイルと JavaScript コードは削除されています。広告の疑いのあるコンテンツはフィルタされています。


 DT News
 DogeHome
 TheCoinrise
 Optimisus
 Optimisus
 COINTURK NEWS
 Crypto News Land
 Cryptopolitan_News
 BlockchainReporter


