

Date: Wed, March 19, 2025 | 07:30 AM GMT
日付:2025年3月19日水曜日| 07:30 AM GMT
Dogecoin (DOGE) has experienced a significant downturn since its November 2024 peak of $0.48 (reached December 8th), currently trading at $0.16 after a 53% correction over the past 90 days. 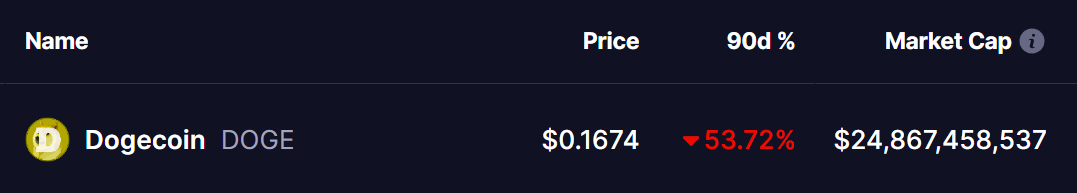
Dogecoin(Doge)は、2024年11月のピークピーク(12月8日に達した)のピーク以来、過去90日間の53%の修正の後、0.16ドルで取引されています。
Source: Coinmarketcap
出典:CoinMarketCap
Despite this decline, recent indicators suggest a potential bullish reversal. A surge in active addresses and key technical patterns point towards a possible upward trend.
この減少にもかかわらず、最近の指標は潜在的な強気の逆転を示唆しています。 アクティブなアドレスと主要な技術パターンの急増は、上昇傾向の可能性を示しています。
Surge in Active Addresses
アクティブアドレスの急増
Following the price correction, investor activity has increased significantly. Crypto analyst Ali Martinez reports a surge in active addresses, exceeding 280,000 and reaching 282,513. 
価格の修正に続いて、投資家の活動は大幅に増加しています。 暗号アナリストのアリ・マルティネスは、アクティブアドレスの急増を報告し、280,000を超えて282,513に達しました。
Source: @ali_charts (X)
出典:@ali_charts(x)
This heightened activity suggests investors see the current price as a buying opportunity. Historically, such increases in network activity have preceded substantial price movements.
この強化された活動は、投資家が現在の価格を購入の機会と見なしていることを示唆しています。 歴史的に、このようなネットワークアクティビティの増加は、大幅な価格の動きに先行してきました。
Key Technical Pattern
重要な技術パターン
Analyst @_CryptoSurf's analysis reveals DOGE has reached a critical support level, coinciding with both the 100-week and 200-week moving averages. This confluence is a significant technical event often signaling a trend shift. 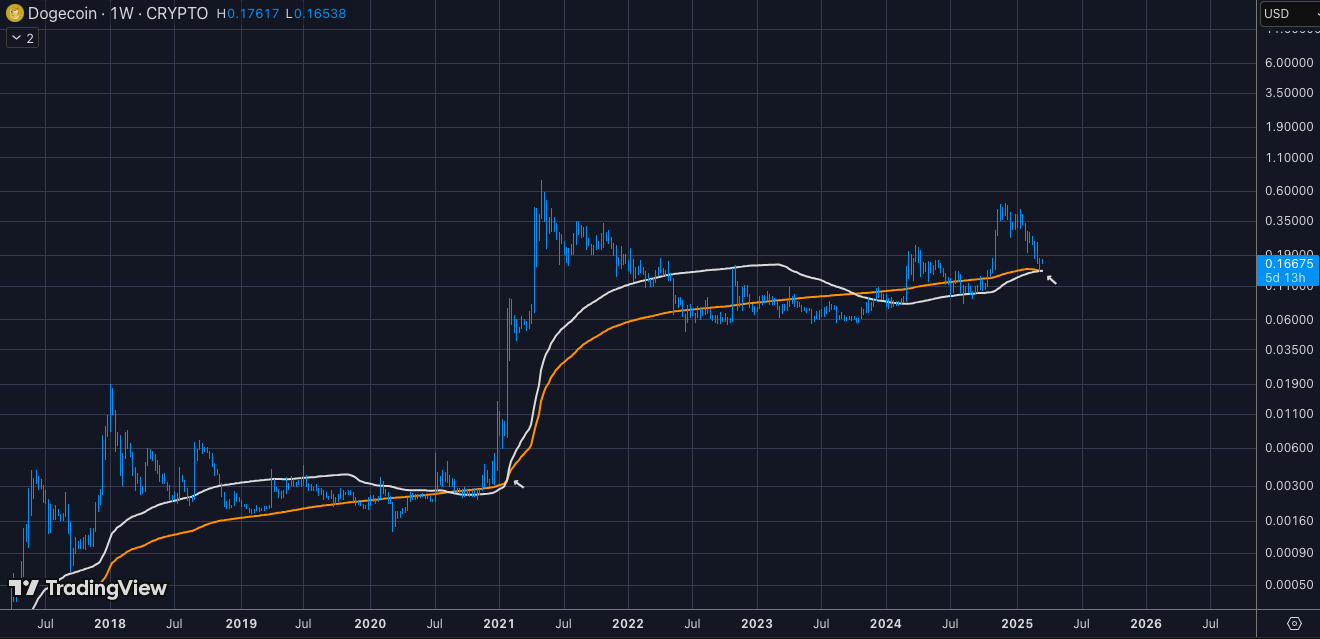
アナリスト @_cryptosurfの分析は、Dogeが重要なサポートレベルに達し、100週間と200週間の移動平均の両方と一致していることを明らかにしています。 この合流点は、しばしばトレンドシフトを示す重要な技術的なイベントです。
Source: @_CryptoSurf (X)
出典:@_cryptosurf(x)
A similar crossover in 2021 preceded a historic bull run, resulting in an over 8,800% price increase to an all-time high of $0.73 in May 2021. If history repeats, DOGE could potentially reach resistance levels of $0.22 and $0.30.
2021年の同様のクロスオーバーが歴史的なブルランに先行していたため、2021年5月に8,800%以上の価格が0.73ドルに上昇しました。
Conclusion
結論
While DOGE has undergone a substantial correction, on-chain metrics and technical analysis suggest a potential bottom formation. Sustained support at the 200-week moving average could reignite upward momentum. The current crossover of the 100-week and 200-week moving averages hints at a possible parabolic rally, mirroring the 2021 event. However, caution is advised; investors should await confirmation through increased trading volume and clear breakout patterns before making significant investments.
Dogeはかなりの修正を受けていますが、オンチェーンメトリックとテクニカル分析は潜在的な底部の形成を示唆しています。 200週間の移動平均での持続的なサポートは、上向きの勢いを再燃させる可能性があります。 100週間と200週間の移動平均の現在のクロスオーバーは、2021年のイベントを反映して、可能性のある放物線ラリーを示唆しています。 ただし、注意が払われています。投資家は、多額の投資を行う前に、取引量の増加と明確なブレイクアウトパターンを通じて確認を待つ必要があります。
Disclaimer: This article is for informational purposes only and does not constitute financial advice. Always conduct thorough research before investing in cryptocurrencies.
免責事項:この記事は情報提供のみを目的としており、財政的なアドバイスを構成していません。 暗号通貨に投資する前に、常に徹底的な調査を実施してください。
 U_Today
 DogeHome
 Crypto Daily™
 Cryptopolitan
 BlockchainReporter
 CoinsProbe
 CryptoPotato_News
 CoinsProbe


