The king of meme coins had lost the support level of $0.06 with the recent BTC drop. And it went deeper. Holding meme coins for the long term is much riskier for investors. Levels that Dogecoin (DOGE) investors should also worry about are approaching. So, what is the current situation? Will investors see a recovery after the excessive selling?
最近のBTCの下落により、ミームコインの王様は0.06ドルのサポートレベルを失いました。そしてそれはさらに深まりました。ミームコインを長期保有することは、投資家にとってはるかにリスクが高くなります。ドージコイン(DOGE)投資家も懸念すべき水準に近づいている。それで、現状はどうなっているのでしょうか?投資家は行き過ぎた売りから回復するだろうか?
Dogecoin (DOGE)
ドージコイン (DOGE)
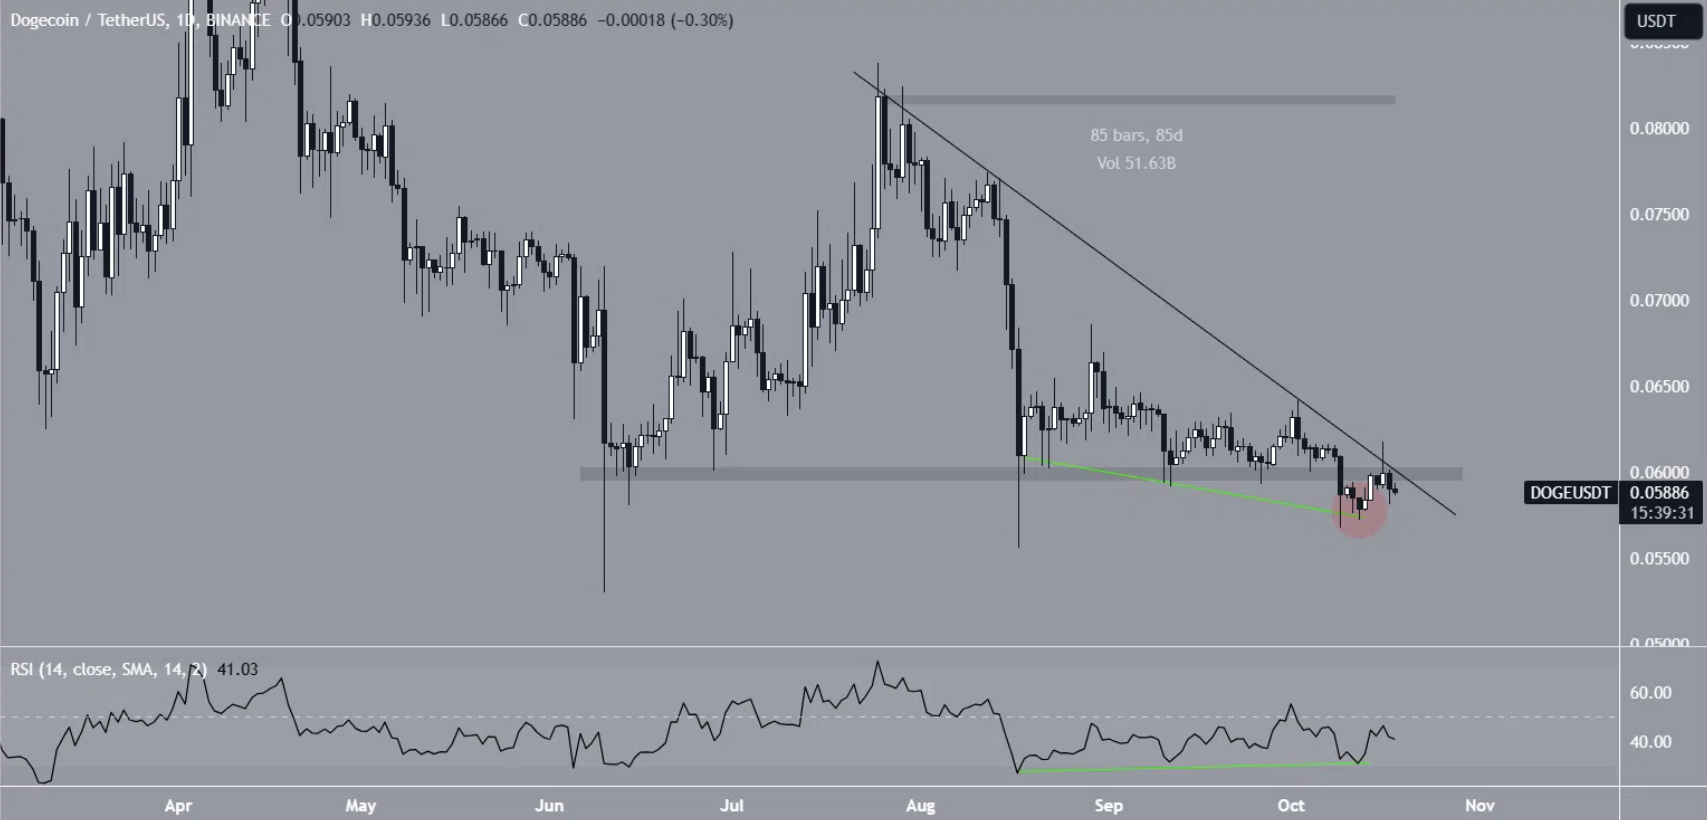
The DOGE price has been melting due to miner sales. We saw that the support at $0.06 was lost with the relaxation of the support on the futures side. On the daily chart, the DOGE price traded above the $0.06 horizontal support area since June. The DOGE price also followed a decreasing resistance trend line. When these come together, a descending triangle, which is considered a bearish formation, is formed.
DOGEの価格はマイナーの売却により下落しています。先物側のサポートの緩和により、0.06ドルのサポートが失われたことがわかりました。日足チャートでは、DOGE価格は6月以来0.06ドルの水平サポートエリアを上回って取引されている。 DOGE価格も下降抵抗トレンドラインをたどりました。これらが重なると、弱気の形成と考えられる下降三角形が形成されます。

On October 9, the Dogecoin price lost its support zone. Now, the DOGE price is trading within the horizontal area and the decreasing resistance trend line. The critical support level had remained intact for 85 days before the breakdown.
10月9日、ドージコインの価格はサポートゾーンを失いました。現在、DOGE価格は水平領域と減少する抵抗トレンドライン内で取引されています。重要なサポートレベルは、破綻前の85日間そのまま維持されていた。
DOGE Price Predictions
DOGE価格予測
The direction is still uncertain on the daily chart. To see a reversal in the trend and a recovery in the DOGE price, two things are needed. Firstly, we need to see a close above the decreasing resistance trend line. Secondly, it will be confirmed by the RSI rising above the neutral zone again.
日足チャートではまだ方向性が不透明です。トレンドの反転とDOGE価格の回復を確認するには、2つのことが必要です。まず、下降抵抗トレンドラインを上回る終値を見る必要があります。第二に、RSIが再びニュートラルゾーンを超えて上昇することで確認されます。
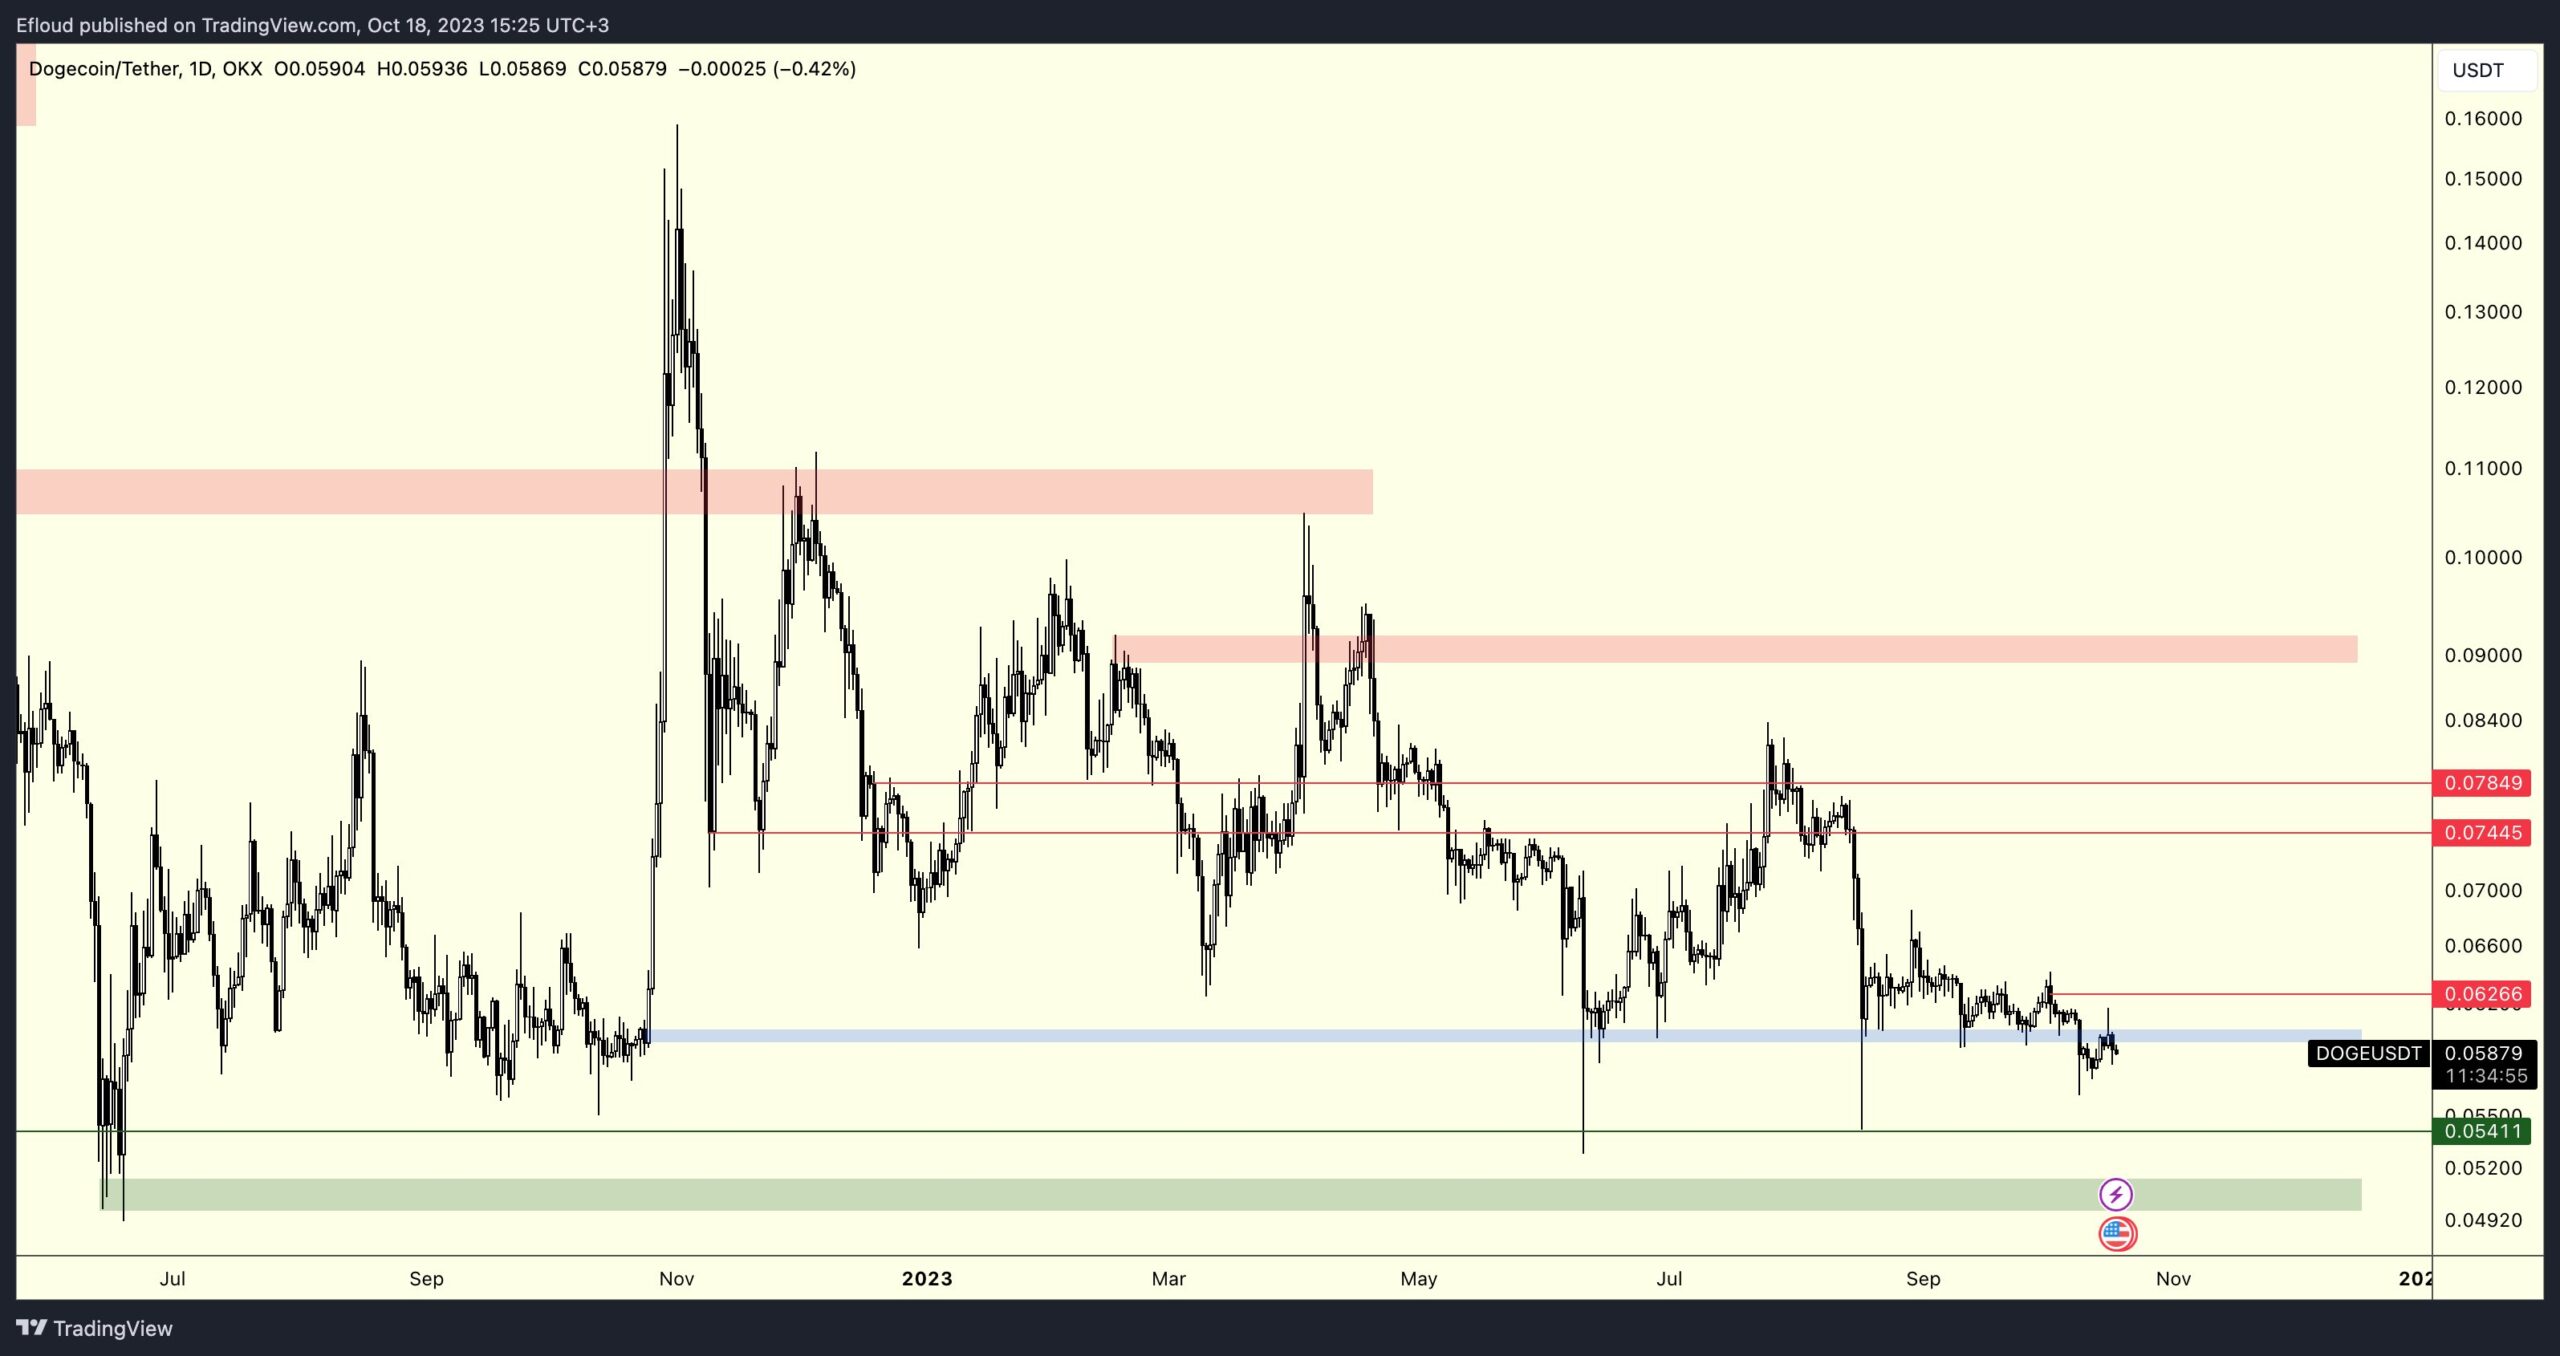
If these two important thresholds are surpassed, the DOGE price can target the $0.07 resistance above $0.06. This means an approximate 20% price increase. A price analysis shared by EfloudTheSurfer also suggests a similar view.
これら 2 つの重要なしきい値を超えた場合、DOGE 価格は 0.06 ドルを超える 0.07 ドルの抵抗線を狙う可能性があります。これは約20%の価格上昇を意味します。 EfluudTheSurfer が共有した価格分析も同様の見解を示唆しています。

The Fibonacci retracement theory suggests that after a significant drop, a deeper bottom could be formed before a recovery. The most suitable level for a potential bottom could be $0.048. Accordingly, the DOGE price forecast indicates that the next support level can be tested unless there are closures above $0.06.
フィボナッチ・リトレースメント理論は、大幅な下落の後、回復する前にさらに深い底が形成される可能性があることを示唆しています。潜在的な底値として最も適切なレベルは0.048ドルとなる可能性がある。したがって、DOGE価格予測は、0.06ドルを超える終値がない限り、次のサポートレベルを試すことができることを示しています。
At the time of writing, DOGE is at $0.0586, and for bulls to regain support, BTC needs to make closures above $28,500 to support altcoins. However, BTC is currently at $28,350. Apart from the surprise crypto purchase in Tesla’s balance sheet in the evening, there doesn’t seem to be a short-term trigger that could push the price up.
本稿執筆時点でDOGEは0.0586ドルで、強気派がサポートを取り戻すには、BTCがアルトコインをサポートするために28,500ドルを超えて決済する必要がある。ただし、BTCは現在28,350ドルです。夕方にテスラのバランスシートに仮想通貨が追加購入されたことを除けば、価格を押し上げるような短期的なきっかけはないようだ。
Continue Reading: https://en.coin-turk.com/will-dogecoin-doge-rise-predictions-for-doge-price-direction/続きを読む: https://en.coin-turk.com/will-dogecoin-doge-rise-predictions-for-doge-price-direction/


 Cryptopolitan
 DogeHome
 crypto.ro English
 Crypto News Land
 ETHNews
 CFN
CFN U_Today
 Thecoinrepublic.com


