- 1 Dogecoin price prediction showcases the consolidation phase of DOGE inside an interesting pattern over the daily time frame chart.
- 2 DOGE crypto is trading below 20, 50, 100 and 200-days daily moving averages.
- 3 Dogecoin cryptocurrency has slipped around 12.92% year to date.
1 ドージコインの価格予測は、日次時間枠チャート上の興味深いパターン内でのドージの統合フェーズを示しています。
2 DOGE 暗号通貨は、20、50、100、200 日の日次移動平均を下回って取引されています。
3 仮想通貨ドージコインは年初から約 12.92% 下落しました。
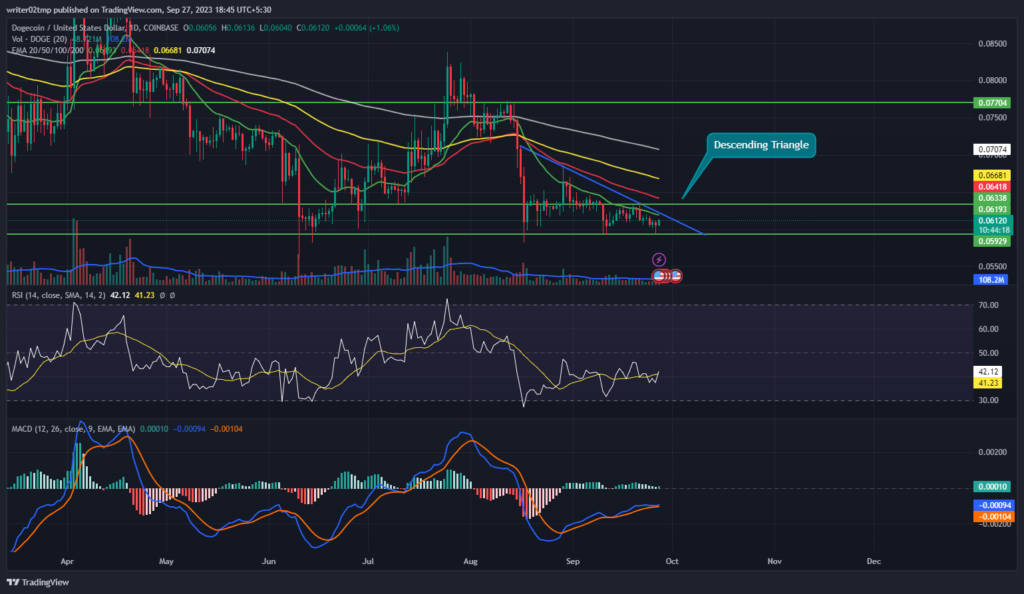
Dogecoin price prediction highlights the consolidation phase of DOGE inside an interesting falling pattern over the daily chart. However, buyers are trying to push DOGE upwards toward the upper trendline of the descending triangle pattern. DOGE declined from the $0.07704 mark and is stuck inside the descending triangle pattern. It is currently consolidating over the daily time frame chart.
ドージコインの価格予測は、日足チャート上の興味深い下落パターン内でのドージの保ち合い段階を強調しています。しかし、買い手はDOGEを下降三角形パターンの上部トレンドラインに向けて押し上げようとしています。 DOGEは0.07704ドルのマークから下落し、下降三角パターンの内側に止まっています。現在、日足チャートで統合中です。
Dogecoin price was at $0.06123 and gained 1.01% of its market capitalization intraday. Trading volume increased by 70% during the intraday trading session which demonstrates that buyers are trying to accumulate in order to push DOGE crypto upwards. The volume-to-market cap ratio was at 1.92%.
ドージコインの価格は0.06123ドルで、日中の時価総額の1.01%上昇した。日中取引セッション中に取引高は70%増加し、買い手がDOGE暗号通貨を押し上げるために蓄積しようとしていることを示しています。時価総額に対する出来高比率は 1.92% でした。
Will Dogecoin Price Register a Breakout?
ドージコインの価格はブレイクアウトを記録するでしょうか?

Dogecoin price prediction highlights the recovery phase of DOGE crypto over the daily time frame chart. However, the volume change is below average and needs to grow intraday. Meanwhile, DOGE crypto is trading below 20, 50, 100, and 200-day daily moving averages.
ドージコインの価格予測は、日次時間枠チャートにおけるドージ暗号の回復段階を強調しています。ただし、ボリュームの変化は平均を下回っており、日中に増加する必要があります。一方、DOGE暗号は20日、50日、100日、200日の日次移動平均を下回って取引されている。
Dogecoin cryptocurrency is currently showing a robust upward trend that needs to be sustained. Nevertheless, caution is advised for sellers, as DOGE could potentially lose buyers as the day progresses. If DOGE can maintain its recovery momentum and continue attracting buyers, it has the potential to achieve significant recovery.
暗号通貨ドージコインは現在、堅調な上昇傾向を示しており、これを維持する必要があります。それにもかかわらず、DOGE は日が経つにつれて買い手を失う可能性があるため、売り手には注意が必要です。 DOGEが回復の勢いを維持し、買い手を引きつけ続けることができれば、大幅な回復を達成する可能性がある。
Dogecoin price has experienced a 2.49% decrease in the span of a week and a decline of 3.18% over the past month. Additionally, the DOGE crypto chart shows a 2.29% slip in the last three months and a drop of 17.64% over the last six months. Looking at the year-to-date performance, Dogecoin cryptocurrency has registered a decrease of 12.92%. These trends indicate that 2023 hasn’t been particularly favorable for DOGE crypto in terms of its performance.
ドージコインの価格は、1 週間で 2.49% 下落し、過去 1 か月間で 3.18% 下落しました。さらに、DOGE 暗号通貨チャートは、過去 3 か月で 2.29% 下落し、過去 6 か月で 17.64% 下落したことを示しています。年初から現在までのパフォーマンスを見ると、仮想通貨ドージコインは 12.92% の減少を記録しました。これらの傾向は、2023 年が DOGE 暗号通貨のパフォーマンスの点で特に有利ではなかったことを示しています。
Based on technical indicators, it appears that Dogecoin cryptocurrency is currently on an upward trend. Both the relative strength index (RSI) and the moving average convergence divergence (MACD) support the positive momentum of DOGE crypto.
テクニカル指標に基づくと、仮想通貨ドージコインは現在上昇傾向にあるようです。相対強度指数 (RSI) と移動平均収束発散 (MACD) の両方が、DOGE 暗号の前向きな勢いを裏付けています。
The RSI, at 41, is gradually moving toward a neutral position. Meanwhile, the MACD line remains above the signal line, indicating an upward trend. Investors in Dogecoin cryptocurrency should exercise patience and wait for DOGE crypto to maintain its position at the primary resistance level.
RSI は 41 で、徐々に中立の位置に近づいています。一方、MACD ラインは依然としてシグナルラインを上回っており、上昇傾向を示しています。暗号通貨ドージコインへの投資家は、忍耐強く、DOGE暗号通貨が主要な抵抗レベルでのポジションを維持するまで待つ必要があります。
Summary
まとめ
Dogecoin price prediction highlights the consolidation phase of DOGE inside an interesting falling pattern over the daily chart. However, the volume change is below average and needs to grow intraday. If DOGE can maintain its recovery momentum and continues attracting buyers, it has the potential to achieve significant chart recovery. Based on technical indicators, it appears that Dogecoin cryptocurrency is currently on an uptrend.
ドージコインの価格予測は、日足チャート上の興味深い下落パターン内でのドージの保ち合い段階を強調しています。ただし、ボリュームの変化は平均を下回っており、日中に増加する必要があります。 DOGEが回復の勢いを維持し、買い手を引き付け続けることができれば、チャートの大幅な回復を達成する可能性があります。テクニカル指標に基づくと、仮想通貨ドージコインは現在上昇傾向にあるようです。
Technical Levels
技術レベル
- Support Levels: $0.06017 and $0.05990
- Resistance Levels: $0.06195 and $0.06338
サポートレベル: $0.06017 および $0.05990
抵抗レベル: 0.06195 ドルおよび 0.06338 ドル
Disclaimer
免責事項
The views and opinions stated by the author, or any people named in this article, are for informational purposes only, and they do not establish financial, investment, or other advice. Investing in or trading crypto or stock comes with a risk of financial loss.
著者またはこの記事で名前が挙げられている人物によって述べられた見解や意見は情報提供のみを目的としており、財務、投資、その他のアドバイスを確立するものではありません。仮想通貨や株式への投資や取引には、経済的損失のリスクが伴います。


 CFN
CFN The Crypto Times
 Cryptopolitan_News
 Crypto News Land
 CryptoNewsLand
 CoinPedia News
 CoinPedia News
 CoinPedia News
 CoinPedia News


