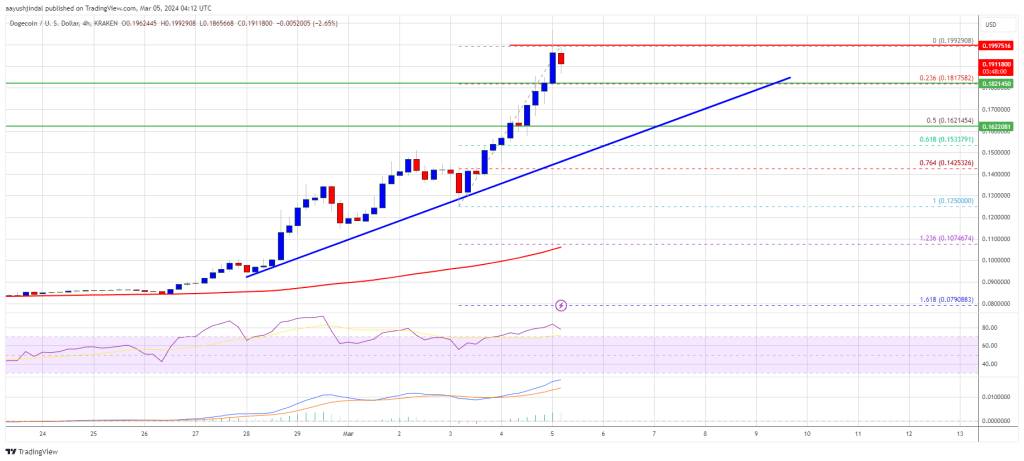
Dogecoin is up over 100% against the US Dollar. DOGE rallied toward the $0.20 resistance and might continue to rise toward the $0.225 resistance.
ドージコインは対米ドルで100%以上上昇しています。 DOGEは0.20ドルの抵抗線に向けて反発し、0.225ドルの抵抗線に向けて上昇し続ける可能性がある。
- DOGE extended its rally above the $0.150 resistance against the US dollar.
- The price is trading above the $0.180 level and the 100 simple moving average (4 hours).
- There is a connecting bullish trend line forming with support at $0.1620 on the 4-hour chart of the DOGE/USD pair (data source from Kraken).
- The price could extend its rally above the $0.200 and $0.2120 resistance levels.
DOGEは対米ドルで0.150ドルの抵抗線を超えて上昇幅を拡大した。
価格は0.180ドルのレベルと100単純移動平均(4時間)を上回って取引されている。
DOGE/USDペアの4時間足チャートでは、0.1620ドルをサポートとする接続強気トレンドラインが形成されています(データソースはKraken)。
価格は0.200ドルと0.2120ドルの抵抗レベルを超えて上昇を拡大する可能性がある。
Dogecoin Price Surges Over 100%
ドージコインの価格が100%以上急騰
In the past few sessions, Dogecoin price started a strong increase above the $0.10 resistance. DOGE cleared many hurdles near $0.1250 to enter a positive zone.
過去数回のセッションで、ドージコインの価格は0.10ドルの抵抗を超えて大幅な上昇を開始しました。 DOGEは0.1250ドル付近で多くのハードルをクリアし、プラス圏に入った。
It even broke the $0.150 resistance and outperformed Bitcoin and Ethereum. It is up over 100% in a few sessions and traded close to the $0.20 resistance. A new multi-week high was formed near $0.992 and the price is now correcting gains.
0.150ドルの抵抗線も突破し、ビットコインやイーサリアムを上回った。数回のセッションで100%以上上昇し、0.20ドルの抵抗線付近で取引された。 0.992ドル付近で数週間ぶりの高値を更新し、価格は現在上昇を修正している。
The price is well above the 23.6% Fib retracement level of the recent rally from the $0.1250 swing low to the $0.1992 high. DOGE is also trading above the $0.180 level and the 100 simple moving average (4 hours).
価格は、0.1250ドルのスイング安値から0.1992ドルの高値までの最近の上昇の23.6%Fibリトレースメントレベルをはるかに上回っています。 DOGEはまた、0.180ドルのレベルと100単純移動平均(4時間)を上回って取引されています。
There is also a connecting bullish trend line forming with support at $0.1620 on the 4-hour chart of the DOGE/USD pair. The trend line is near the 50% Fib retracement level of the recent rally from the $0.1250 swing low to the $0.1992 high.
DOGE/USDペアの4時間足チャートでは、0.1620ドルをサポートとする接続強気トレンドラインも形成されている。トレンドラインは、0.1250ドルのスイング安値から0.1992ドルの高値までの最近の上昇の50%Fibリトレースメントレベル付近にあります。
Source: DOGEUSD on TradingView.com
出典: TradingView.comのDOGEUSD
On the upside, the price is facing resistance near the $0.1980 level. The next major resistance is near the $0.20 level. A close above the $0.20 resistance might send the price toward the $0.2250 resistance. The next major resistance is near $0.2320. Any more gains might send the price toward the $0.250 level.
上値では、価格は0.1980ドルレベル付近の抵抗に直面している。次の主要な抵抗線は 0.20 ドルレベル付近です。終値が0.20ドルの抵抗線を上回れば、価格は0.2250ドルの抵抗線に向かう可能性がある。次の主要な抵抗線は0.2320米ドル付近だ。さらに上昇すると、価格は0.250ドルのレベルに向かう可能性があります。
Downside Correction in DOGE?
DOGEの下方修正?
If DOGE’s price fails to gain pace above the $0.20 level, it could start a downside correction. Initial support on the downside is near the $0.182 level.
DOGEの価格が0.20ドルのレベルを超えてペースを上げることができなければ、下値修正が始まる可能性がある。下値支持線は0.182ドル付近にある。
The next major support is near the $0.1620 level or the trend line. If there is a downside break below the $0.1620 support, the price could decline further. In the stated case, the price might decline toward the $0.1350 level.
次の主要なサポートは0.1620ドルのレベルまたはトレンドライン付近です。 0.1620ドルのサポートを下抜けた場合、価格はさらに下落する可能性がある。上記のケースでは、価格は 0.1350 ドルのレベルに向かって下落する可能性があります。
Technical Indicators
テクニカル指標
4 Hours MACD – The MACD for DOGE/USD is now gaining momentum in the bullish zone.
4時間MACD – DOGE/USDのMACDは現在、強気ゾーンで勢いを増しています。
4 Hours RSI (Relative Strength Index) – The RSI for DOGE/USD is now in the overbought zone.
4 時間足 RSI (相対力指数) – DOGE/USD の RSI は現在買われ過ぎゾーンにあります。
Major Support Levels – $0.1820, $0.1620 and $0.1350.
メジャーサポートレベル – $0.1820、$0.1620、$0.1350。
Major Resistance Levels – $0.1980, $0.20, and $0.2250.
主な抵抗レベル – 0.1980ドル、0.20ドル、0.2250ドル。
免責事項: この記事は教育目的のみに提供されています。これは投資を購入、売却、または保有するかどうかに関する NewsBTC の意見を表すものではなく、当然のことながら投資にはリスクが伴います。投資を決定する前に、ご自身で調査を行うことをお勧めします。このウェブサイトで提供される情報は完全に自己責任でご利用ください。
タグ: DOGE/BTCDogecoindogeusddogeusdt


 U_Today
 Thecoinrepublic.com
 DogeHome
 Optimisus
 Optimisus
 DeFi Planet
 Crypto Daily™
 BlockchainReporter
 TheCoinrise Media


