In a recent analysis, crypto analyst Rekt Capital has pinpointed the signs of a potential breakout in the Dogecoin (DOGE) price, which could pave the way for a significant price rally. However, several factors must come together for this scenario to unfold.
最近の分析で、暗号通貨アナリストのレクト・キャピタルは、ドージコイン(DOGE)価格の潜在的なブレイクアウトの兆候を正確に指摘し、これが大幅な価格上昇への道を開く可能性があります。ただし、このシナリオが展開するには、いくつかの要因が組み合わさる必要があります。
Dogecoin Price Ready For A Breakout?
ドージコイン価格はブレイクアウトの準備はできていますか?
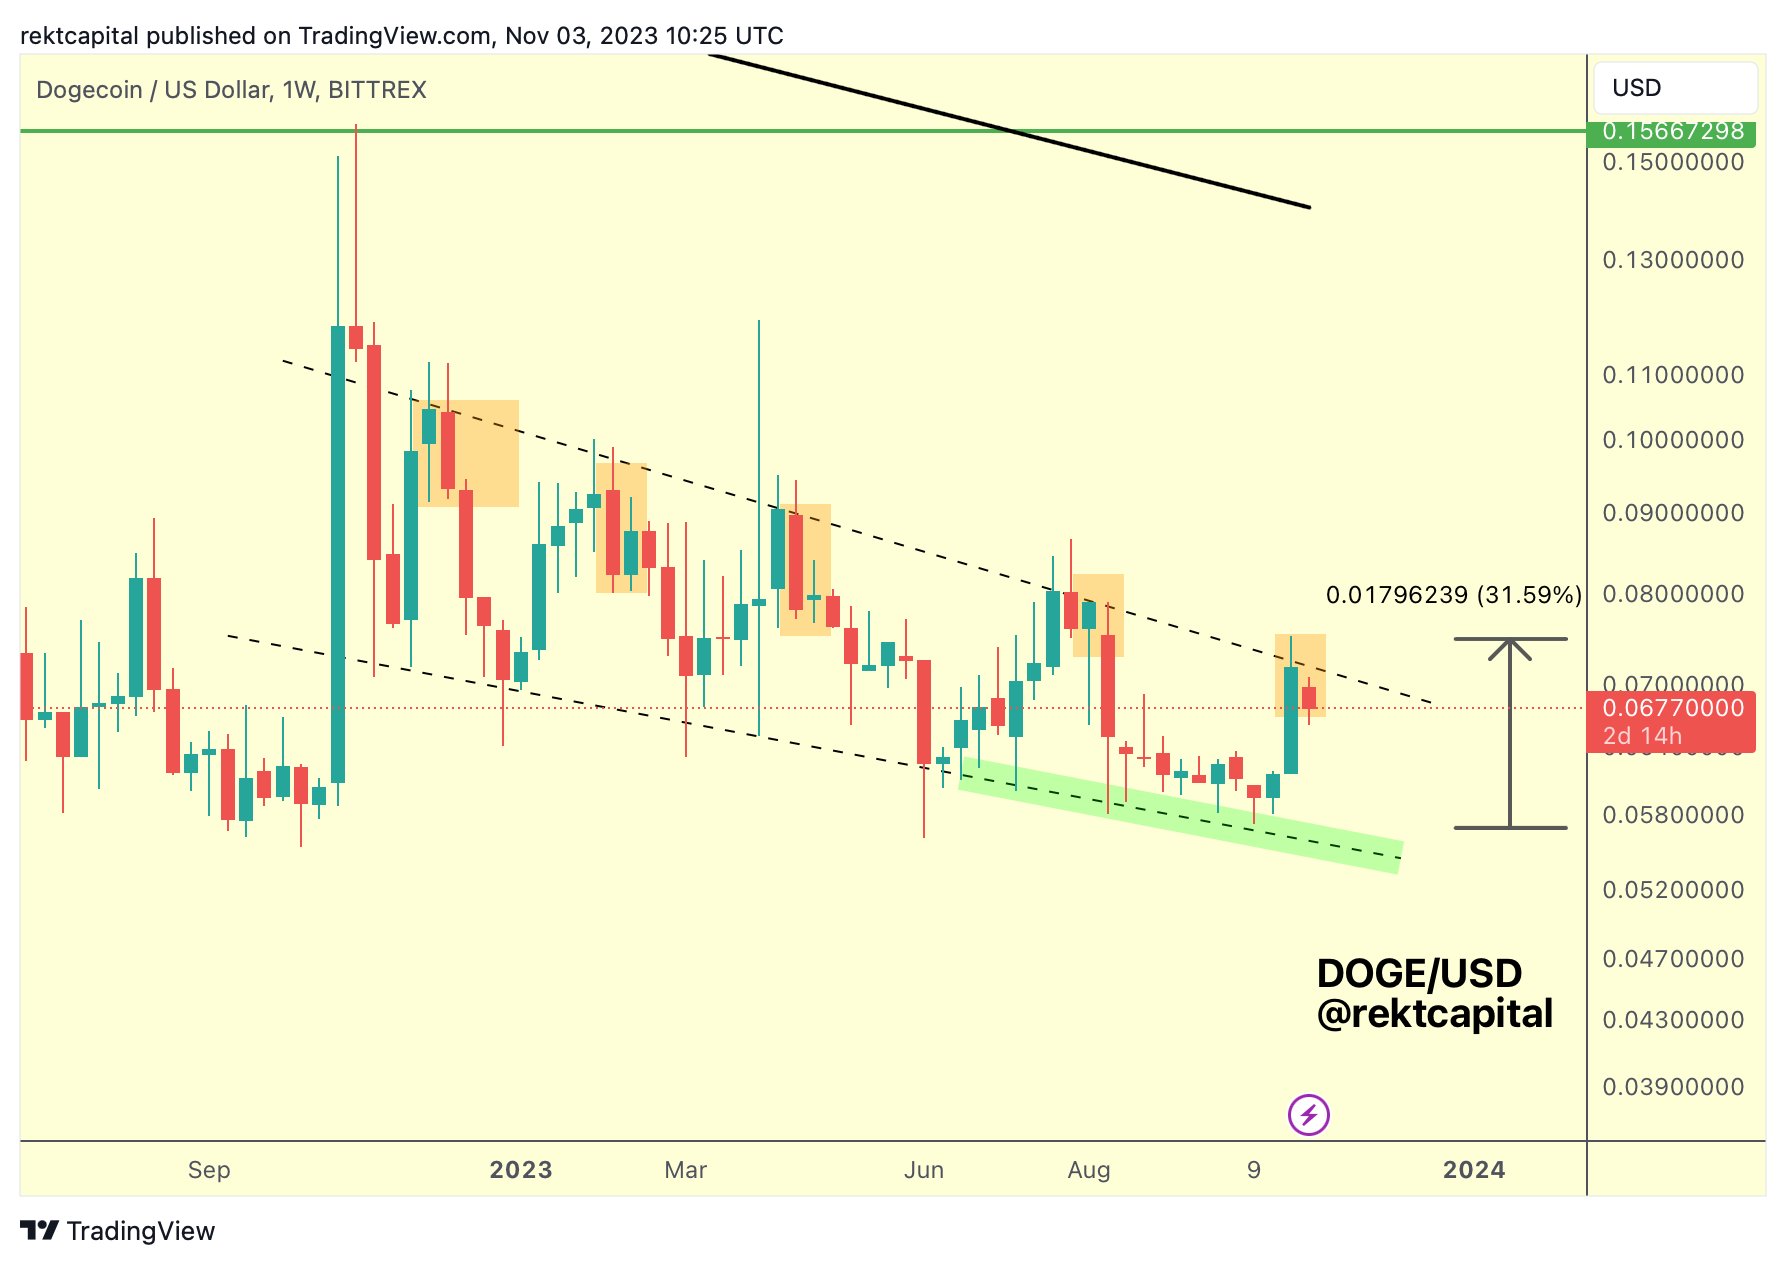
Rekt Capital has shared the following 1-week DOGE/USD chart. According to his analysis, Dogecoin’s price movement has been confined within a descending channel pattern since its peak at the end of last year. This pattern is characterized by two parallel trendlines, representing potential support and resistance levels, with the Dogecoin’s price oscillating between them.
Rekt Capitalは、次の1週間のDOGE/USDチャートを共有しました。同氏の分析によると、ドージコインの価格変動は昨年末のピーク以来、下降チャネルパターン内に限定されている。このパターンは、潜在的なサポートレベルとレジスタンスレベルを表す 2 本の平行なトレンドラインによって特徴付けられ、ドージコインの価格はそれらの間で変動します。

Last Wednesday, DOGE’s price was rejected once again at the upper trendline, making it the fifth rejection within the last year. However, a key observation made by Rekt Capital is the “buy-the-dip” behavior exhibited by traders, which has so far prevented a strong downside continuation. He highlights:
先週の水曜日、DOGEの価格はトレンドラインの上部で再び拒否され、過去1年間で5回目の拒否となった。しかし、Rekt Capital が行った重要な観察は、トレーダーが示した「押し目買い」の行動であり、これによりこれまでのところ強い下値継続が妨げられています。彼は次のように強調しています。
That “buy-the-dip” behavior we saw yesterday is looking like relief under key resistance. However, there has been no strong DOGE rejection & downside continuation. Most important signal is a Weekly Close above Channel Top to confirm a breakout.
昨日見た「押し目買い」の動きは、主要な抵抗の下での救済のように見えます。ただし、強いDOGE拒否&下値継続はありません。最も重要なシグナルは、ブレイクアウトを確認するためのチャネルトップの上の週次終値です。
As Rekt Capital emphasizes, the most crucial signal for a potential breakout is if Dogecoin can achieve a weekly close above the channel’s top. Therefore, DOGE bulls need to display a strong “buy-the-dip” behavior. Should the price successfully close above the channel top, it could signify a strong bullish trend in the offing.
Rekt Capitalが強調しているように、潜在的なブレイクアウトの最も重要なシグナルは、ドージコインがチャネルの最高値を上回る週間終値を達成できるかどうかです。したがって、DOGE の雄牛は強力な「押し目買い」行動を示す必要があります。価格がチャネルの最高値を上回って終了した場合、それは今後の強い強気傾向を示す可能性があります。
Potential Price Targets
潜在的な価格目標
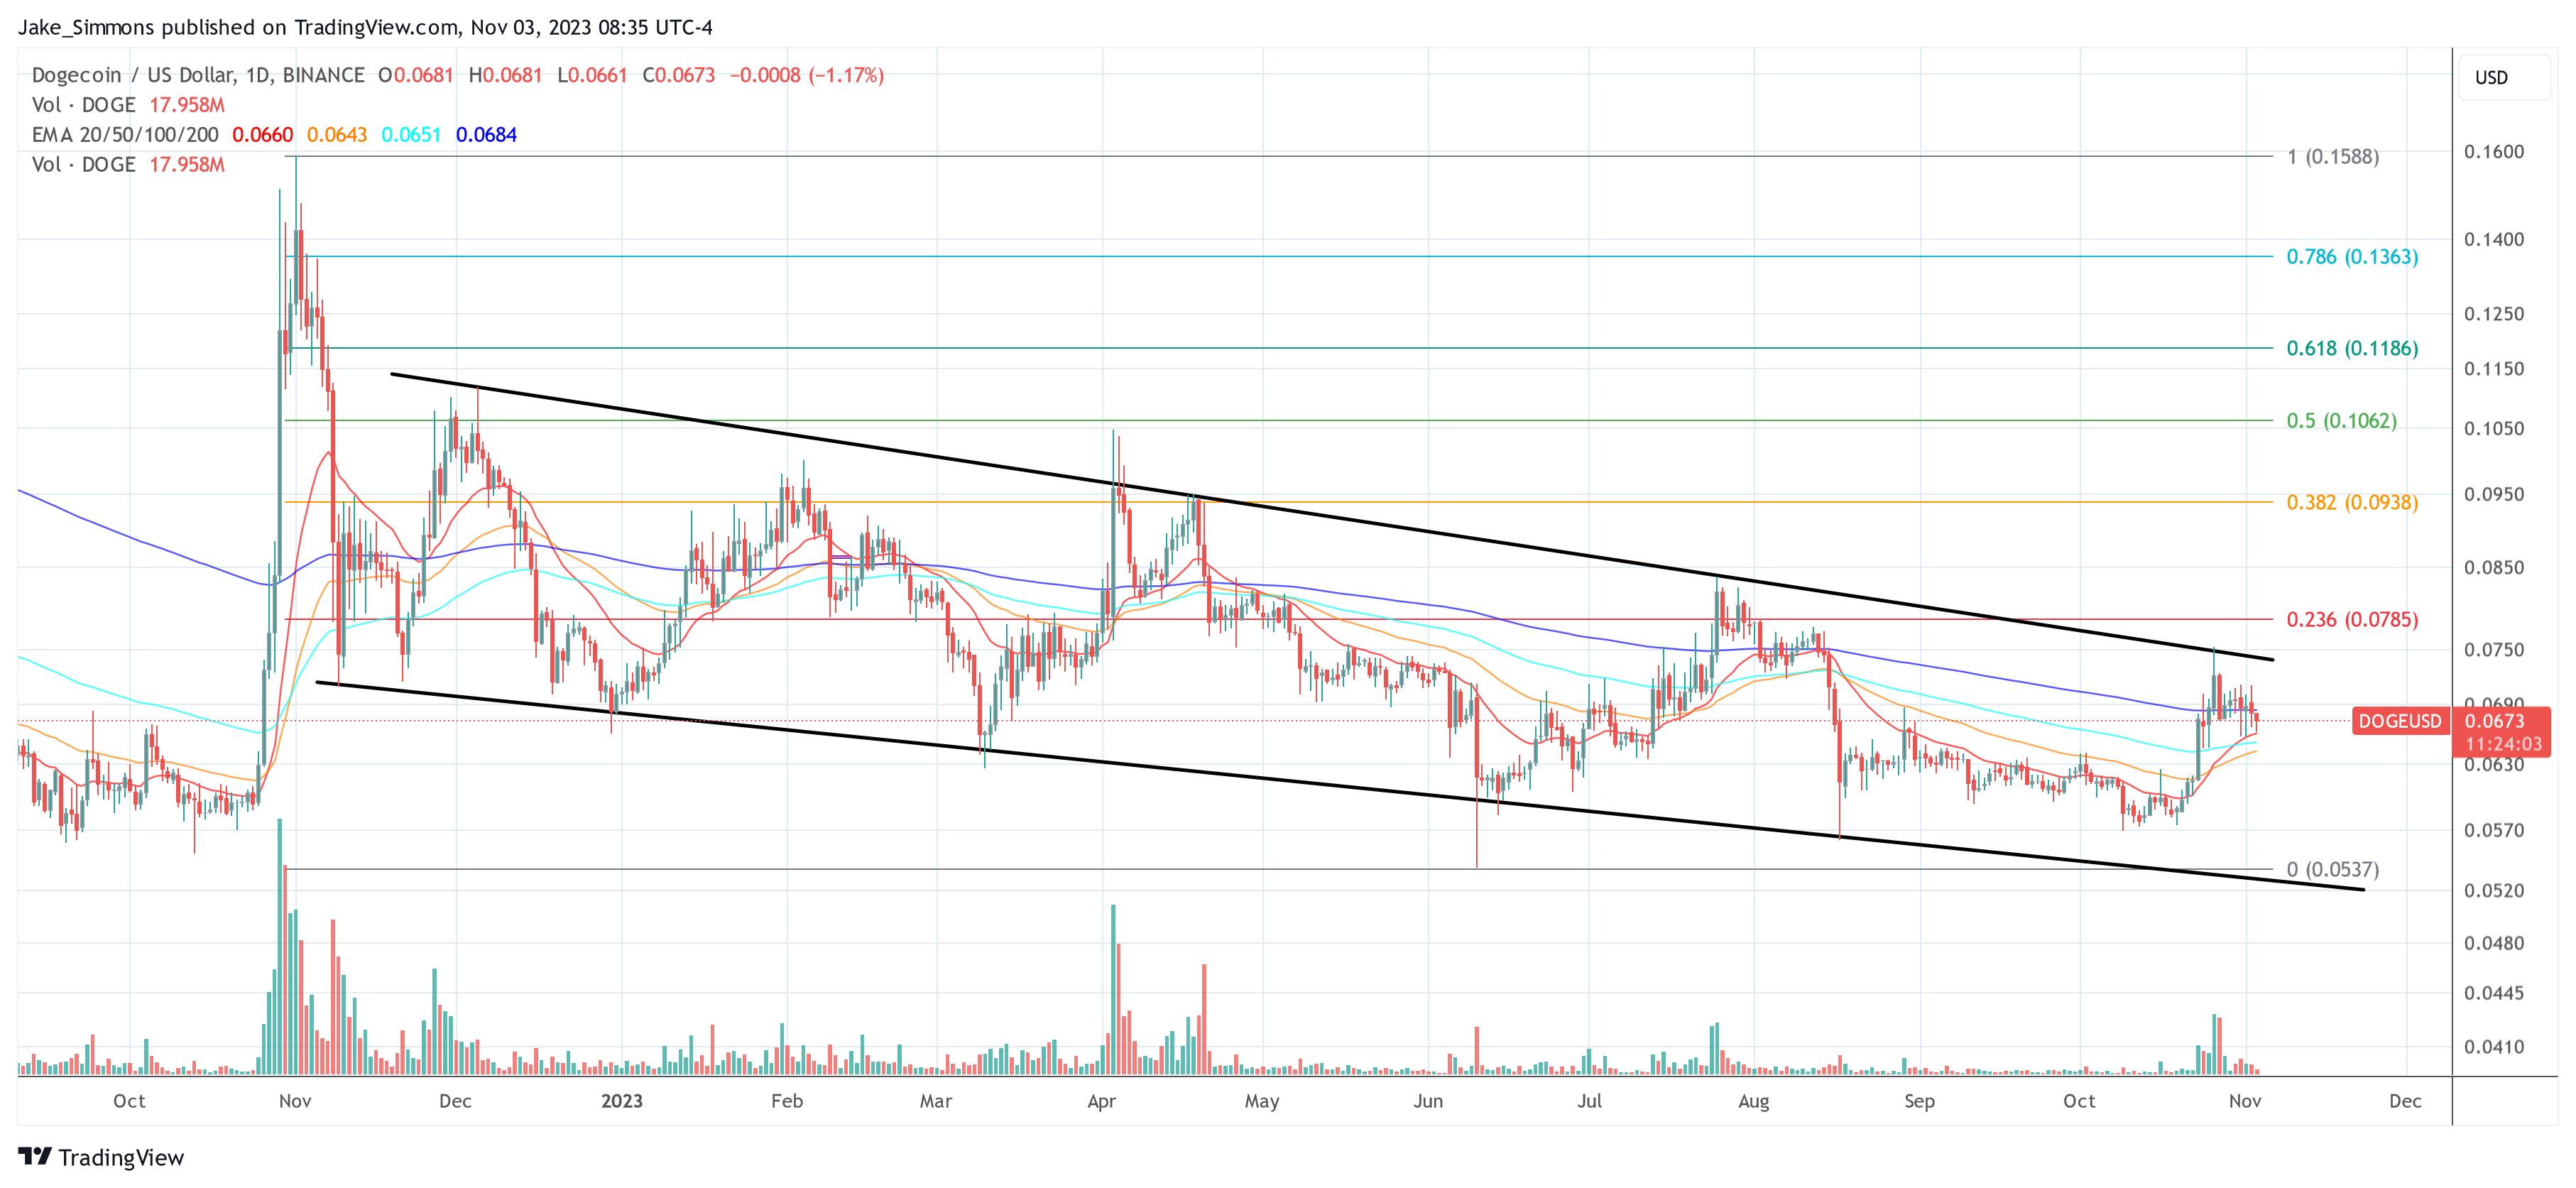
Turning to the daily chart of DOGE/USD, several key price targets can be deduced based on Fibonacci retracement levels and Exponential Moving Averages (EMAs). The EMAs, which are utilized to pinpoint potential support and resistance levels based on past price data, are showing a cluster around the $0.0660 to $0.0684 range. Currently, DOGE has dropped below the crucial 200-day EMA (blue line) at $0.0684, but found support at 20-day EMA (red line) at $0.0660.
DOGE/USD の日次チャートに目を向けると、フィボナッチ リトレースメント レベルと指数移動平均 (EMA) に基づいて、いくつかの主要な価格目標を推測できます。過去の価格データに基づいて潜在的なサポートとレジスタンスのレベルを特定するために利用されるEMAは、0.0660ドルから0.0684ドルの範囲の周りにクラスターを示しています。現在、DOGEは重要な200日EMA(青線)の0.0684ドルを下回っているが、20日EMA(赤線)の0.0660ドルがサポートとなっている。

If a breakout from the descending trend channel is successful, the 0.236 Fibonacci level at $0.0785 will probably be the first major price target. If DOGE bounces off this level, a retest of the breakout is very likely – it would be a do-or-die moment for Dogecoin. However, a successful retest could pave the way for DOGE to break above the $0.0785 price level and set the stage for the subsequent price targets.
下降トレンドチャネルからのブレイクアウトが成功すれば、0.0785ドルの0.236フィボナッチレベルがおそらく最初の主要な価格目標となるだろう。 DOGEがこのレベルから反発した場合、ブレイクアウトの再テストが行われる可能性が非常に高く、それはドージコインにとって死活問題となるでしょう。しかし、再テストが成功すれば、DOGEが0.0785ドルの価格水準を突破し、その後の目標価格への布石を打つ可能性がある。
On the higher side, the Fibonacci retracement levels to watch are 0.382 ($0.0938), 0.5 ($0.1062), 0.618 ($0.1186) and 0.786 ($0.1363), which often act as critical resistance and support zones. The ultimate goal of a potential 135% rally would be the November 1 high at $0.1588.
上値では、注目すべきフィボナッチ・リトレースメントのレベルは0.382 ($0.0938)、0.5 ($0.1062)、0.618 ($0.1186)、0.786 ($0.1363)であり、これらはしばしば重要なレジスタンスゾーンおよびサポートゾーンとして機能します。潜在的な135%上昇の最終目標は、11月1日の高値である0.1588ドルとなるだろう。
In conclusion, while the current market sentiments and patterns hint at a potential breakout, it remains imperative for DOGE to secure a weekly close above the channel top. Should this happen, and coupled with supportive market dynamics, Dogecoin could witness a breathtaking rally once again.
結論として、現在の市場センチメントとパターンはブレイクアウトの可能性を示唆していますが、DOGE がチャネルの最高値を上回る週間終値を確保することが依然として不可欠です。これが起こった場合、市場の力学と相まって、ドージコインは再び息を呑むような上昇を目撃する可能性があります。


 DogeHome
 Optimisus
 Crypto News Land
 Optimisus
 Cryptopolitan_News
 Cryptopolitan
 crypto.ro English


