In a recent analysis, crypto analyst Rekt Capital has pinpointed the signs of a potential breakout in the Dogecoin (DOGE) price, which could pave the way for a significant price rally. However, several factors must come together for this scenario to unfold.
在最近的分析中,加密貨幣分析師 Rekt Capital 指出了狗狗幣(DOGE)價格潛在突破的跡象,這可能為價格大幅上漲鋪平道路。然而,要實現這種情況,必須有幾個因素結合在一起。
Dogecoin Price Ready For A Breakout?
狗狗幣價格準備好突破了嗎?
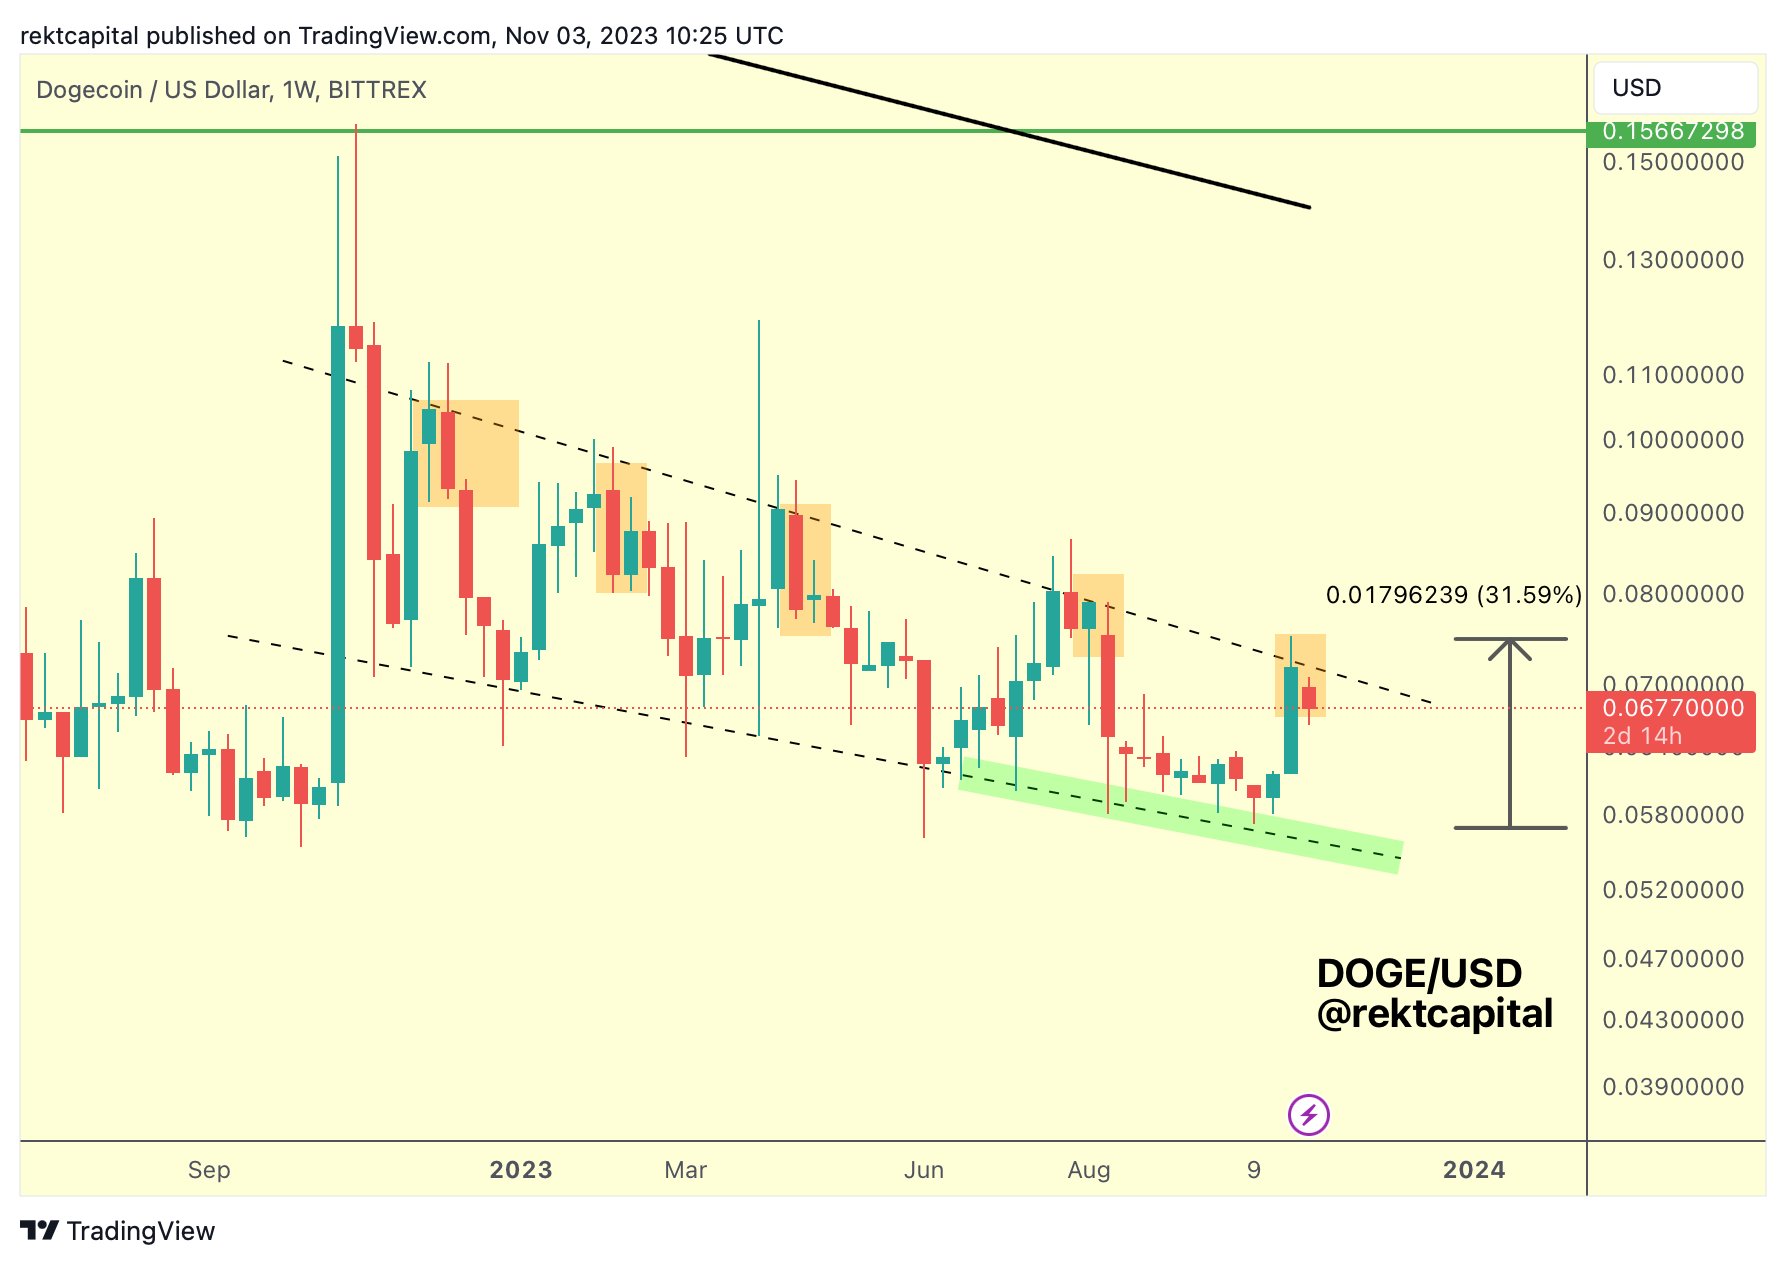
Rekt Capital has shared the following 1-week DOGE/USD chart. According to his analysis, Dogecoin’s price movement has been confined within a descending channel pattern since its peak at the end of last year. This pattern is characterized by two parallel trendlines, representing potential support and resistance levels, with the Dogecoin’s price oscillating between them.
Rekt Capital 分享了以下 1 週 DOGE/USD 圖表。根據他的分析,狗狗幣的價格走勢自去年年底達到頂峰以來一直被限制在下降通道模式內。這種模式的特徵是兩條平行的趨勢線,代表潛在的支撐位和阻力位,狗狗幣的價格在它們之間振盪。

Last Wednesday, DOGE’s price was rejected once again at the upper trendline, making it the fifth rejection within the last year. However, a key observation made by Rekt Capital is the “buy-the-dip” behavior exhibited by traders, which has so far prevented a strong downside continuation. He highlights:
上週三,DOGE 的價格再次在趨勢線上方被拒絕,這是去年第五次被拒絕。然而,Rekt Capital 的一個關鍵觀察是交易員表現出的「逢低買進」行為,迄今為止,這種行為阻止了強勁的下行趨勢持續。他強調:
That “buy-the-dip” behavior we saw yesterday is looking like relief under key resistance. However, there has been no strong DOGE rejection & downside continuation. Most important signal is a Weekly Close above Channel Top to confirm a breakout.
我們昨天看到的「逢低買入」行為看起來像是關鍵阻力下的緩解。然而,DOGE 並沒有出現強烈的拒絕和下行趨勢的延續。最重要的信號是每週收盤價高於通道頂部以確認突破。
As Rekt Capital emphasizes, the most crucial signal for a potential breakout is if Dogecoin can achieve a weekly close above the channel’s top. Therefore, DOGE bulls need to display a strong “buy-the-dip” behavior. Should the price successfully close above the channel top, it could signify a strong bullish trend in the offing.
正如 Rekt Capital 所強調的那樣,潛在突破的最關鍵訊號是狗狗幣能否實現週收盤價高於通道頂部。因此,DOGE 多頭需要表現出強烈的「逢低買進」行為。如果價格成功收於通道頂部上方,則可能預示著即將出現強勁的看漲趨勢。
Potential Price Targets
潛在的價格目標
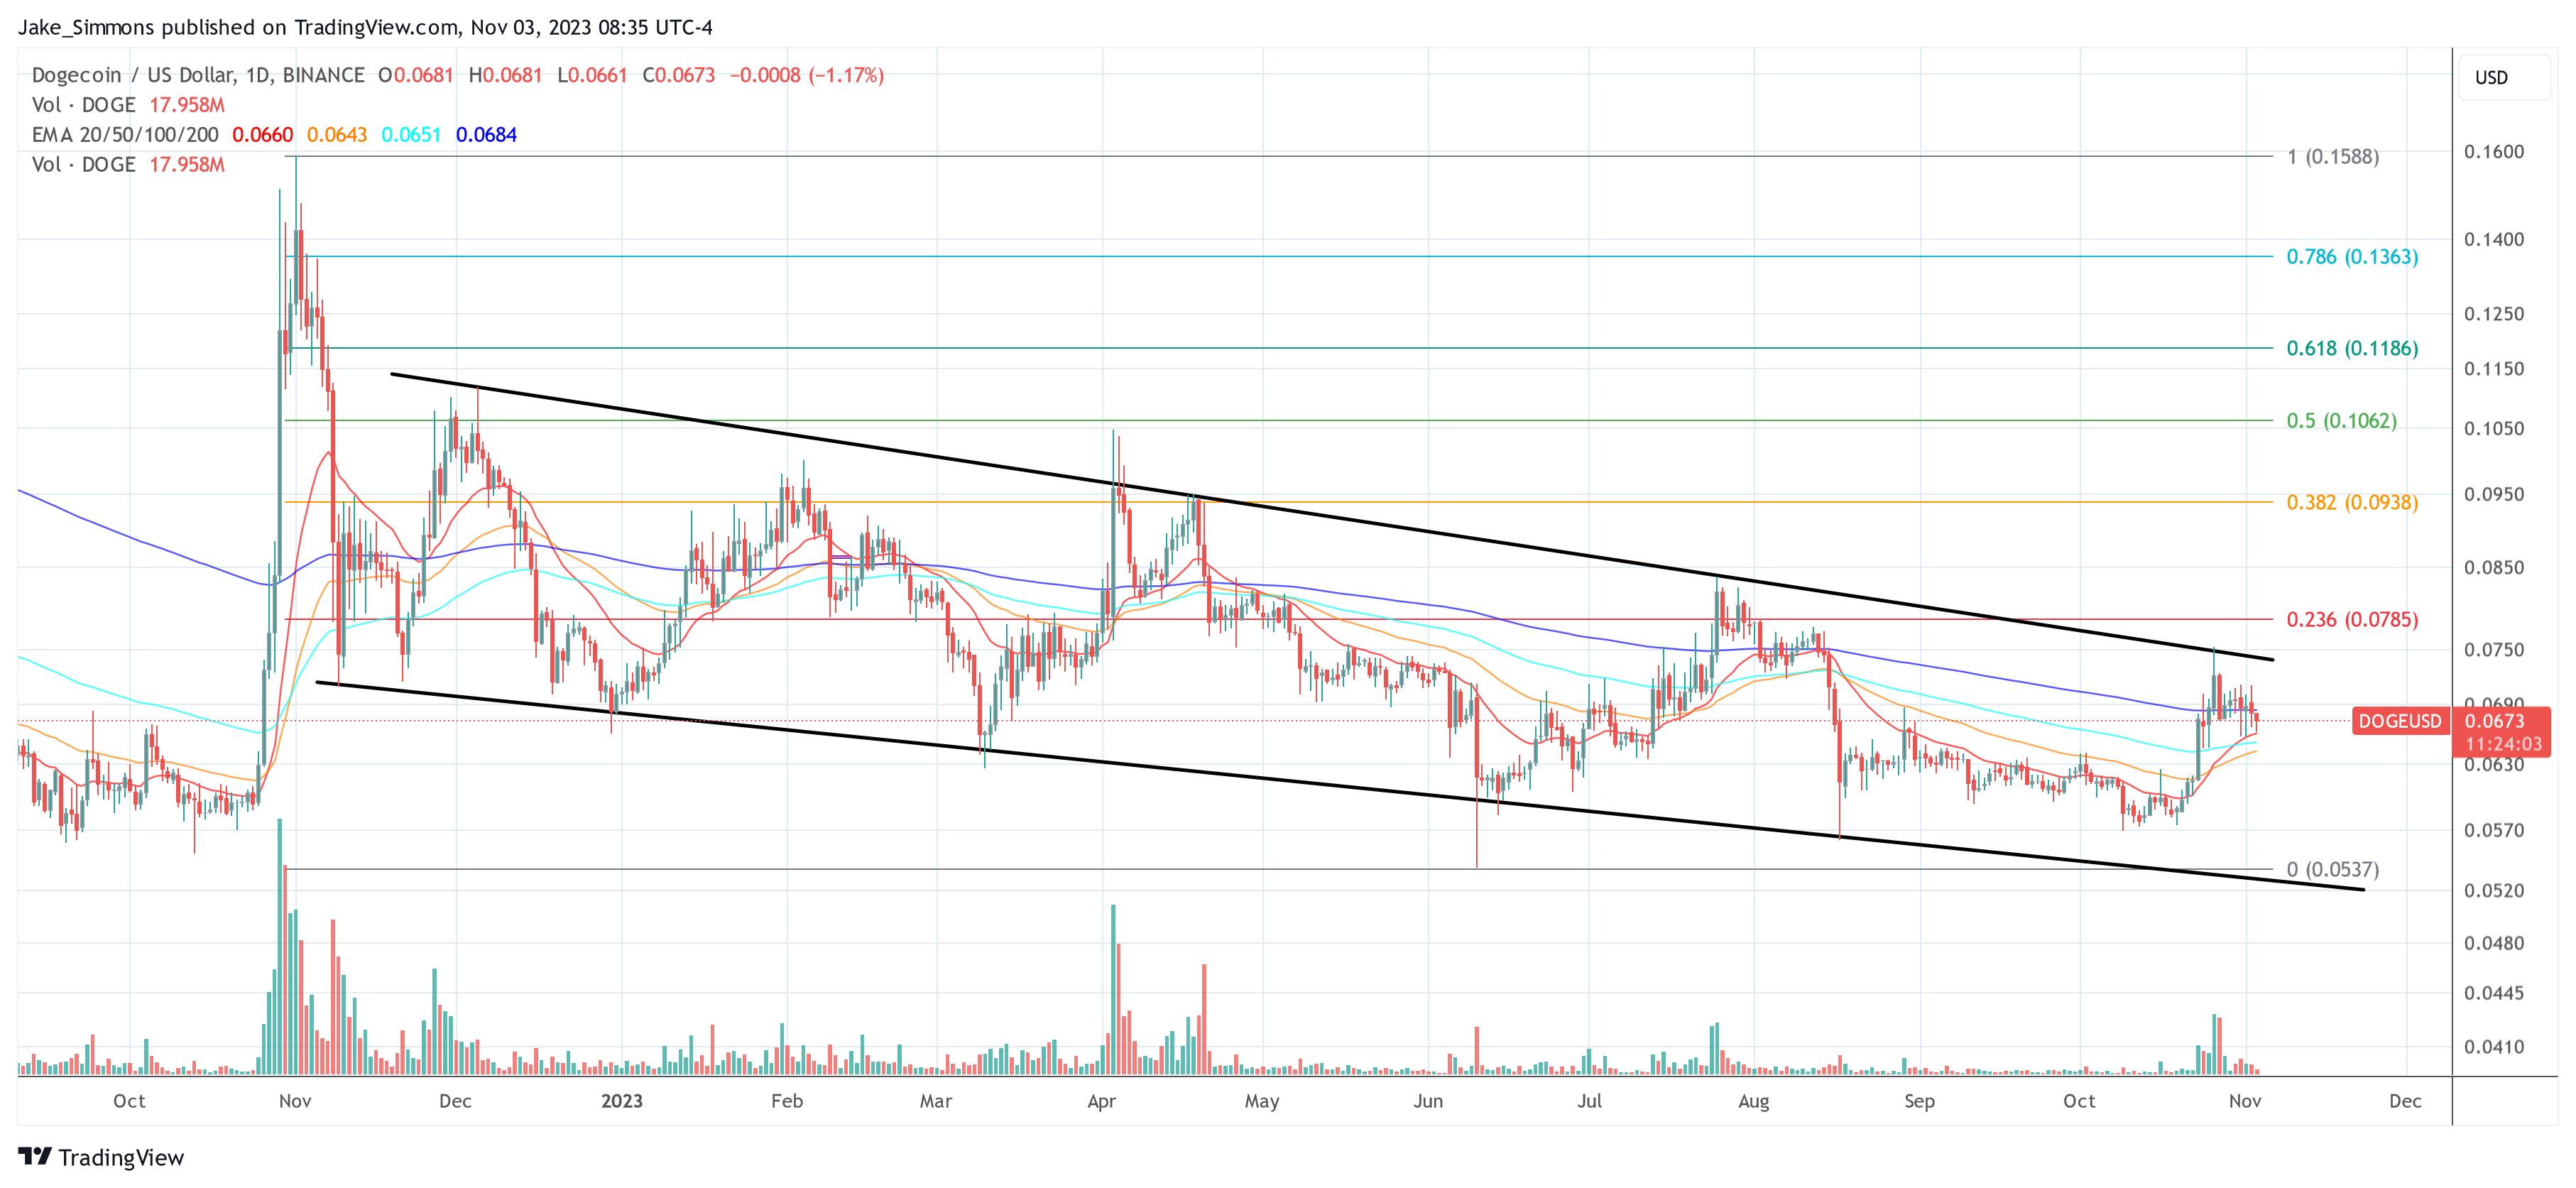
Turning to the daily chart of DOGE/USD, several key price targets can be deduced based on Fibonacci retracement levels and Exponential Moving Averages (EMAs). The EMAs, which are utilized to pinpoint potential support and resistance levels based on past price data, are showing a cluster around the $0.0660 to $0.0684 range. Currently, DOGE has dropped below the crucial 200-day EMA (blue line) at $0.0684, but found support at 20-day EMA (red line) at $0.0660.
轉向 DOGE/USD 的日線圖,可以根據斐波那契回撤水平和指數移動平均線 (EMA) 推斷出幾個關鍵價格目標。 EMA 用於根據過去的價格數據確定潛在的支撐位和阻力位,顯示出圍繞 0.0660 美元至 0.0684 美元範圍的集群。目前,DOGE已跌破關鍵的200日均線(藍線)0.0684美元,但在20日均線(紅線)0.0660美元處找到支撐。

If a breakout from the descending trend channel is successful, the 0.236 Fibonacci level at $0.0785 will probably be the first major price target. If DOGE bounces off this level, a retest of the breakout is very likely – it would be a do-or-die moment for Dogecoin. However, a successful retest could pave the way for DOGE to break above the $0.0785 price level and set the stage for the subsequent price targets.
如果成功突破下降趨勢通道,0.236 斐波那契水準(0.0785 美元)可能會成為第一個主要價格目標。如果狗狗幣從這個水平反彈,很可能會重新測試突破——這對狗狗幣來說將是一個生死攸關的時刻。然而,成功的重新測試可能為 DOGE 突破 0.0785 美元的價格水平鋪平道路,並為後續價格目標奠定基礎。
On the higher side, the Fibonacci retracement levels to watch are 0.382 ($0.0938), 0.5 ($0.1062), 0.618 ($0.1186) and 0.786 ($0.1363), which often act as critical resistance and support zones. The ultimate goal of a potential 135% rally would be the November 1 high at $0.1588.
在較高的方面,值得關注的斐波那契回檔位為0.382(0.0938 美元)、0.5(0.1062 美元)、0.618(0.1186 美元)和0.786(0.1363 美元),這些位置通常是關鍵阻力和支撐區域。潛在 135% 反彈的最終目標將是 11 月 1 日高點 0.1588 美元。
In conclusion, while the current market sentiments and patterns hint at a potential breakout, it remains imperative for DOGE to secure a weekly close above the channel top. Should this happen, and coupled with supportive market dynamics, Dogecoin could witness a breathtaking rally once again.
總之,雖然當前的市場情緒和模式暗示著潛在的突破,但 DOGE 仍必須確保週收盤價高於通道頂部。如果這種情況發生,再加上市場動態的支持,狗狗幣可能會再次見證驚人的反彈。


 CoinoMedia
 Optimisus
 CFN
CFN CFN
CFN The Crypto Times
 Cryptopolitan_News
 Crypto News Land
 CryptoNewsLand
 CoinPedia News


