Technical analysis plays a crucial role in the cryptocurrency market, especially for investors involved in futures trading. So what does technical analysis tell us about Dogecoin, which is currently trading at $0.08285? Let’s delve into a detailed chart analysis, important support and resistance levels.
テクニカル分析は、暗号通貨市場、特に先物取引に携わる投資家にとって重要な役割を果たします。それでは、テクニカル分析は現在0.08285ドルで取引されているドージコインについて何を教えてくれるのでしょうか?詳細なチャート分析、重要なサポートとレジスタンスのレベルを詳しく見てみましょう。
Four-Hour Chart Analysis of Dogecoin
ドージコインの4時間チャート分析
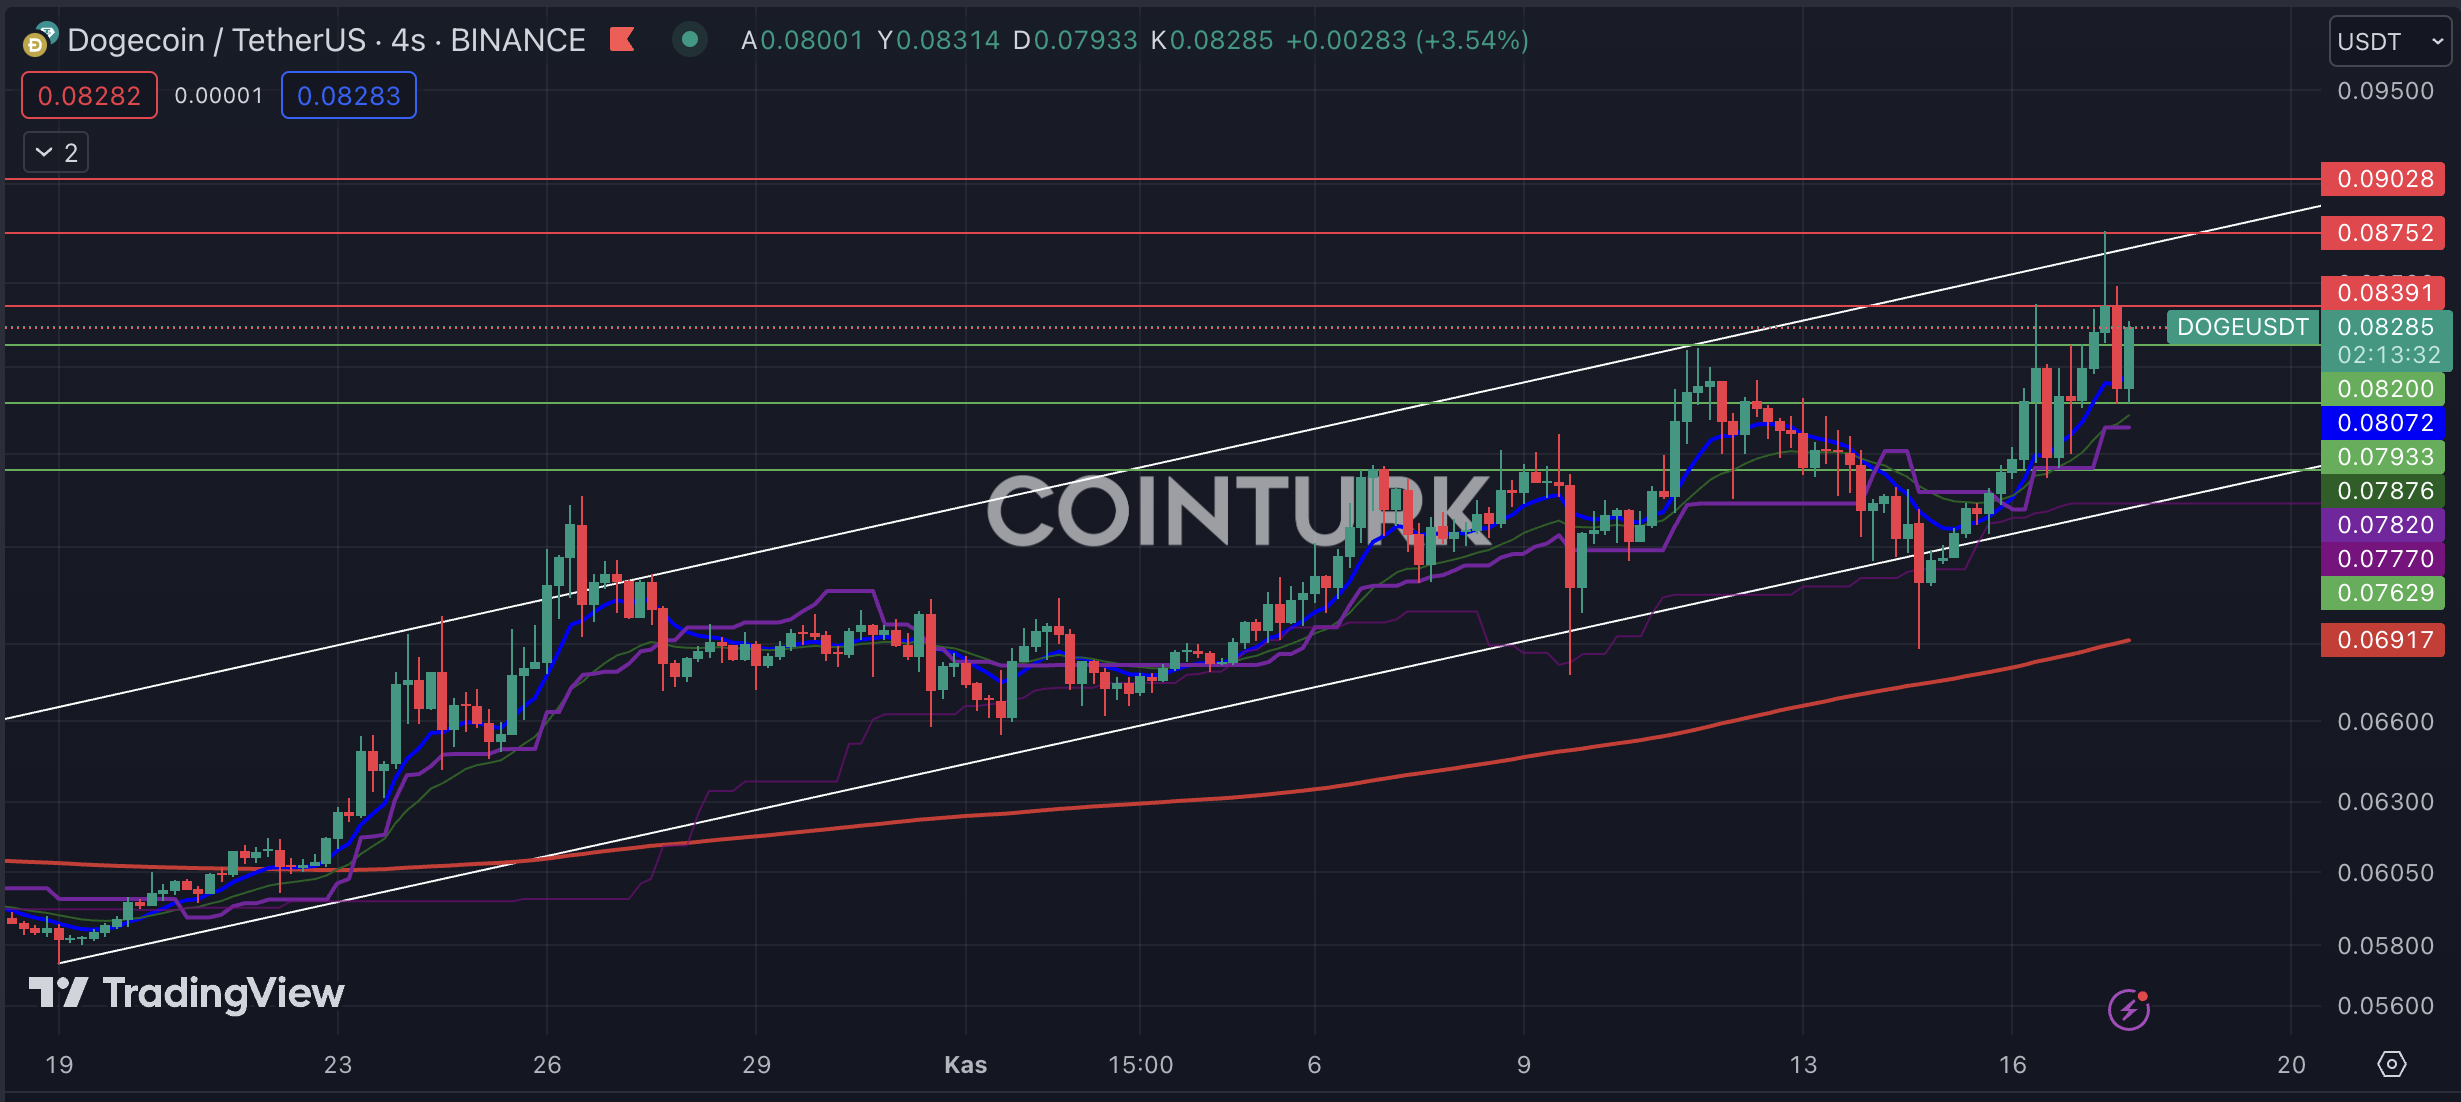
The first notable formation in the four-hour chart analysis of Dogecoin is the ascending channel pattern. After the drop on November 13, this structure formed when DOGE fell below the support line and acted as a bear trap, aiming to push investors in the futures market out of the game. Despite experiencing a significant rise after this formation, DOGE experienced a decline after touching the resistance line. However, it gained momentum within the past day after consolidating strength at the support level.
ドージコインの4時間足チャート分析における最初の注目すべき形成は、上昇チャネルパターンです。 11月13日の下落後、DOGEがサポートラインを下回り、先物市場の投資家をゲームから締め出すことを目的とした弱気の罠として機能したことで、この構造が形成された。この形成後に大幅な上昇を経験したにもかかわらず、DOGEはレジスタンスラインに触れた後に下落を経験しました。しかし、サポートレベルでの強さを固めた後、過去1日以内に勢いを増した。
The important support levels to watch for DOGE are as follows: $0.08200, $0.07933, and $0.07629. If a four-hour candle closes below the crucial level of $0.07933, it will lead to a significant loss of momentum for DOGE.
DOGE で注目すべき重要なサポート レベルは次のとおりです: $0.08200、$0.07933、および $0.07629。 4時間足のローソク足が重要なレベルである0.07933ドルを下回って終了した場合、DOGEの勢いは大幅に失われることになる。
The important resistance levels to watch for DOGE are as follows: $0.08391, $0.08752, and $0.09028. If a four-hour candle closes above the critical level of $0.08752, it will help DOGE break through the resistance and gain upward momentum.
DOGE で注目すべき重要な抵抗レベルは次のとおりです: 0.08391 ドル、0.08752 ドル、0.09028 ドル。 4時間足のローソク足が臨界水準である0.08752ドルを上回って終了すれば、DOGEが抵抗線を突破し、上昇の勢いを得るのに役立つだろう。

Two-Hour Chart Analysis of Dogecoin
ドージコインの2時間チャート分析
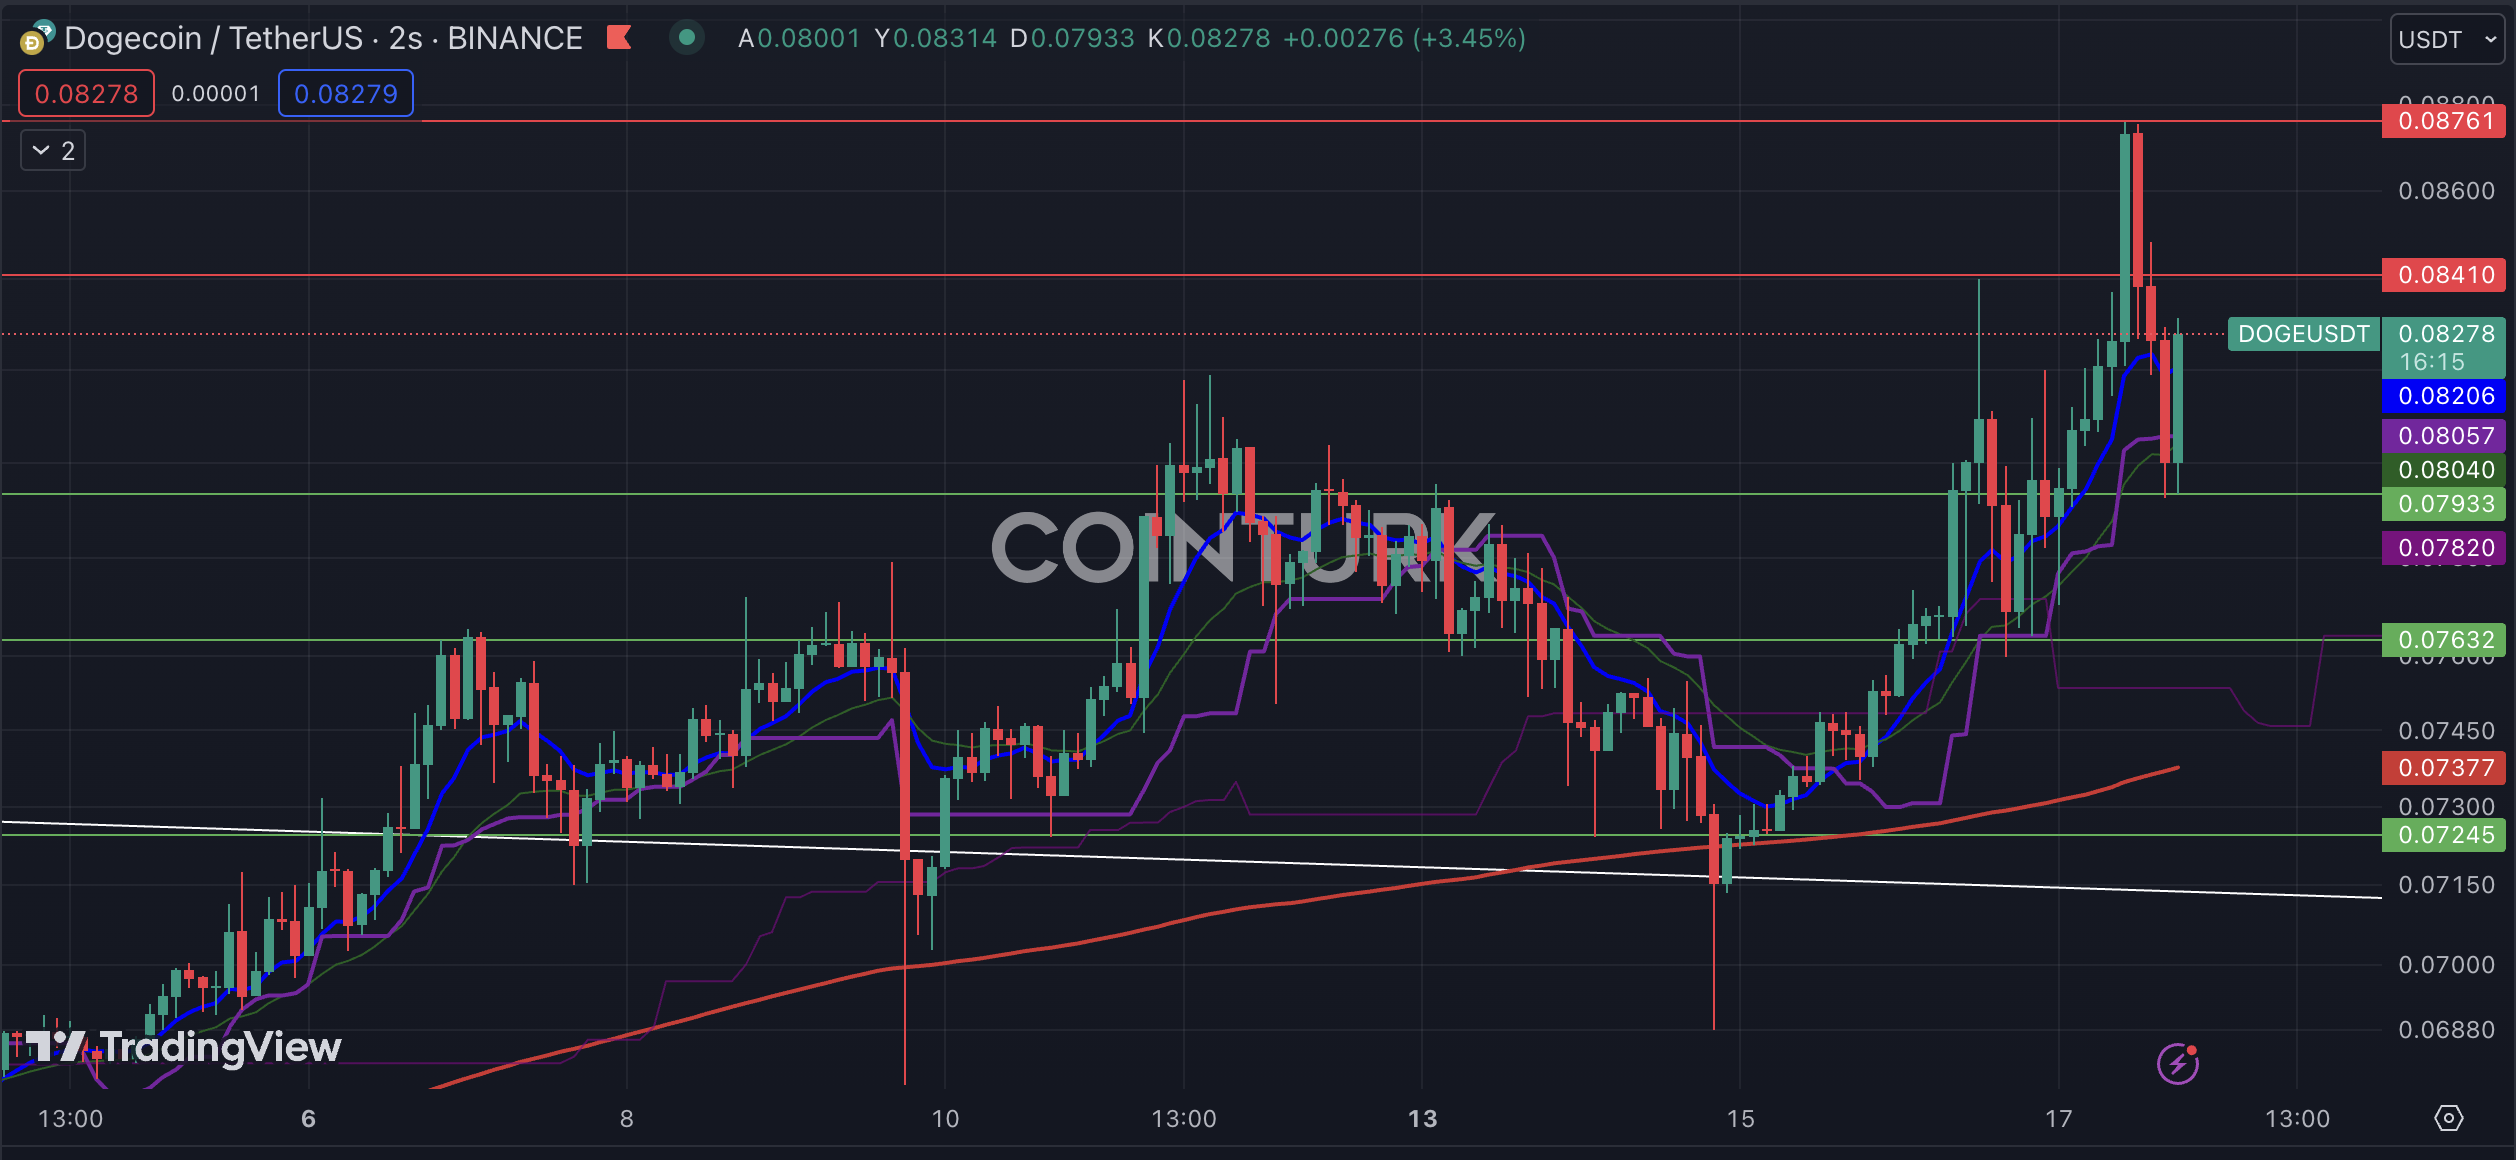
Due to the high volatility of short-term movements in the two-hour chart analysis of Dogecoin, we cannot discuss a healthy formation structure. However, the upcoming resistance breakout is of great importance for DOGE, as it weakened the upward momentum after encountering a significant obstacle during the recent rally and forming a double bottom at the support level.
ドージコインの2時間足チャート分析では短期的な動きのボラティリティが高いため、健全な形成構造について議論することはできません。しかし、最近の上昇で重大な障害に遭遇し、サポートレベルで二番底を形成した後、上昇の勢いが弱まったため、今後のレジスタンスのブレイクアウトはDOGEにとって非常に重要です。
The support levels to watch for DOGE are as follows: $0.07933, $0.07632, and $0.07245. If a candle closes below the important support level of $0.07933, it will result in a loss of momentum for DOGE.
DOGE で注目すべきサポートレベルは次のとおりです: 0.07933 ドル、0.07632 ドル、0.07245 ドル。ローソク足が重要なサポートレベルである0.07933ドルを下回って終了した場合、DOGEの勢いが失われることになります。
The resistance levels to watch for DOGE are as follows: $0.08410 and $0.08761. If a candle closes above the significant obstacle at $0.08761, it will enable DOGE to gain momentum.
DOGE で注目すべき抵抗レベルは次のとおりです: 0.08410 ドルと 0.08761 ドル。ローソク足が0.08761ドルの重要な障害を上回って終了した場合、DOGEは勢いを増すことができます。

続きを読む: https://en.coin-turk.com/dogecoin-technical-analysis- important-support-and-resistance-levels/


 DogeHome
 Crypto News Land
 ETHNews
 CFN
CFN U_Today
 Thecoinrepublic.com
 Optimisus
 Optimisus


