Cover image via U.Today
カバー画像(U.Today経由)
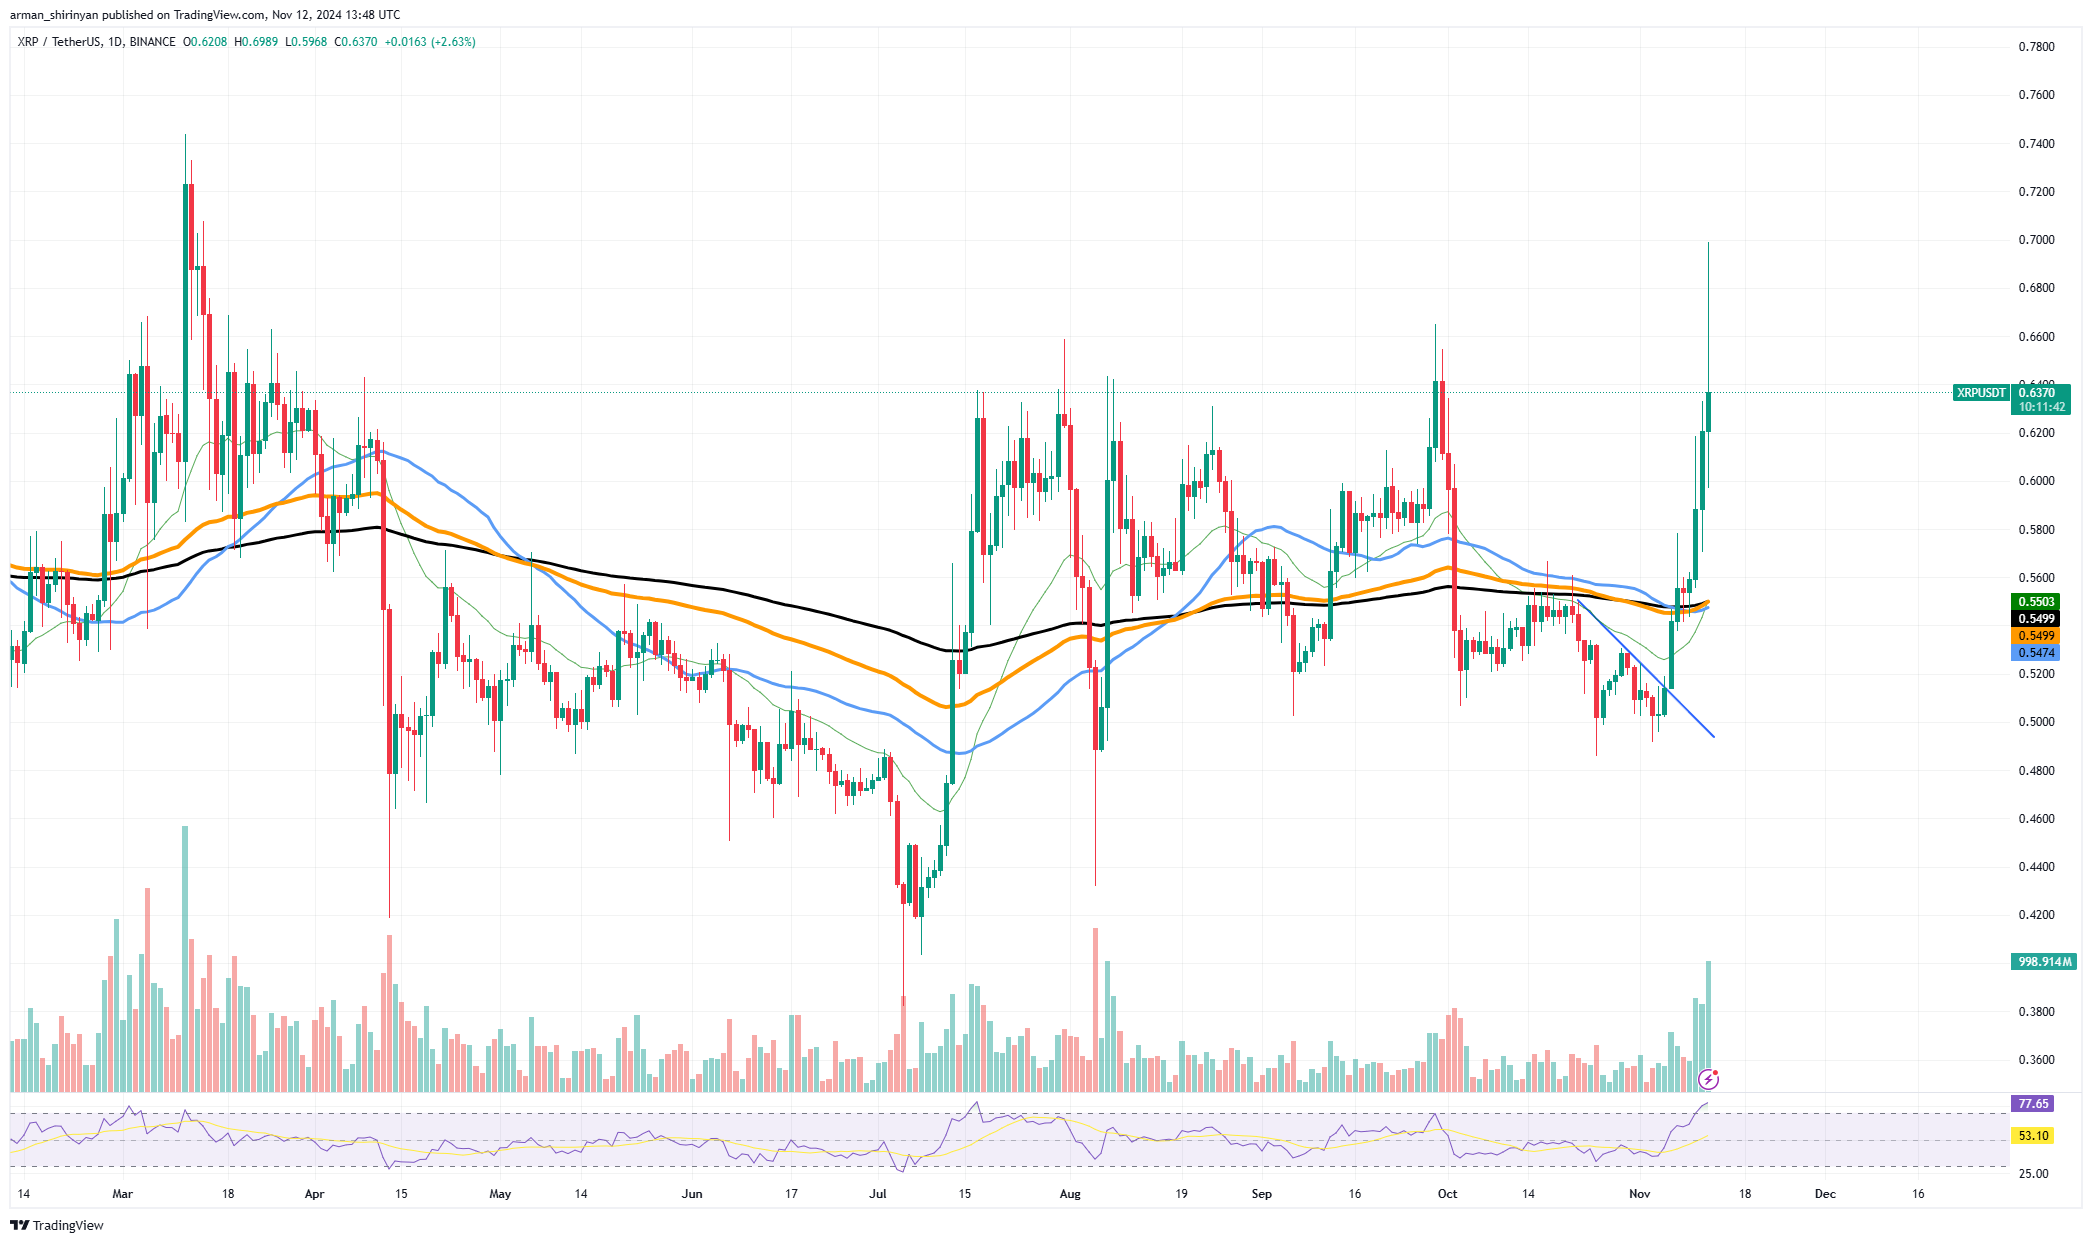
As Bitcoin relentlessly approaches $100,000, XRP recently broke through the psychological barrier of $0.60, which was expected to propel it further. However, investors are expressing concerns as XRP shows signs of a potential reversal instead of progressing in tandem.
ビットコインが執拗に10万ドルに近づく中、XRPは最近0.60ドルの心理的障壁を突破し、ビットコインはさらに上昇すると予想されていました。しかし、XRPが同時進行ではなく逆転の可能性の兆候を示しているため、投資家は懸念を表明している。
Despite positive market conditions leading to gains for even minor speculative assets, XRP inexplicably hesitates. Despite its strong momentum in early November, its price chart indicates resistance near $0.60. 
市場環境が好調なため、たとえ小規模な投機資産であっても利益が得られるにもかかわらず、XRP は不可解にも躊躇します。 11月初旬の強い勢いにもかかわらず、価格チャートは0.60ドル付近の抵抗を示しています。
If purchasing support remains weak, this level may signal a potential turning point. Technical indicators, such as the Relative Strength Index (RSI), indicate XRP approaching overbought levels, suggesting the recent surge may be waning.
購買サポートが依然として弱い場合、この水準は潜在的な転換点を示す可能性があります。相対強度指数(RSI)などのテクニカル指標はXRPが買われ過ぎの水準に近づいていることを示しており、最近の急騰が衰えつつある可能性があることを示唆している。
The market's current Bitcoin dominance and its impact on other cryptocurrencies may be contributing to XRP's relative underperformance. Leading altcoins like XRP typically follow Bitcoin's lead during bull markets.
現在の市場のビットコインの優位性と他の仮想通貨への影響が、XRPの相対的なパフォーマンス低下の一因となっている可能性があります。 XRPのような主要なアルトコインは、通常、強気市場ではビットコインに続きます。
However, the subdued reaction to XRP could indicate either market caution or profit-taking by large holders (whales). The 50 and 200-day moving averages remain below the current price, indicating substantial underlying support for XRP in the $0.54 to $0.55 range. This area may act as a cushion if the current rally falters. If XRP holds above this range and establishes support, it could avoid a deeper correction and potentially align with Bitcoin's ongoing ascent.
しかし、XRPに対する控えめな反応は、市場の警戒か大口保有者(クジラ)による利益確定のいずれかを示している可能性があります。 50日移動平均と200日移動平均は引き続き現在価格を下回っており、XRPの実質的なサポートが0.54ドルから0.55ドルの範囲にあることを示しています。現在のラリーが低迷した場合、このエリアがクッションとして機能する可能性がある。 XRPがこの範囲を上回ってサポートを確立した場合、より深い調整を回避し、ビットコインの進行中の上昇と一致する可能性があります。
Bitcoin Aims Higher
ビットコインはさらなる高みを目指す
Bitcoin is on an impressive upward trajectory, targeting the lofty $200,000 mark. Many investors anticipate Bitcoin crossing this milestone as its price continues to reach new heights. The current chart shows Bitcoin moving in a strong upward channel, surpassing significant resistance levels. High volume and upward-sloping exponential moving averages (EMAs) indicate strong momentum.
ビットコインは目覚ましい上昇軌道に乗っており、20万ドルという高額な目標を目指しています。多くの投資家は、ビットコインの価格が新たな高みに達し続ける中、この節目を超えると予想している。現在のチャートは、ビットコインが強い上昇チャネルで推移し、大幅な抵抗レベルを超えていることを示しています。出来高が多く、右肩上がりの指数移動平均 (EMA) は、勢いが強いことを示しています。
The breakout from a recent consolidation phase and the surge above $80,000 have laid a solid foundation for future gains. The Bitcoin Rainbow Chart, updated for 2023, suggests Bitcoin remains in a favorable position for continued growth. The chart's red band, historically used as a sentiment indicator, signifies a potential top and overvaluation.
最近の統合局面からのブレイクアウトと80,000ドルを超える急騰により、将来の上昇に向けた強固な基盤が築かれました。 2023年に更新されたビットコインレインボーチャートは、ビットコインが継続的な成長に向けて引き続き有利な位置にあることを示唆しています。歴史的にセンチメント指標として使用されてきたチャートの赤いバンドは、潜在的な最高値と過大評価を示します。
As Bitcoin remains below this red zone, there is confidence that the current price level can hold for some time, presenting upside potential. Another reliable Bitcoin indicator, the Two-Year MA Multiplier, suggests a possible price peak around $200,000.
ビットコインは依然としてこのレッドゾーンを下回っているため、現在の価格レベルがしばらく維持できるという確信があり、上値余地が存在します。もう1つの信頼できるビットコイン指標である2年MA乗数は、価格のピークが20万ドル付近になる可能性を示唆しています。
Bitcoin's approach to the red line in this model may signal the final leg of the bull market, correlating with previous cycle peaks. While precise percentage projections are speculative, Bitcoin's current trend and strong technical indicators provide a reasonable chance of reaching $200,000, potentially between 40 and 50%, assuming continued institutional interest, favorable macroeconomic conditions, and positive market sentiment. Investors should exercise caution, as volatility can alter the course of events quickly.
このモデルにおけるビットコインの赤い線へのアプローチは、以前のサイクルのピークと相関関係にあり、強気市場の最終区間を示唆している可能性があります。正確な割合の予測は推測の域を出ませんが、ビットコインの現在の傾向と強力なテクニカル指標は、継続的な機関投資家からの関心、良好なマクロ経済状況、前向きな市場センチメントを仮定すると、20万ドルに到達する可能性は40~50%の妥当な可能性を示しています。ボラティリティによって事態の推移が急速に変化する可能性があるため、投資家は注意を払う必要があります。
Dogecoin Secures Explosive Growth
ドージコインが爆発的な成長を確実にする
Dogecoin has witnessed remarkable growth, adding a staggering $30 billion to its market capitalization in just a week. With Dogecoin leading the charge, this surge highlights the enduring influence of meme coins in the cryptocurrency market.
ドージコインは目覚ましい成長を遂げ、わずか 1 週間で時価総額が 300 億ドルという驚異的な増加を見せました。ドージコインが先頭に立ち、この急騰は仮想通貨市場におけるミームコインの永続的な影響力を浮き彫りにしている。
Dogecoin has seen a substantial increase in wallets holding less than 100,000 DOGE in recent weeks, with 74,885 new wallets added, signaling high retail interest. This influx of smaller holders suggests growing retail confidence in DOGE, a crucial factor in sustaining its upward momentum.
ドージコインでは、ここ数週間で100,000 DOGE未満のウォレットが大幅に増加し、74,885の新しいウォレットが追加され、小売業者の関心の高さを示しています。この小規模保有者の流入は、DOGEに対する小売の信頼が高まっていることを示唆しており、DOGEの上昇勢いを維持する上で重要な要素となっている。
However, larger investors known as sharks and whales have decreased their holdings over the past month, resulting in a net decrease of 350 wallets. Despite this, 108 whale wallets re-entered the market in recent days, potentially contributing to the rally that saw DOGE reach $0.40, a level unseen in over three years.
しかし、サメやクジラとして知られる大口投資家は過去 1 か月間で保有資産を減らし、その結果、ウォレットが 350 個純減しました。それにもかかわらず、ここ数日で108個のクジラウォレットが市場に再参入し、DOGEが0.40ドルに達するという3年以上ぶりの水準に達する上昇に貢献した可能性がある。
A technical analysis of Dogecoin's price chart reveals a clear bullish phase. The price has surged, reaching heights reminiscent of its earlier highs in early 2021.
ドージコインの価格チャートのテクニカル分析では、明らかな強気の局面が明らかになりました。価格は急騰し、2021年初めの過去最高値を彷彿とさせる高さに達した。


 DogeHome
 DT News
 TheCoinrise
 Optimisus
 Optimisus
 COINTURK NEWS
 Crypto News Land
 Cryptopolitan_News


