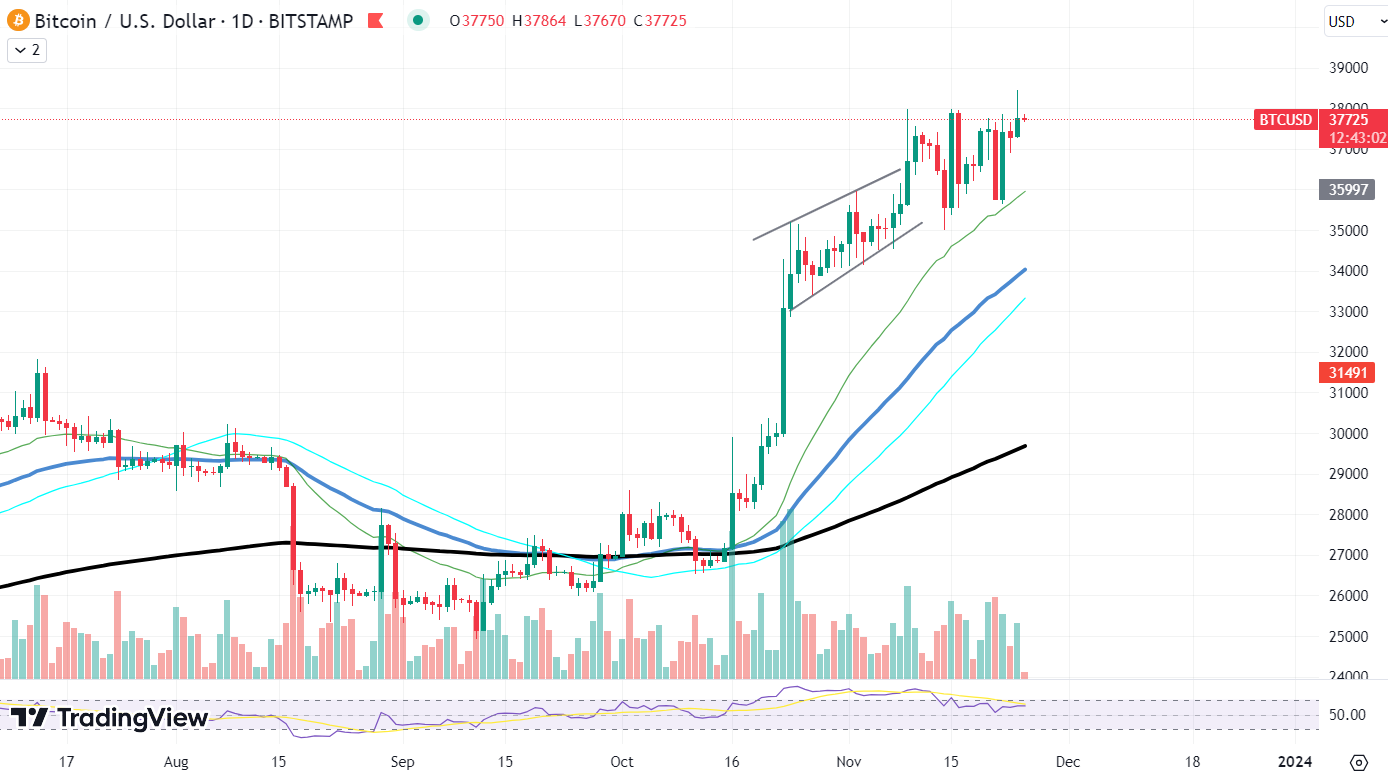
After a bullish run, BTC's momentum has stalled around the $38,000 resistance level, a critical point that has witnessed a confluence of selling pressure. The price action suggests that a short-term retracement may be on the horizon, with a potential fallback to the $35,000 support zone, according to recent analysis.
강세를 보인 후 BTC의 모멘텀은 38,000달러 저항 수준 부근에서 정체되었으며, 이는 매도 압력이 합류하는 중요한 지점입니다. 최근 분석에 따르면 가격 움직임은 단기적인 되돌림이 임박해 35,000달러 지지대까지 하락할 가능성이 있음을 시사합니다.
The daily chart exhibits a consolidation phase, where the price has faced rejection at $38K, leading to subdued volatility and price movements within a range capped by $35,000 and $38,000. This consolidation, along with an extended bearish divergence between the price and the relative strength index (RSI), indicates that bullish momentum might be waning, which could lead to a correction.
일일 차트는 가격이 $38,000에서 거부되어 $35,000~$38,000 범위 내에서 변동성이 완화되고 가격 변동이 발생하는 통합 단계를 보여줍니다. 가격과 상대강도지수(RSI) 사이의 약세 다이버전스 확장과 함께 이러한 횡보세는 강세 모멘텀이 약화되어 조정으로 이어질 수 있음을 나타냅니다.
 Bitcoin/USD chart by TradingView
A four-hour chart perspective reveals an ascending wedge pattern, which is typically considered a bearish reversal signal. Concurrently, a head and shoulders pattern is forming, nearing the completion of the right shoulder.
4시간 차트 관점에서는 일반적으로 약세 반전 신호로 간주되는 상승 쐐기 패턴이 나타납니다. 동시에 머리와 어깨 패턴이 형성되어 오른쪽 어깨가 거의 완성됩니다.
This pattern is a crucial indicator of a potential bearish reversal, becoming valid if the price dips below the pattern's neckline, potentially leading to a price drop below the wedge pattern, with key support at the $32,300 level, marked by the 0.5 Fibonacci retracement.
이 패턴은 잠재적인 약세 반전을 나타내는 중요한 지표로, 가격이 패턴의 네크라인 아래로 떨어지면 유효해지며 잠재적으로 가격이 웨지 패턴 아래로 하락할 수 있으며 0.5 피보나치 되돌림으로 표시된 $32,300 수준에서 주요 지지를 받습니다.
On-chain analysis adds another layer to the narrative. The movement of Bitcoin from miner wallets to exchanges usually implies an increase in market liquidity and selling pressure. However, there has been a decline in such activity to levels not seen since 2017, which may indicate that miners are holding onto their coins, a sign that could be interpreted as bullish sentiment.
Shiba Inu struggling
고군분투하는 시바견
Shiba Inu (SHIB) has been navigating a challenging market landscape, grappling for momentum amid a maze of consolidation patterns. The recent price action of SHIB on the Binance chart underscores a phase of compression, where the token is caught in a tug-of-war between bears and bulls, leading to a narrowing price range.
The chart reveals a symmetrical triangle pattern, characterized by two converging trendlines as the price swings high and low within a tightening range. This pattern often indicates a continuation or a reversal, with the direction of the breakout providing insight into future price trends. As SHIB approaches the apex of the triangle, the possibility of a breakout looms, with traders closely watching which way the price will veer.
Volume profiles during this period paint a cautious picture, with no significant spikes to suggest a firm decision by the market participants. A notable volume increase would be necessary to validate any potential breakout, providing the conviction needed for a sustainable price move.
SHIB's recent pattern also exhibits lower highs and higher lows, a tension that hints at an impending volatility spike. However, without a clear increase in trade volume, it is challenging to predict the direction of the breakout. Should SHIB break above the triangle's upper trendline, it would suggest bullish sentiment, potentially leading to a price surge.
Dogecoin's surprising rally
Dogecoin (DOGE), the cryptocurrency that began as a joke but became a favorite among retail investors, is now maneuvering to solidify its position above critical support levels. A glance at the DOGE/USDT chart on Binance indicates that DOGE is attempting to maintain its foothold above the intersection of the 50-day and 100-day moving averages — a bullish signal for traders looking for stability.
농담으로 시작했지만 개인 투자자들 사이에서 인기를 얻은 암호화폐인 도지코인(DOGE)은 이제 중요한 지원 수준 이상으로 입지를 확고히 하기 위해 노력하고 있습니다. 바이낸스의 DOGE/USDT 차트를 보면 DOGE가 50일 이동 평균과 100일 이동 평균의 교차점 위에서 거점을 유지하려고 시도하고 있음을 알 수 있습니다. 이는 안정성을 원하는 거래자에게 강세 신호입니다.
The chart shows DOGE recently bouncing off these moving averages, suggesting a strong area of support around the $0.078 price point. This level has become a litmus test for the meme coin, as maintaining above it may attract further buying interest. On the flip side, a fall below could trigger a sell-off, testing lower support levels.
Currently, DOGE's resistance seems to be forming near the $0.085 mark, a level that has previously seen a consolidation of sell orders. A breakthrough above this resistance could pave the way for DOGE to target the next psychological level at $0.1, a target that has eluded it in the recent past.
The trading volume has been relatively stable, without any significant spikes, which could suggest a lack of aggressive trading at the moment. However, as the crypto market is known for its volatility, any increase in volume could quickly change the current dynamic.
거래량은 큰 폭의 급등 없이 비교적 안정적으로 유지되어 현재로서는 공격적인 거래가 부족함을 시사할 수 있습니다. 그러나 암호화폐 시장은 변동성이 크기 때문에 거래량이 증가하면 현재의 역학 관계가 빠르게 바뀔 수 있습니다.


 Optimisus
 Cryptopolitan_News
 DogeHome
 Cryptopolitan
 crypto.ro English
 Crypto News Land
 ETHNews


