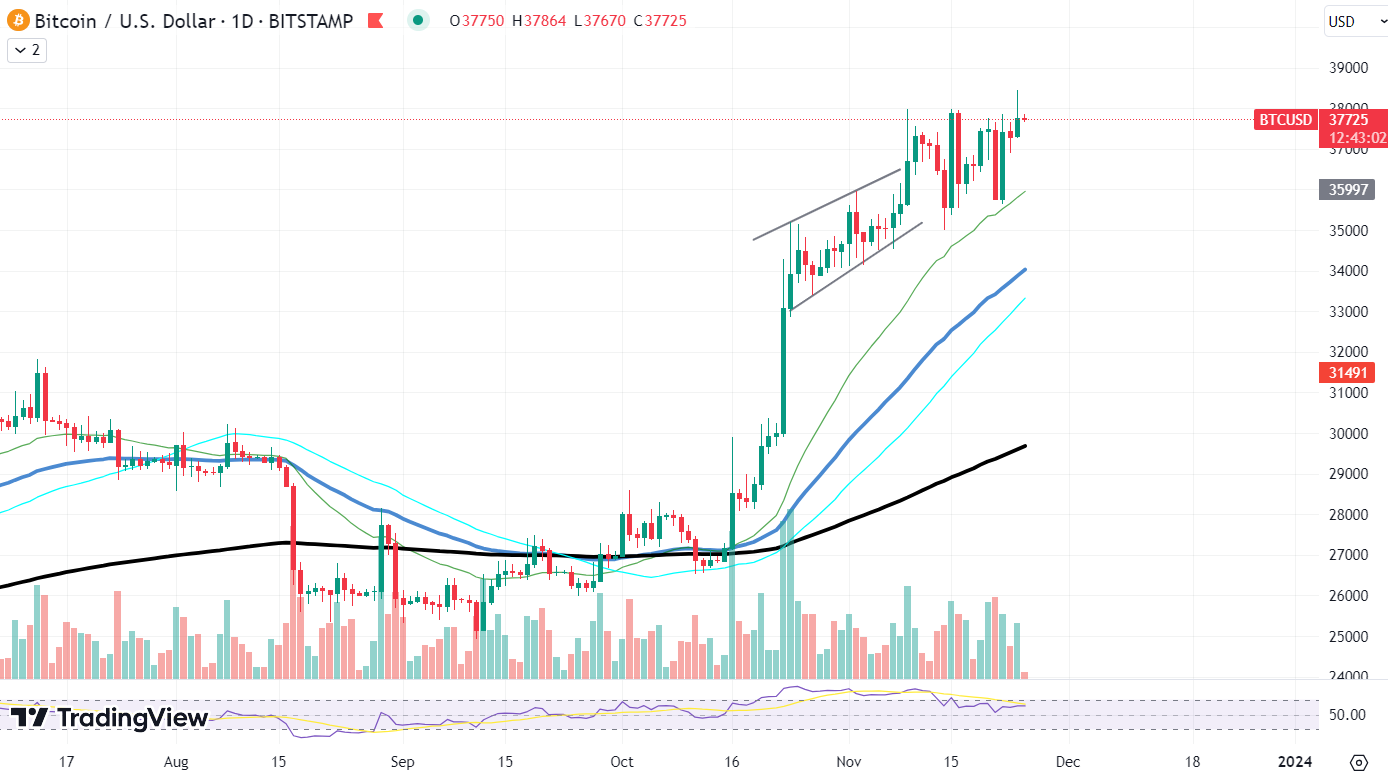
After a bullish run, BTC's momentum has stalled around the $38,000 resistance level, a critical point that has witnessed a confluence of selling pressure. The price action suggests that a short-term retracement may be on the horizon, with a potential fallback to the $35,000 support zone, according to recent analysis.
BTCの勢いは強気の展開の後、売り圧力が合流する重要なポイントである3万8000ドルの抵抗水準付近で失速している。最近の分析によると、この価格動向は、短期的なリトレースメントが目前に迫っている可能性を示唆しており、35,000ドルのサポートゾーンに後退する可能性があります。
The daily chart exhibits a consolidation phase, where the price has faced rejection at $38K, leading to subdued volatility and price movements within a range capped by $35,000 and $38,000. This consolidation, along with an extended bearish divergence between the price and the relative strength index (RSI), indicates that bullish momentum might be waning, which could lead to a correction.
日足チャートは、価格が 38,000 ドルで拒否反応に直面し、35,000 ドルと 38,000 ドルを上限とする範囲内でのボラティリティと価格変動を抑制する保ち合いの局面を示しています。この値固めは、価格と相対力指数(RSI)の間の弱気の乖離の拡大とともに、強気の勢いが弱まり、調整につながる可能性があることを示しています。
 Bitcoin/USD chart by TradingView
TradingViewによるビットコイン/USDチャート
A four-hour chart perspective reveals an ascending wedge pattern, which is typically considered a bearish reversal signal. Concurrently, a head and shoulders pattern is forming, nearing the completion of the right shoulder.
4時間足チャートの見方では、通常は弱気の反転シグナルと考えられる上昇ウェッジパターンが明らかになります。同時に、頭と肩のパターンが形成され、右肩の完成に近づいています。
This pattern is a crucial indicator of a potential bearish reversal, becoming valid if the price dips below the pattern's neckline, potentially leading to a price drop below the wedge pattern, with key support at the $32,300 level, marked by the 0.5 Fibonacci retracement.
このパターンは、弱気反転の可能性を示す重要な指標であり、価格がパターンのネックラインを下回った場合に有効となり、0.5フィボナッチリトレースメントでマークされる32,300ドルレベルが主なサポートとなり、ウェッジパターンを下回る価格下落につながる可能性があります。
On-chain analysis adds another layer to the narrative. The movement of Bitcoin from miner wallets to exchanges usually implies an increase in market liquidity and selling pressure. However, there has been a decline in such activity to levels not seen since 2017, which may indicate that miners are holding onto their coins, a sign that could be interpreted as bullish sentiment.
オンチェーン分析は、物語に別の層を追加します。マイナーウォレットから取引所へのビットコインの移動は、通常、市場の流動性と売り圧力の増加を意味します。しかし、そのような活動は2017年以来見られなかったレベルまで低下しており、これはマイナーがコインを保持していることを示している可能性があり、これは強気のセンチメントとして解釈される可能性があります。
Shiba Inu struggling
奮闘する柴犬
Shiba Inu (SHIB) has been navigating a challenging market landscape, grappling for momentum amid a maze of consolidation patterns. The recent price action of SHIB on the Binance chart underscores a phase of compression, where the token is caught in a tug-of-war between bears and bulls, leading to a narrowing price range.
柴犬 (SHIB) は、迷路のような統合パターンの中で勢いを求めて格闘しながら、困難な市場環境を乗り越えてきました。 BinanceチャートにおけるSHIBの最近の価格動向は、トークンが弱気派と強気派の間の綱引きに巻き込まれ、価格幅の縮小につながる圧縮段階を強調しています。
The chart reveals a symmetrical triangle pattern, characterized by two converging trendlines as the price swings high and low within a tightening range. This pattern often indicates a continuation or a reversal, with the direction of the breakout providing insight into future price trends. As SHIB approaches the apex of the triangle, the possibility of a breakout looms, with traders closely watching which way the price will veer.
チャートは対称的な三角形のパターンを示しており、価格が引き締めレンジ内で高値と安値に振れる際に 2 つの収束するトレンドラインを特徴としています。このパターンは多くの場合、継続または反転を示しており、ブレイクアウトの方向によって将来の価格トレンドに対する洞察が得られます。 SHIBがトライアングルの頂点に近づくにつれて、トレーダーらは価格がどちらの方向に向かうのかを注意深く観察しており、ブレイクアウトの可能性が迫っている。
Volume profiles during this period paint a cautious picture, with no significant spikes to suggest a firm decision by the market participants. A notable volume increase would be necessary to validate any potential breakout, providing the conviction needed for a sustainable price move.
この期間の出来高プロファイルは慎重な状況を示しており、市場参加者による確固たる決定を示唆するような大きな急増は見られません。潜在的なブレイクアウトを検証し、持続可能な価格変動に必要な確信を得るには、大幅な取引高の増加が必要となるでしょう。
SHIB's recent pattern also exhibits lower highs and higher lows, a tension that hints at an impending volatility spike. However, without a clear increase in trade volume, it is challenging to predict the direction of the breakout. Should SHIB break above the triangle's upper trendline, it would suggest bullish sentiment, potentially leading to a price surge.
SHIBの最近のパターンも高値が低く安値が高く、差し迫ったボラティリティの急上昇を示唆する緊張感を示している。しかし、取引量の明確な増加がなければ、ブレイクアウトの方向を予測するのは困難です。 SHIBがトライアングルの上側トレンドラインを上抜けた場合、強気のセンチメントを示唆し、価格の急騰につながる可能性があります。
Dogecoin's surprising rally
ドージコインの驚くべき上昇
Dogecoin (DOGE), the cryptocurrency that began as a joke but became a favorite among retail investors, is now maneuvering to solidify its position above critical support levels. A glance at the DOGE/USDT chart on Binance indicates that DOGE is attempting to maintain its foothold above the intersection of the 50-day and 100-day moving averages — a bullish signal for traders looking for stability.
ジョークとして始まり個人投資家の間で人気となった仮想通貨ドージコイン(DOGE)は現在、重要なサポートレベルを超えてその地位を固めようと動いている。 Binance の DOGE/USDT チャートを一目見ると、DOGE が 50 日移動平均線と 100 日移動平均線の交点より上に足場を維持しようとしていることがわかります。これは安定性を求めるトレーダーにとって強気のシグナルです。
The chart shows DOGE recently bouncing off these moving averages, suggesting a strong area of support around the $0.078 price point. This level has become a litmus test for the meme coin, as maintaining above it may attract further buying interest. On the flip side, a fall below could trigger a sell-off, testing lower support levels.
チャートは、DOGEが最近これらの移動平均から反発していることを示しており、0.078ドルの価格ポイント付近に強力なサポートエリアがあることを示唆しています。この水準はミームコインにとってのリトマス試験紙となっており、この水準を維持するとさらなる購入意欲を集める可能性がある。逆に、これを下回ると下落が起こり、サポートレベルの低下を試す可能性がある。
Currently, DOGE's resistance seems to be forming near the $0.085 mark, a level that has previously seen a consolidation of sell orders. A breakthrough above this resistance could pave the way for DOGE to target the next psychological level at $0.1, a target that has eluded it in the recent past.
現在、DOGEの抵抗線は0.085ドル付近に形成されているようで、これまで売り注文が固まっていた水準である。この抵抗線を突破できれば、DOGEが次の心理的水準である0.1ドルを目標とする道が開かれる可能性があるが、この目標は最近は達成できなかった。
The trading volume has been relatively stable, without any significant spikes, which could suggest a lack of aggressive trading at the moment. However, as the crypto market is known for its volatility, any increase in volume could quickly change the current dynamic.
取引高は比較的安定しており、大きな急増は見られず、現時点で積極的な取引が行われていないことを示唆している可能性がある。ただし、仮想通貨市場はボラティリティが高いことで知られているため、取引量が増加すると現在の状況が急速に変化する可能性があります。


 DogeHome
 Optimisus
 Crypto News Land
 Optimisus
 Cryptopolitan_News
 Cryptopolitan


