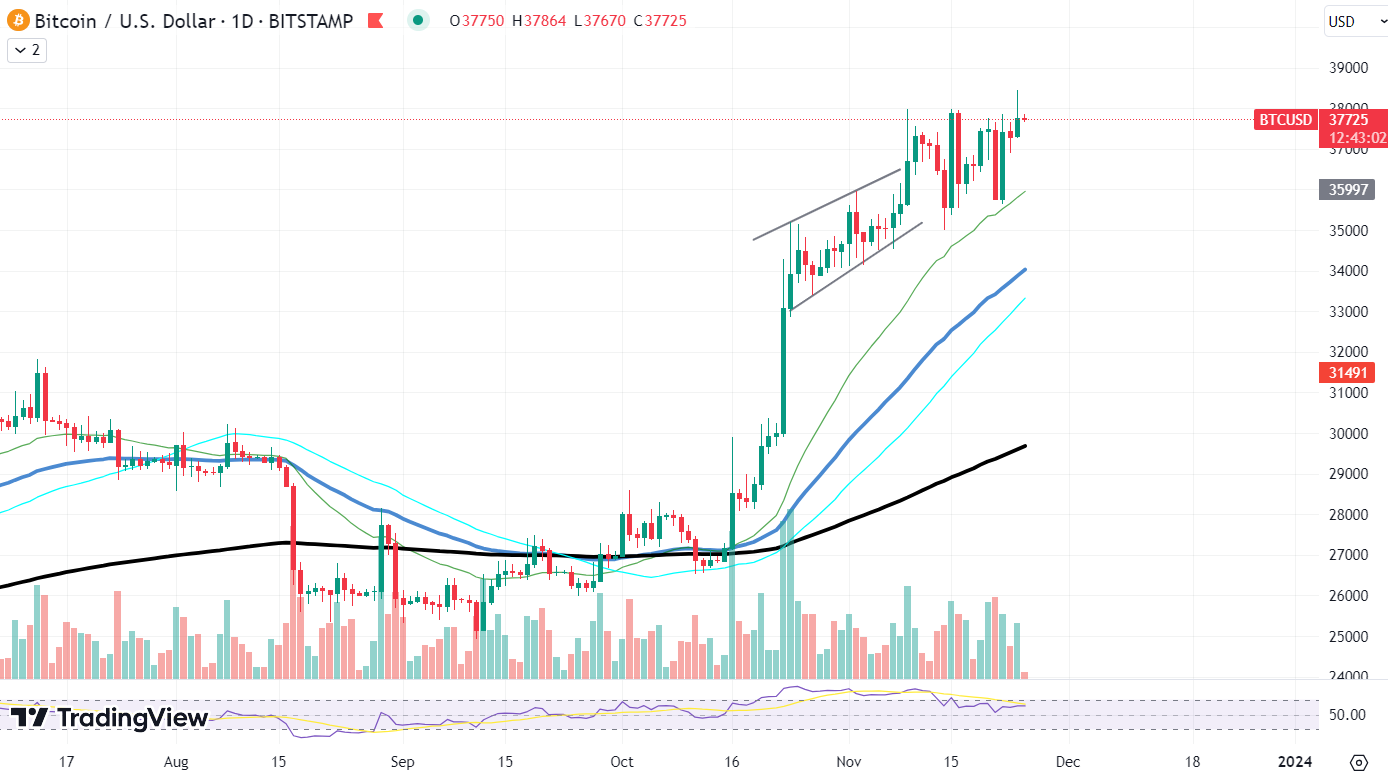
After a bullish run, BTC's momentum has stalled around the $38,000 resistance level, a critical point that has witnessed a confluence of selling pressure. The price action suggests that a short-term retracement may be on the horizon, with a potential fallback to the $35,000 support zone, according to recent analysis.
在多頭市場之後,BTC 的勢頭在 38,000 美元阻力位附近陷入停滯,這是見證拋售壓力匯合的關鍵點。根據最近的分析,價格走勢表明短期回檔可能即將到來,有可能回落至 35,000 美元的支撐區域。
The daily chart exhibits a consolidation phase, where the price has faced rejection at $38K, leading to subdued volatility and price movements within a range capped by $35,000 and $38,000. This consolidation, along with an extended bearish divergence between the price and the relative strength index (RSI), indicates that bullish momentum might be waning, which could lead to a correction.
日線圖顯示出盤整階段,價格在 38,000 美元處遭遇拒絕,導致波動性減弱,價格波動在 35,000 美元和 38,000 美元的上限範圍內。這種盤整,加上價格與相對強弱指數(RSI)之間的看跌背離擴大,表明看漲勢頭可能正在減弱,這可能導致回調。
 Bitcoin/USD chart by TradingView
比特幣/美元圖表由TradingView提供
A four-hour chart perspective reveals an ascending wedge pattern, which is typically considered a bearish reversal signal. Concurrently, a head and shoulders pattern is forming, nearing the completion of the right shoulder.
四小時圖表視角揭示了上升楔形形態,這通常被認為是看跌反轉訊號。同時,頭肩形態正在形成,右肩即將完成。
This pattern is a crucial indicator of a potential bearish reversal, becoming valid if the price dips below the pattern's neckline, potentially leading to a price drop below the wedge pattern, with key support at the $32,300 level, marked by the 0.5 Fibonacci retracement.
該形態是潛在看跌反轉的關鍵指標,如果價格跌破該形態的頸線,該形態就會生效,可能導致價格跌破楔形形態,關鍵支撐位為32,300 美元,以0.5 斐波那契回撤位為標誌。
On-chain analysis adds another layer to the narrative. The movement of Bitcoin from miner wallets to exchanges usually implies an increase in market liquidity and selling pressure. However, there has been a decline in such activity to levels not seen since 2017, which may indicate that miners are holding onto their coins, a sign that could be interpreted as bullish sentiment.
鏈上分析為敘述增添了另一層內容。比特幣從礦工錢包轉移到交易所通常意味著市場流動性和拋售壓力的增加。然而,此類活動已下降至 2017 年以來的最低水平,這可能表明礦工正在持有他們的代幣,這一跡象可以被解釋為看漲情緒。
Shiba Inu struggling
柴犬掙扎
Shiba Inu (SHIB) has been navigating a challenging market landscape, grappling for momentum amid a maze of consolidation patterns. The recent price action of SHIB on the Binance chart underscores a phase of compression, where the token is caught in a tug-of-war between bears and bulls, leading to a narrowing price range.
柴犬 (SHIB) 一直在充滿挑戰的市場環境中前行,在錯綜複雜的整合模式中努力爭取動力。 SHIB 最近在幣安圖表上的價格走勢凸顯了一個壓縮階段,該代幣陷入了空頭和多頭之間的拉鋸戰,導致價格範圍縮小。
The chart reveals a symmetrical triangle pattern, characterized by two converging trendlines as the price swings high and low within a tightening range. This pattern often indicates a continuation or a reversal, with the direction of the breakout providing insight into future price trends. As SHIB approaches the apex of the triangle, the possibility of a breakout looms, with traders closely watching which way the price will veer.
此圖表顯示了一個對稱的三角形模式,其特徵是當價格在緊縮區間內高低波動時兩條趨同的趨勢線。這種模式通常表示持續或逆轉,突破的方向可以洞察未來的價格趨勢。隨著 SHIB 接近三角形的頂點,突破的可能性迫在眉睫,交易者密切關注價格將走向何方。
Volume profiles during this period paint a cautious picture, with no significant spikes to suggest a firm decision by the market participants. A notable volume increase would be necessary to validate any potential breakout, providing the conviction needed for a sustainable price move.
在此期間的成交量概況描繪了一幅謹慎的景象,沒有出現明顯的峰值表明市場參與者做出了堅定的決定。成交量的顯著增加對於驗證任何潛在的突破是必要的,從而為可持續的價格走勢提供了所需的信念。
SHIB's recent pattern also exhibits lower highs and higher lows, a tension that hints at an impending volatility spike. However, without a clear increase in trade volume, it is challenging to predict the direction of the breakout. Should SHIB break above the triangle's upper trendline, it would suggest bullish sentiment, potentially leading to a price surge.
SHIB 近期的形態也表現出較低的高點和較高的低點,這種緊張局勢暗示著波動性即將飆升。然而,在交易量沒有明顯增加的情況下,很難預測突破的方向。如果 SHIB 突破三角形的上部趨勢線,則表示看漲情緒,可能導致價格飆升。
Dogecoin's surprising rally
狗狗幣的驚人反彈
Dogecoin (DOGE), the cryptocurrency that began as a joke but became a favorite among retail investors, is now maneuvering to solidify its position above critical support levels. A glance at the DOGE/USDT chart on Binance indicates that DOGE is attempting to maintain its foothold above the intersection of the 50-day and 100-day moving averages — a bullish signal for traders looking for stability.
狗狗幣(DOGE)是一種加密貨幣,一開始只是一個笑話,但後來成為散戶投資者的最愛,現在正在採取措施鞏固其在關鍵支撐位之上的地位。幣安上的 DOGE/USDT 圖表顯示,DOGE 正試圖將其立足點維持在 50 日和 100 日移動平均線交叉點之上,這對於尋求穩定的交易者來說是一個看漲信號。
The chart shows DOGE recently bouncing off these moving averages, suggesting a strong area of support around the $0.078 price point. This level has become a litmus test for the meme coin, as maintaining above it may attract further buying interest. On the flip side, a fall below could trigger a sell-off, testing lower support levels.
該圖表顯示 DOGE 最近從這些移動平均線反彈,顯示 0.078 美元價格點附近存在強大的支撐區域。這一水平已成為模因幣的試金石,因為維持在該水平之上可能會吸引更多的購買興趣。另一方面,跌破可能引發拋售,測試較低的支撐位。
Currently, DOGE's resistance seems to be forming near the $0.085 mark, a level that has previously seen a consolidation of sell orders. A breakthrough above this resistance could pave the way for DOGE to target the next psychological level at $0.1, a target that has eluded it in the recent past.
目前,DOGE 的阻力似乎正在 0.085 美元關卡附近形成,該水平此前曾出現過賣單盤整。突破這一阻力位可能為 DOGE 瞄準下一個心理價位 0.1 美元鋪平道路,而該目標在最近一段時間內一直未能實現。
The trading volume has been relatively stable, without any significant spikes, which could suggest a lack of aggressive trading at the moment. However, as the crypto market is known for its volatility, any increase in volume could quickly change the current dynamic.
交易量相對穩定,沒有出現任何明顯的峰值,這可能表明目前缺乏激進的交易。然而,由於加密市場以其波動性而聞名,任何交易量的增加都可能迅速改變當前的動態。


 DogeHome
 Cryptopolitan
 crypto.ro English
 Crypto News Land
 ETHNews
 CFN
CFN U_Today


