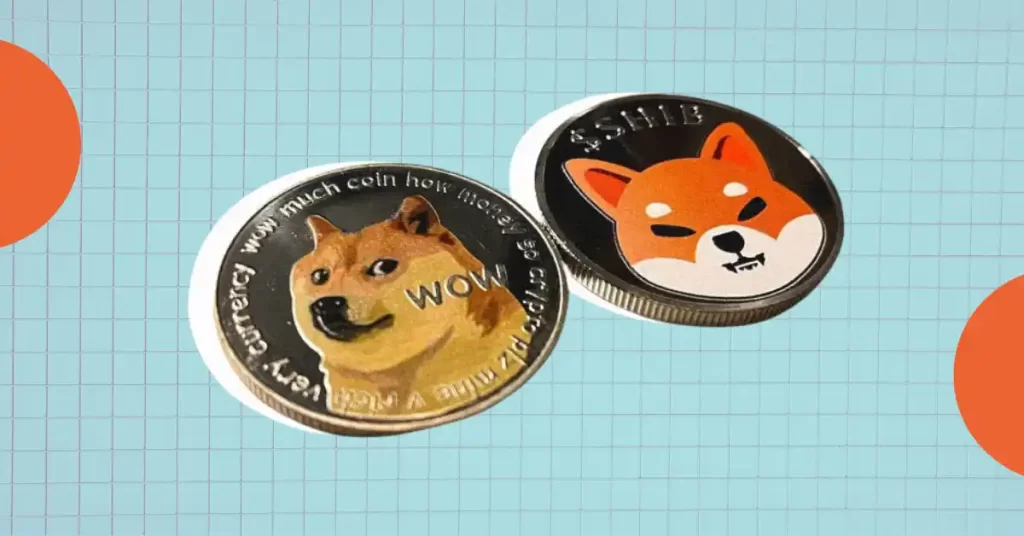
As Crypto Market Soars, Will DOGE and SHIB Tokens Lead the Memecoin Rally?
암호화폐 시장이 급등함에 따라 DOGE와 SHIB 토큰이 Memecoin 랠리를 이끌까요?
Following a recent price surge, Bitcoin has regained momentum, pushing past $63,000. This has sparked an uptick in the memecoin sector, leading to a bullish reversal.
최근 가격 급등 이후 비트코인은 다시 탄력을 받아 63,000달러를 돌파했습니다. 이는 밈코인 부문의 상승을 촉발하여 강세 반전을 가져왔습니다.
However, the top two memecoins, Dogecoin (DOGE) and Shiba Inu (SHIB), have recently experienced a sell-off, losing most of their recent gains. Both are now approaching key support levels.
그러나 상위 2개 밈코인인 도지코인(DOGE)과 시바견(SHIB)은 최근 매도세를 보이며 최근 상승폭을 대부분 잃었습니다. 둘 다 이제 주요 지원 수준에 접근하고 있습니다.
With the growing bullish sentiment in the cryptocurrency market, it remains to be seen whether DOGE and SHIB can rebound and lead the next memecoin rally.
암호화폐 시장에서 낙관적인 정서가 커지면서 DOGE와 SHIB가 반등하여 다음 밈코인 랠리를 이끌 수 있을지 지켜볼 일입니다.
Dogecoin (DOGE) Market Analysis
도지코인(DOGE) 시장 분석
DOGE has corrected by approximately 3% in the past 24 hours. Over the past 30 days, it has lost 22.70%.
DOGE는 지난 24시간 동안 약 3% 정도 수정했습니다. 지난 30일 동안 22.70% 하락했다.
Technical indicators suggest a neutral trend for DOGE, with the Relative Strength Index (RSI) hovering below the midpoint.
기술 지표는 상대강도지수(RSI)가 중간점 아래를 맴돌면서 DOGE의 중립 추세를 시사합니다.
If buyers push DOGE above the resistance level of $0.12730, it could regain bullish momentum and test its triangle pattern resistance trendline. Success at this level could lead to a further rise towards $0.15575.
구매자가 DOGE를 저항 수준 $0.12730 이상으로 올리면 강세 모멘텀을 되찾고 삼각형 패턴 저항 추세선을 테스트할 수 있습니다. 이 수준에서 성공하면 $0.15575까지 추가 상승할 수 있습니다.
Conversely, if sellers break below the support trendline, DOGE could fall to $0.1010 and potentially $0.0740, its yearly low.
반대로, 판매자가 지지 추세선 아래로 떨어지면 DOGE는 연간 최저치인 $0.1010 및 잠재적으로 $0.0740까지 하락할 수 있습니다.
Shiba Inu (SHIB) Market Analysis
시바견(SHIB) 시장 분석
SHIB has declined by 1.32% in the past day, with a trading volume of $175.63 million. Over the past month, it has lost 31.01%.
SHIB는 거래량이 1억 7,563만 달러로 전일 대비 1.32% 하락했습니다. 지난 한 달간 31.01% 하락했다.
The Simple Moving Average (SMA) acts as resistance for SHIB in the 1D timeframe. The Moving Average Convergence Divergence (MACD) indicator is mixed, with rising green bars but a neutral average.
단순 이동 평균(SMA)은 1D 기간에서 SHIB에 대한 저항 역할을 합니다. MACD(Moving Average Convergence Divergence) 지표는 녹색 막대가 상승하지만 중립 평균을 보이는 혼합형입니다.
If buying pressure fades, SHIB could break its crucial support level and fall to $0.0000175. If buyers recover, it could test its resistance level of $0.00002350.
매수 압력이 줄어들면 SHIB는 중요한 지원 수준을 깨고 $0.0000175까지 떨어질 수 있습니다. 구매자가 회복하면 $0.00002350의 저항 수준을 테스트할 수 있습니다.


 DogeHome
 Crypto News Land
 ETHNews
 CFN
CFN U_Today
 Thecoinrepublic.com
 Optimisus
 Optimisus


