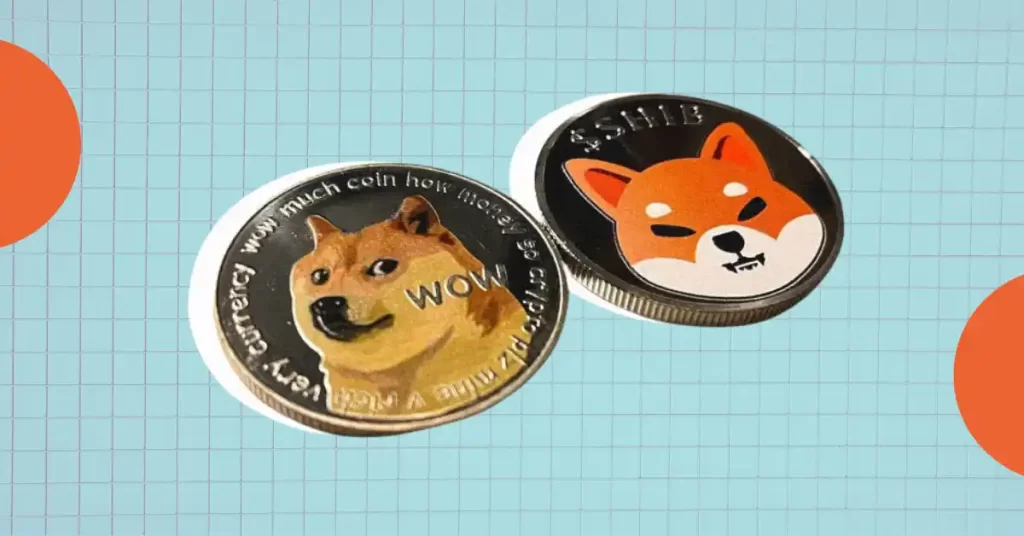
As Crypto Market Soars, Will DOGE and SHIB Tokens Lead the Memecoin Rally?
仮想通貨市場が急騰する中、DOGEトークンとSHIBトークンがMemecoinラリーをリードするでしょうか?
Following a recent price surge, Bitcoin has regained momentum, pushing past $63,000. This has sparked an uptick in the memecoin sector, leading to a bullish reversal.
最近の価格高騰を受けてビットコインは勢いを取り戻し、6万3000ドルを超えた。これはミームコインセクターの上昇を引き起こし、強気の反転につながりました。
However, the top two memecoins, Dogecoin (DOGE) and Shiba Inu (SHIB), have recently experienced a sell-off, losing most of their recent gains. Both are now approaching key support levels.
しかし、上位2つのミームコイン、ドージコイン(DOGE)と柴犬(SHIB)は最近急落を経験し、最近の上昇分のほとんどを失いました。どちらも現在、主要なサポートレベルに近づいています。
With the growing bullish sentiment in the cryptocurrency market, it remains to be seen whether DOGE and SHIB can rebound and lead the next memecoin rally.
仮想通貨市場で強気の感情が高まる中、DOGEとSHIBが回復して次のミームコインの上昇を主導できるかどうかはまだ分からない。
Dogecoin (DOGE) Market Analysis
ドージコイン(DOGE)市場分析
DOGE has corrected by approximately 3% in the past 24 hours. Over the past 30 days, it has lost 22.70%.
DOGE は過去 24 時間で約 3% 修正されました。過去30日間では22.70%下落した。
Technical indicators suggest a neutral trend for DOGE, with the Relative Strength Index (RSI) hovering below the midpoint.
テクニカル指標は、DOGE の中立的な傾向を示唆しており、相対力指数 (RSI) は中間点を下回って推移しています。
If buyers push DOGE above the resistance level of $0.12730, it could regain bullish momentum and test its triangle pattern resistance trendline. Success at this level could lead to a further rise towards $0.15575.
買い手がDOGEをレジスタンスレベルの0.12730ドルを超えて押し上げれば、強気の勢いを取り戻し、トライアングルパターンのレジスタンストレンドラインを試す可能性がある。このレベルで成功すれば、0.15575ドルに向けてさらに上昇する可能性がある。
Conversely, if sellers break below the support trendline, DOGE could fall to $0.1010 and potentially $0.0740, its yearly low.
逆に、売り手がサポートトレンドラインを下抜けた場合、DOGEは0.1010ドルまで下落する可能性があり、年初来安値となる0.0740ドルまで下落する可能性がある。
Shiba Inu (SHIB) Market Analysis
柴犬(SHIB)市場分析
SHIB has declined by 1.32% in the past day, with a trading volume of $175.63 million. Over the past month, it has lost 31.01%.
SHIBは過去1日で1.32%下落し、出来高は1億7563万ドルとなった。過去1カ月では31.01%下落した。
The Simple Moving Average (SMA) acts as resistance for SHIB in the 1D timeframe. The Moving Average Convergence Divergence (MACD) indicator is mixed, with rising green bars but a neutral average.
単純移動平均 (SMA) は、1D タイムフレームにおける SHIB のレジスタンスとして機能します。移動平均収束ダイバージェンス (MACD) インジケーターはまちまちで、緑色のバーは上昇していますが、平均は中立です。
If buying pressure fades, SHIB could break its crucial support level and fall to $0.0000175. If buyers recover, it could test its resistance level of $0.00002350.
買い圧力が弱まれば、SHIBは重要なサポートレベルを突破し、0.0000175ドルまで下落する可能性がある。買い手が回復すれば、0.00002350ドルの抵抗水準を試す可能性がある。


 crypto.ro English
 DogeHome
 Crypto News Land
 ETHNews
 CFN
CFN U_Today
 Thecoinrepublic.com
 Optimisus


