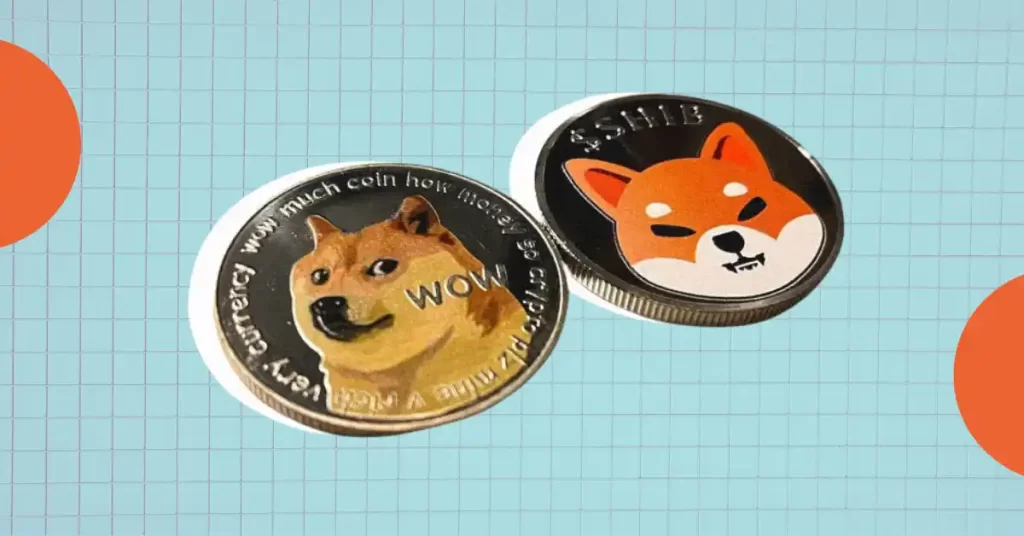
As Crypto Market Soars, Will DOGE and SHIB Tokens Lead the Memecoin Rally?
随着加密货币市场的飙升,DOGE 和 SHIB 代币会引领 Memecoin 反弹吗?
Following a recent price surge, Bitcoin has regained momentum, pushing past $63,000. This has sparked an uptick in the memecoin sector, leading to a bullish reversal.
继近期价格飙升后,比特币重新获得动力,突破 63,000 美元。这引发了模因币行业的上涨,导致看涨逆转。
However, the top two memecoins, Dogecoin (DOGE) and Shiba Inu (SHIB), have recently experienced a sell-off, losing most of their recent gains. Both are now approaching key support levels.
然而,排名前两位的模因币,狗狗币(DOGE)和柴犬(SHIB)最近经历了抛售,失去了近期的大部分涨幅。两者现在都接近关键支撑位。
With the growing bullish sentiment in the cryptocurrency market, it remains to be seen whether DOGE and SHIB can rebound and lead the next memecoin rally.
随着加密货币市场看涨情绪不断增强,DOGE和SHIB能否反弹并引领下一次memecoin涨势还有待观察。
Dogecoin (DOGE) Market Analysis
狗狗币(DOGE)市场分析
DOGE has corrected by approximately 3% in the past 24 hours. Over the past 30 days, it has lost 22.70%.
DOGE 在过去 24 小时内修正了约 3%。过去30天,它已经下跌了22.70%。
Technical indicators suggest a neutral trend for DOGE, with the Relative Strength Index (RSI) hovering below the midpoint.
技术指标显示 DOGE 呈中性趋势,相对强弱指数 (RSI) 徘徊在中点下方。
If buyers push DOGE above the resistance level of $0.12730, it could regain bullish momentum and test its triangle pattern resistance trendline. Success at this level could lead to a further rise towards $0.15575.
如果买家推动 DOGE 突破 0.12730 美元的阻力位,它可能会重新获得看涨势头并测试其三角形阻力趋势线。成功达到这一水平可能会导致进一步上涨至 0.15575 美元。
Conversely, if sellers break below the support trendline, DOGE could fall to $0.1010 and potentially $0.0740, its yearly low.
相反,如果卖家跌破支撑趋势线,DOGE 可能会跌至 0.1010 美元,甚至可能跌至 0.0740 美元,即年度低点。
Shiba Inu (SHIB) Market Analysis
柴犬 (SHIB) 市场分析
SHIB has declined by 1.32% in the past day, with a trading volume of $175.63 million. Over the past month, it has lost 31.01%.
SHIB过去一天下跌1.32%,交易量为1.7563亿美元。过去一个月,它已经下跌了31.01%。
The Simple Moving Average (SMA) acts as resistance for SHIB in the 1D timeframe. The Moving Average Convergence Divergence (MACD) indicator is mixed, with rising green bars but a neutral average.
简单移动平均线 (SMA) 在 1D 时间范围内充当 SHIB 的阻力。移动平均收敛背离 (MACD) 指标好坏参半,绿柱不断上升,但平均线呈中性。
If buying pressure fades, SHIB could break its crucial support level and fall to $0.0000175. If buyers recover, it could test its resistance level of $0.00002350.
如果购买压力消退,SHIB 可能会突破其关键支撑位并跌至 0.0000175 美元。如果买家恢复,可能会测试 0.00002350 美元的阻力位。


 DogeHome
 Crypto News Land
 ETHNews
 CFN
CFN U_Today
 Thecoinrepublic.com
 Optimisus
 Optimisus


