Markets are facing slight bear activity as seen from the global market cap’s drop as majority of tokens correct from yesterday’s pump. The total cap stood at $1.97T as of press time representing a 0.09% drop in the last 24 hours.
대부분의 토큰이 어제 상승세에서 조정되면서 글로벌 시가총액 하락에서 볼 수 있듯이 시장은 약간의 약세 활동에 직면해 있습니다. 보도 시간 현재 총 상한액은 1.97T 달러로 지난 24시간 동안 0.09% 하락했습니다.
Bitcoin Price Review
Analysing Bitcoin charts, we see the price is currently above the SuperTrend line, indicating a bullish trend. The Relative Strength Index (RSI) is around 54, which is neutral. This means that the market is not showing signs of being overbought or oversold.
비트코인 가격 검토비트코인 차트를 분석해 보면 가격이 현재 SuperTrend 선 위에 있어 강세 추세를 나타냅니다. 상대강도지수(RSI)는 약 54로 중립적입니다. 이는 시장이 과매수 또는 과매도 조짐을 보이지 않는다는 것을 의미합니다.
The Bitcoin price has been in an uptrend, as evidenced by the higher lows and higher highs. The trend might continue, but one should watch for any potential reversal patterns as the RSI moves closer to overbought or oversold levels. The Bitcoin price stood at $51.8K representing a 1% drop in the last 24 hours as of press time.
비트코인 가격은 저점과 고점이 높아지는 등 상승세를 보이고 있습니다. 추세는 계속될 수 있지만 RSI가 과매수 또는 과매도 수준에 가까워짐에 따라 잠재적인 반전 패턴을 관찰해야 합니다. 비트코인 가격은 보도 시간 기준으로 지난 24시간 동안 1% 하락한 51.8K 달러를 기록했습니다.
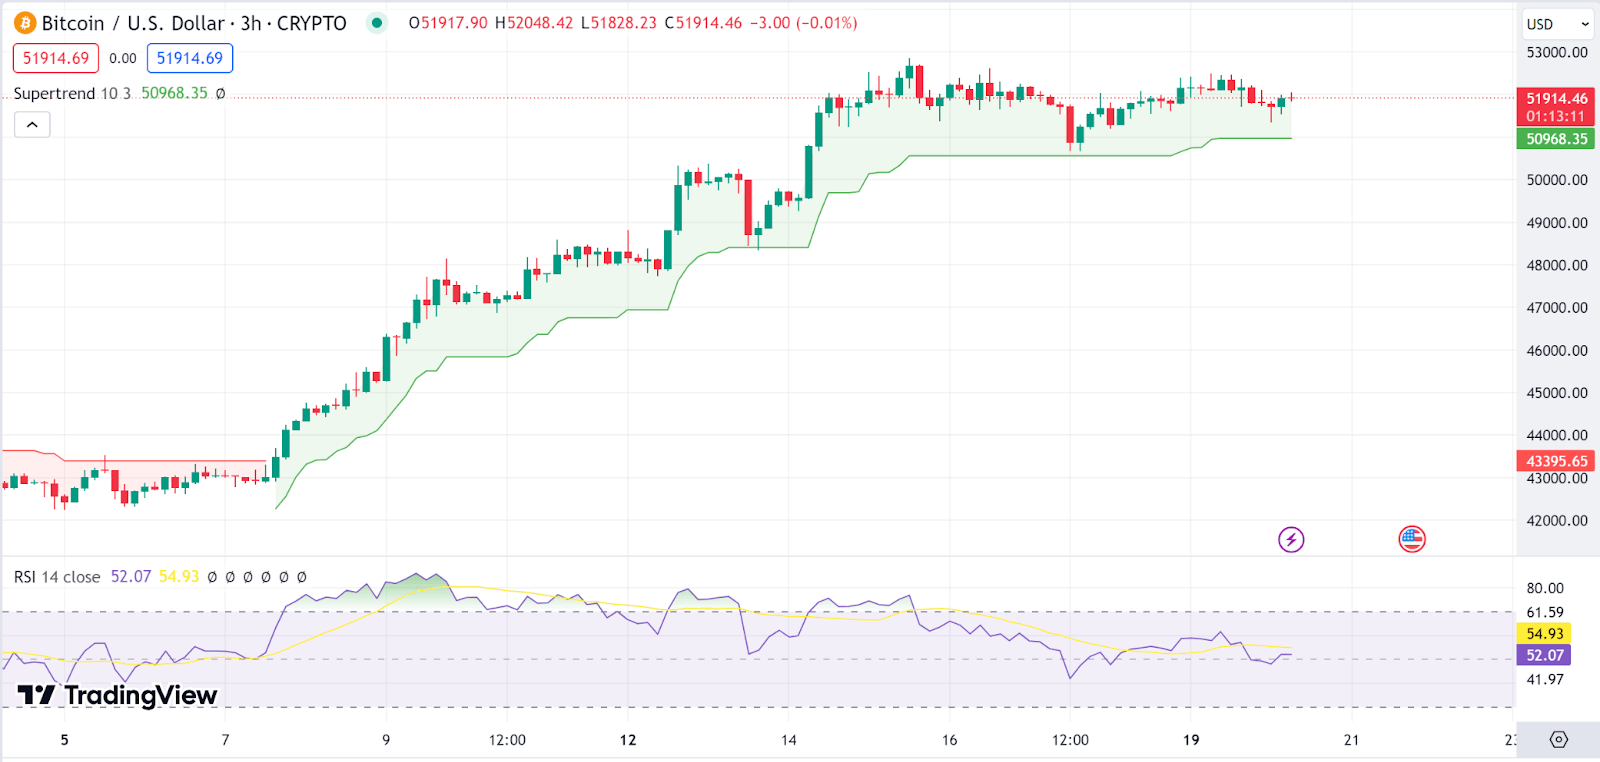 BTC 3-hour chart | Source: TradingView
BTC 3시간 차트 | 출처: TradingView
Ethereum Price Review
Ethereum price has also fallen pray to today’s downtrend as the Money Flow Index (MFI( is high at 73, suggesting that the market could be approaching overbought conditions. On the other hand, the Moving Average Convergence Divergence (MACD) line is above the signal line, indicating bullish momentum on the Ethereum price. However, the histogram shows a decrease in momentum as the bars are getting smaller.
Ethereum Price ReviewEthereum 가격도 Money Flow Index(MFI(가 73으로 높음)로 인해 오늘의 하락세로 떨어졌습니다. 이는 시장이 과매수 상태에 접근할 수 있음을 나타냅니다. 반면에 MACD(Moving Average Convergence Divergence) 선은 위에 있습니다. 신호선은 이더리움 가격의 강세 모멘텀을 나타냅니다. 그러나 히스토그램은 막대가 작아질수록 모멘텀이 감소하는 것을 보여줍니다.
Looking at price movement, we see the Ethereum price is also in an uptrend, with a recent pullback. The Ethereum price stood at $2,919 representing a 0.1% drop in the last 24 hours as of press time.
가격 움직임을 살펴보면 이더리움 가격도 최근 하락세를 보이며 상승세를 보이고 있는 것을 알 수 있습니다. 이더리움 가격은 보도 시간 기준으로 지난 24시간 동안 0.1% 하락한 2,919달러를 기록했습니다.
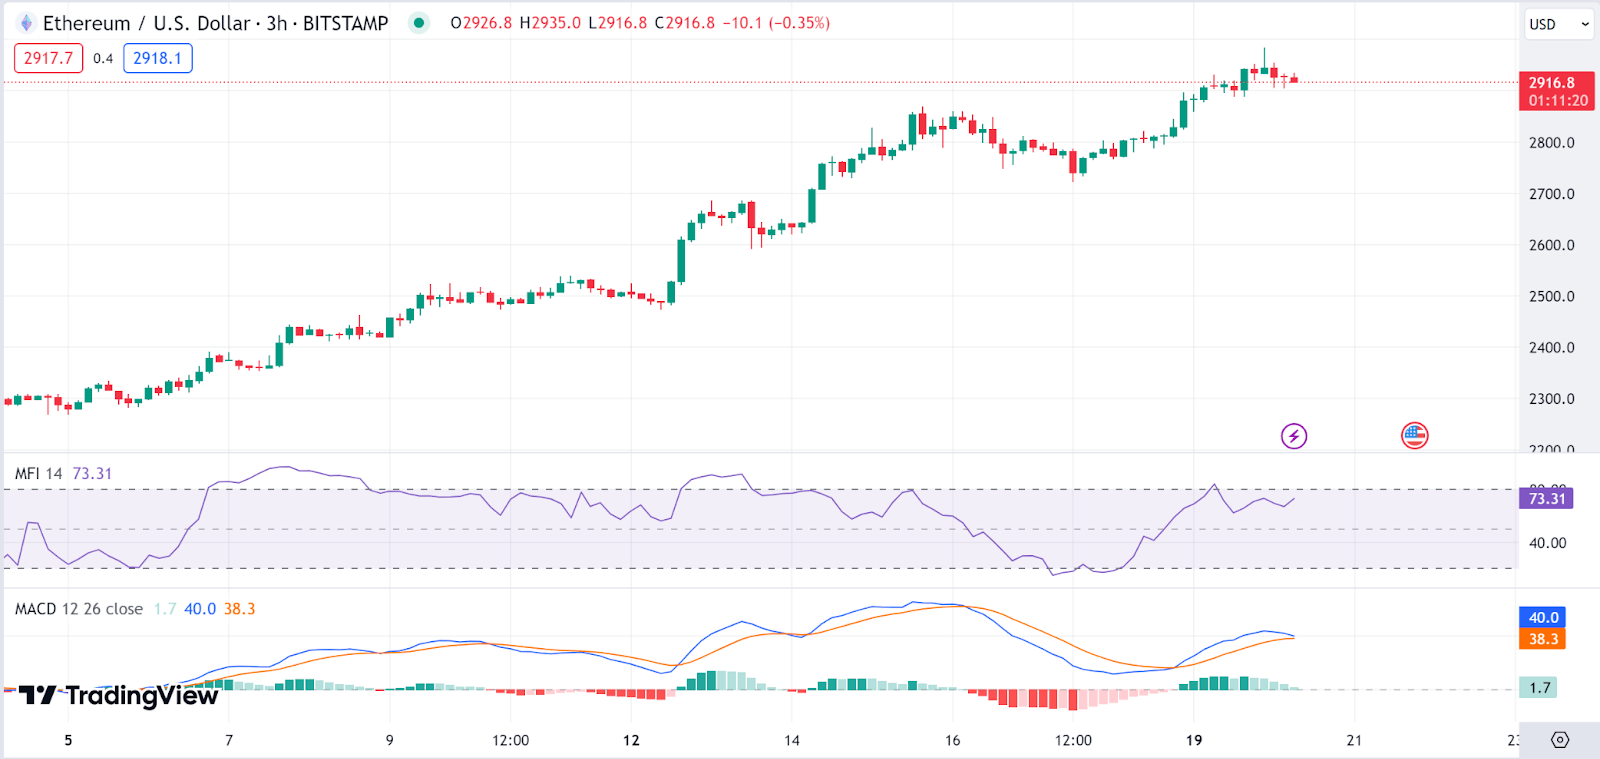 ETH 3-hour chart | Source: TradingView
ETH 3시간 차트 | 출처: TradingView
BNB Price Review
Despite the general downturn, BNB price has defied the odds to become one of the top gainers. The BNB price is trading near the upper band, indicating a strong upward momentum, but also a potential for a pullback if the price is considered overextended.
BNB 가격 검토 전반적인 경기 침체에도 불구하고 BNB 가격은 역경을 이겨내고 최고 상승세 중 하나가 되었습니다. BNB 가격은 상단 밴드 근처에서 거래되고 있어 강력한 상승 모멘텀을 나타내지만 가격이 과도하게 확장된 것으로 간주되면 하락할 가능성도 있습니다.
On the flip side, the Average Directional Index (ADX) value is 21.71, which suggests a moderate trend strength. It’s not particularly strong, but there is a definite trend. Despite the ADX indicating a moderate trend, suggesting that while there is momentum, it might not be excessively strong. The BNB price stood at $357.7 representing a 1% jump in the last 24 hours as of press time.
반면 평균 방향성 지수(ADX) 값은 21.71로 중간 정도의 추세 강도를 나타냅니다. 특별히 강하지는 않지만 확실한 추세가 있습니다. ADX가 적당한 추세를 나타내고 있음에도 불구하고 모멘텀이 있지만 지나치게 강하지 않을 수도 있음을 시사합니다. BNB 가격은 보도 시간 현재 지난 24시간 동안 1% 상승한 357.7달러를 기록했습니다.
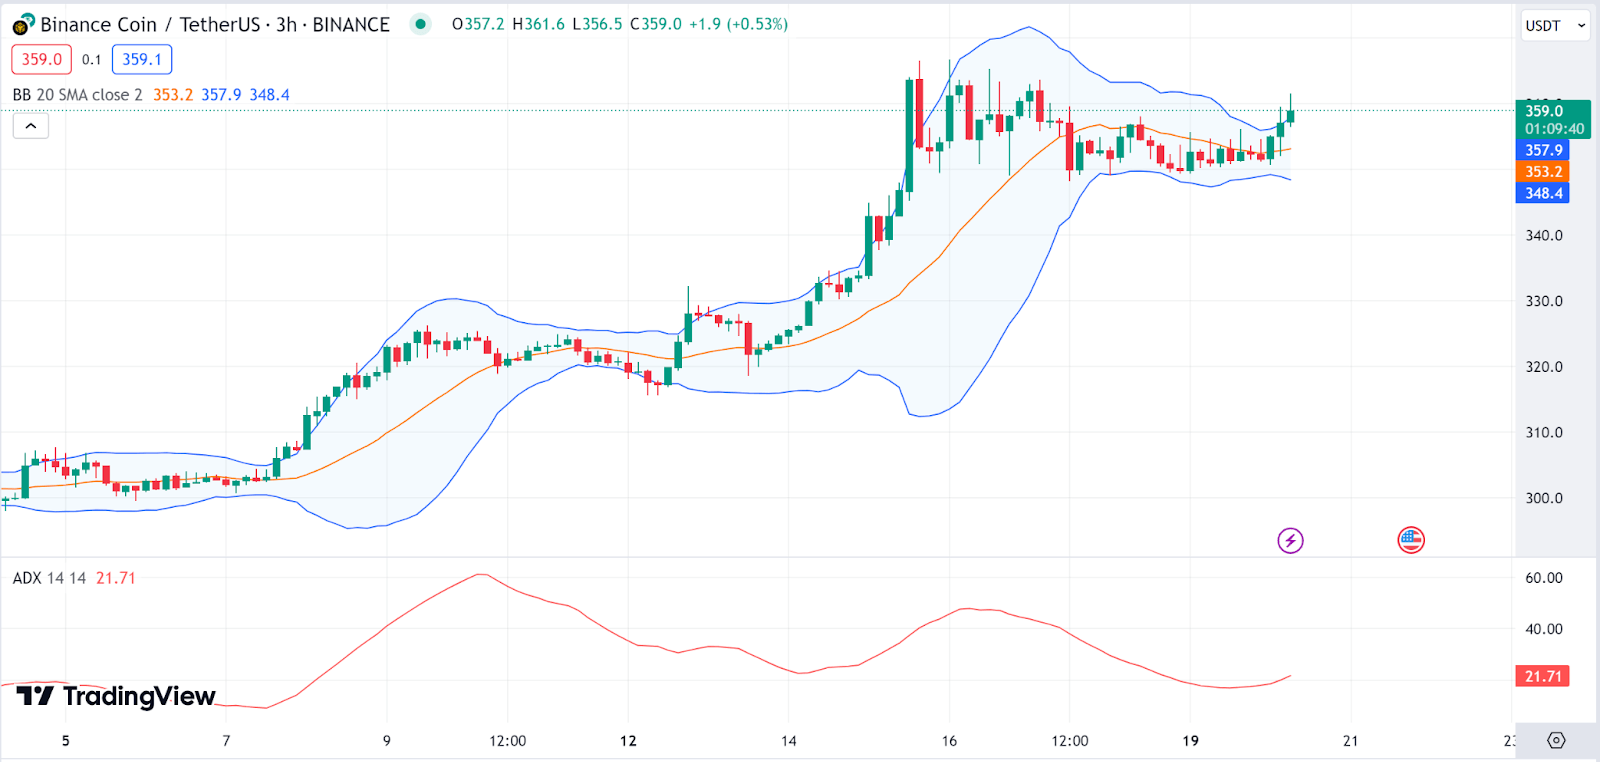 BNB 3-hour chart | Source: TradingView
BNB 3시간 차트 | 출처: TradingView
Ripple Price Review
Ripple (XRP) has also appeared aiming the few gainers today. The ripple price is trading within the upper half of the pitchfork, which indicates a bullish trend. Additionally, the ADX value is low at 15.10, suggesting the trend is weak.
Ripple Price ReviewRipple (XRP)도 오늘 소수의 상승세를 목표로 등장했습니다. 리플 가격은 갈퀴 상반부 내에서 거래되고 있어 강세 추세를 나타냅니다. 또한 ADX 값이 15.10으로 낮아 추세가 약함을 나타냅니다.
XRP’s current price action is moderately bullish within the context of the pitchfork, but the low ADX value indicates the trend isn’t very strong. This could imply that XRP may enter a consolidation phase or that the trend could easily reverse. The Ripple price stood at $0.566 representing a 0.6% jump in the last 24 hours as of press time.
XRP의 현재 가격 조치는 갈퀴 맥락에서 약간 강세이지만 ADX 값이 낮다는 것은 추세가 그다지 강하지 않음을 나타냅니다. 이는 XRP가 통합 단계에 진입하거나 추세가 쉽게 반전될 수 있음을 의미할 수 있습니다. 리플 가격은 보도 시간 기준으로 지난 24시간 동안 0.6% 상승한 0.566달러를 기록했습니다.
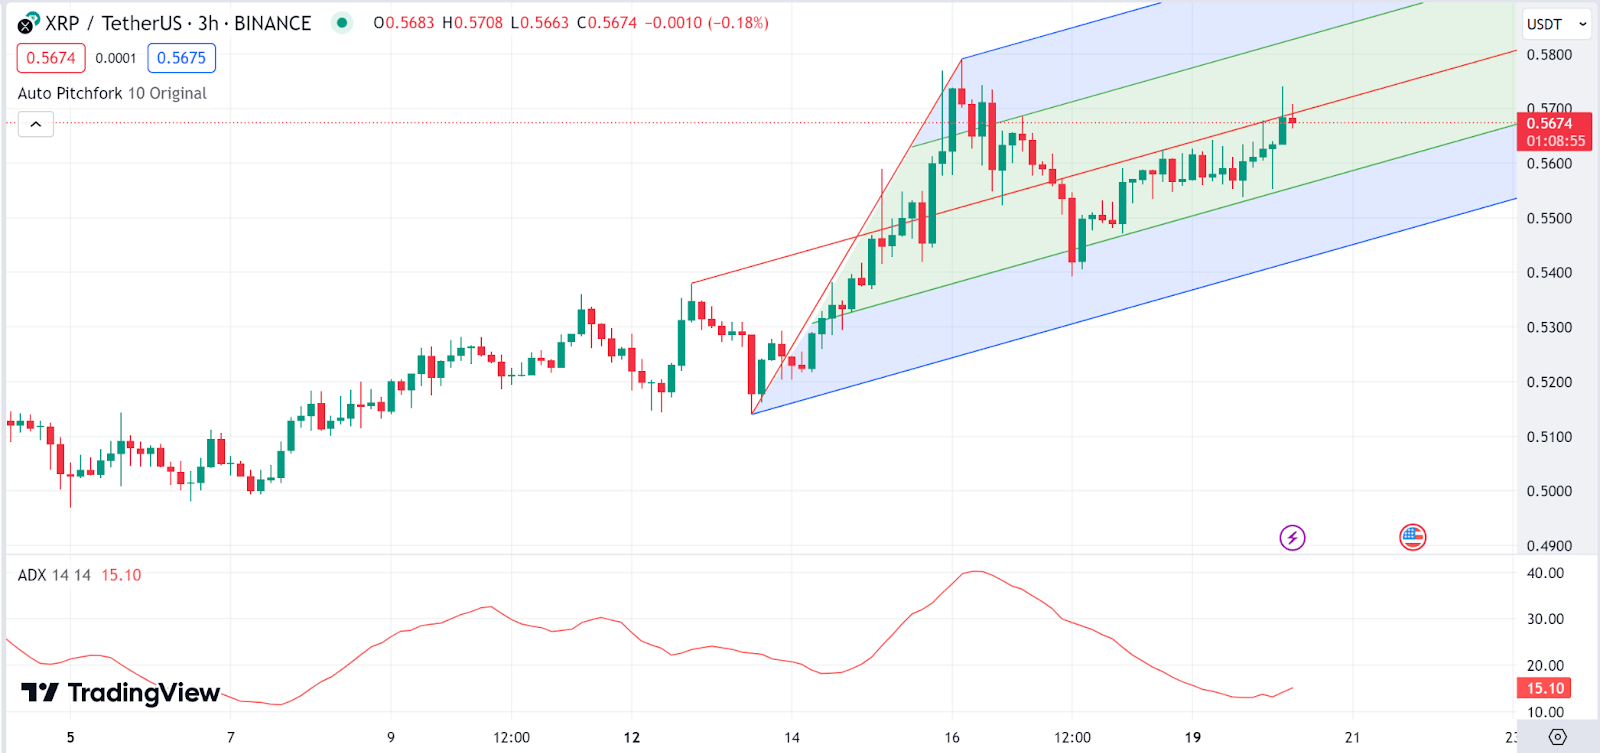 XRP 3-hour chart | Source: TradingView
XRP 3시간 차트 | 출처: TradingView
Dogecoin Price Review
Dogecoin (DOGE) is our last gainer in today’s bear market. The Dogecoin price is above the Alligator’s jaw (blue line), suggesting a bullish trend. On the flip side, the MACD line is above the signal line, and the histogram shows positive momentum.
Dogecoin 가격 검토Dogecoin(DOGE)은 오늘날 약세장에서 마지막으로 상승세를 보인 코인입니다. Dogecoin 가격은 악어 턱(파란색 선) 위에 있어 강세 추세를 나타냅니다. 반면 MACD 선은 신호선 위에 있고 히스토그램은 긍정적인 모멘텀을 보여줍니다.
The positive histogram on the MACD suggests growing momentum. The Dogecoin price stood at $0.08708 representing a 0.39% jump in the last 24 hours as of press time.
MACD의 긍정적인 히스토그램은 모멘텀이 커지고 있음을 나타냅니다. Dogecoin 가격은 보도 시간 기준으로 지난 24시간 동안 0.39% 상승한 0.08708달러를 기록했습니다.
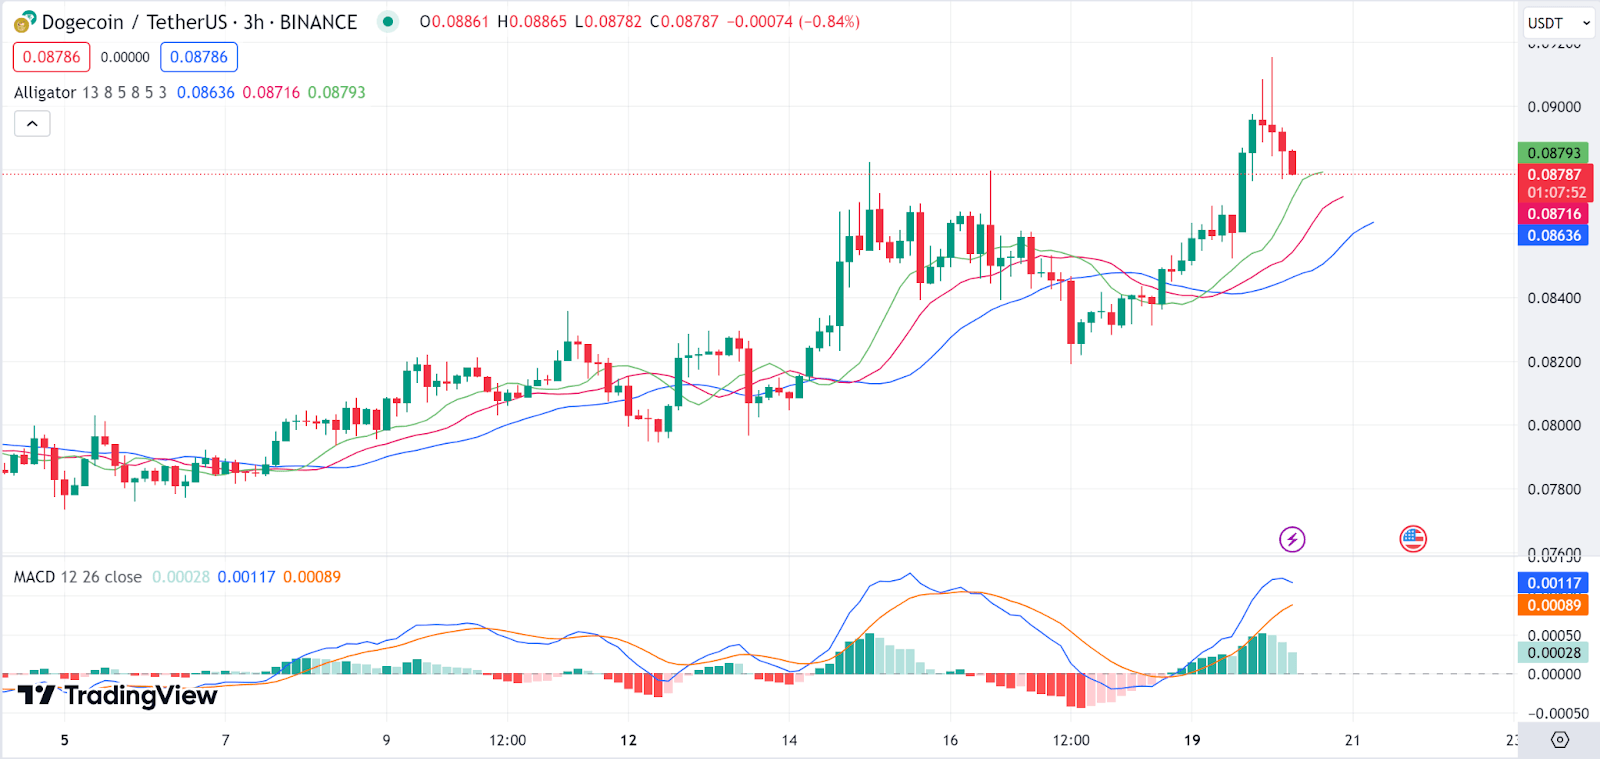 DOGE 3-hour chart | Source: TradingView
DOGE 3시간 차트 | 출처: TradingView


 TheNewsCrypto
 Optimisus
 DogeHome
 Crypto News Land
 Crypto News Land
 U_Today
 Coincu


