Markets are facing slight bear activity as seen from the global market cap’s drop as majority of tokens correct from yesterday’s pump. The total cap stood at $1.97T as of press time representing a 0.09% drop in the last 24 hours.
从全球市值下跌来看,市场正面临轻微的熊市活动,因为大多数代币都从昨天的上涨中调整过来。截至发稿时,总上限为 1.97T 美元,在过去 24 小时内下跌了 0.09%。
Bitcoin Price Review
Analysing Bitcoin charts, we see the price is currently above the SuperTrend line, indicating a bullish trend. The Relative Strength Index (RSI) is around 54, which is neutral. This means that the market is not showing signs of being overbought or oversold.
比特币价格回顾分析比特币图表,我们看到价格目前位于超级趋势线上方,表明看涨趋势。相对强弱指数(RSI)在54左右,属于中性。这意味着市场没有出现超买或超卖的迹象。
The Bitcoin price has been in an uptrend, as evidenced by the higher lows and higher highs. The trend might continue, but one should watch for any potential reversal patterns as the RSI moves closer to overbought or oversold levels. The Bitcoin price stood at $51.8K representing a 1% drop in the last 24 hours as of press time.
比特币价格一直处于上升趋势,最低点和高点更高就证明了这一点。这一趋势可能会持续下去,但随着 RSI 接近超买或超卖水平,人们应该留意任何潜在的反转模式。截至发稿时,比特币价格为 51.8K 美元,在过去 24 小时内下跌了 1%。
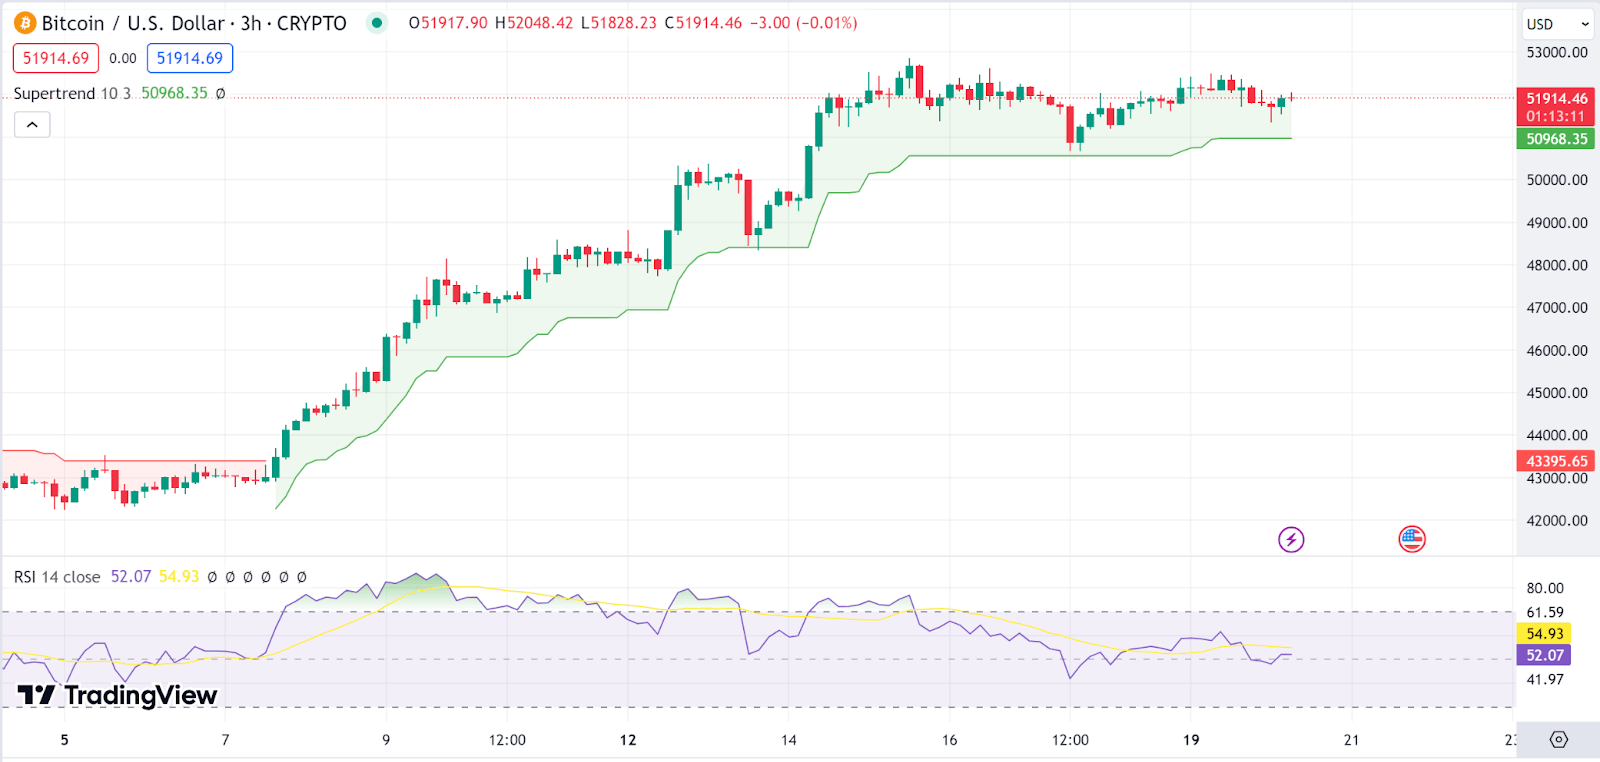 BTC 3-hour chart | Source: TradingView
BTC 3 小时图 |来源:TradingView
Ethereum Price Review
Ethereum price has also fallen pray to today’s downtrend as the Money Flow Index (MFI( is high at 73, suggesting that the market could be approaching overbought conditions. On the other hand, the Moving Average Convergence Divergence (MACD) line is above the signal line, indicating bullish momentum on the Ethereum price. However, the histogram shows a decrease in momentum as the bars are getting smaller.
以太坊价格回顾以太坊价格也因今天的下跌趋势而下跌,因为资金流量指数(MFI(高至 73,表明市场可能接近超买状况。另一方面,移动平均线收敛发散(MACD)线位于上方)信号线,表明以太坊价格看涨势头。然而,柱状图显示,随着柱形变小,动能也在减弱。
Looking at price movement, we see the Ethereum price is also in an uptrend, with a recent pullback. The Ethereum price stood at $2,919 representing a 0.1% drop in the last 24 hours as of press time.
从价格走势来看,我们看到以太坊价格也处于上升趋势,但最近有所回调。截至发稿,以太坊价格为 2,919 美元,在过去 24 小时内下跌了 0.1%。
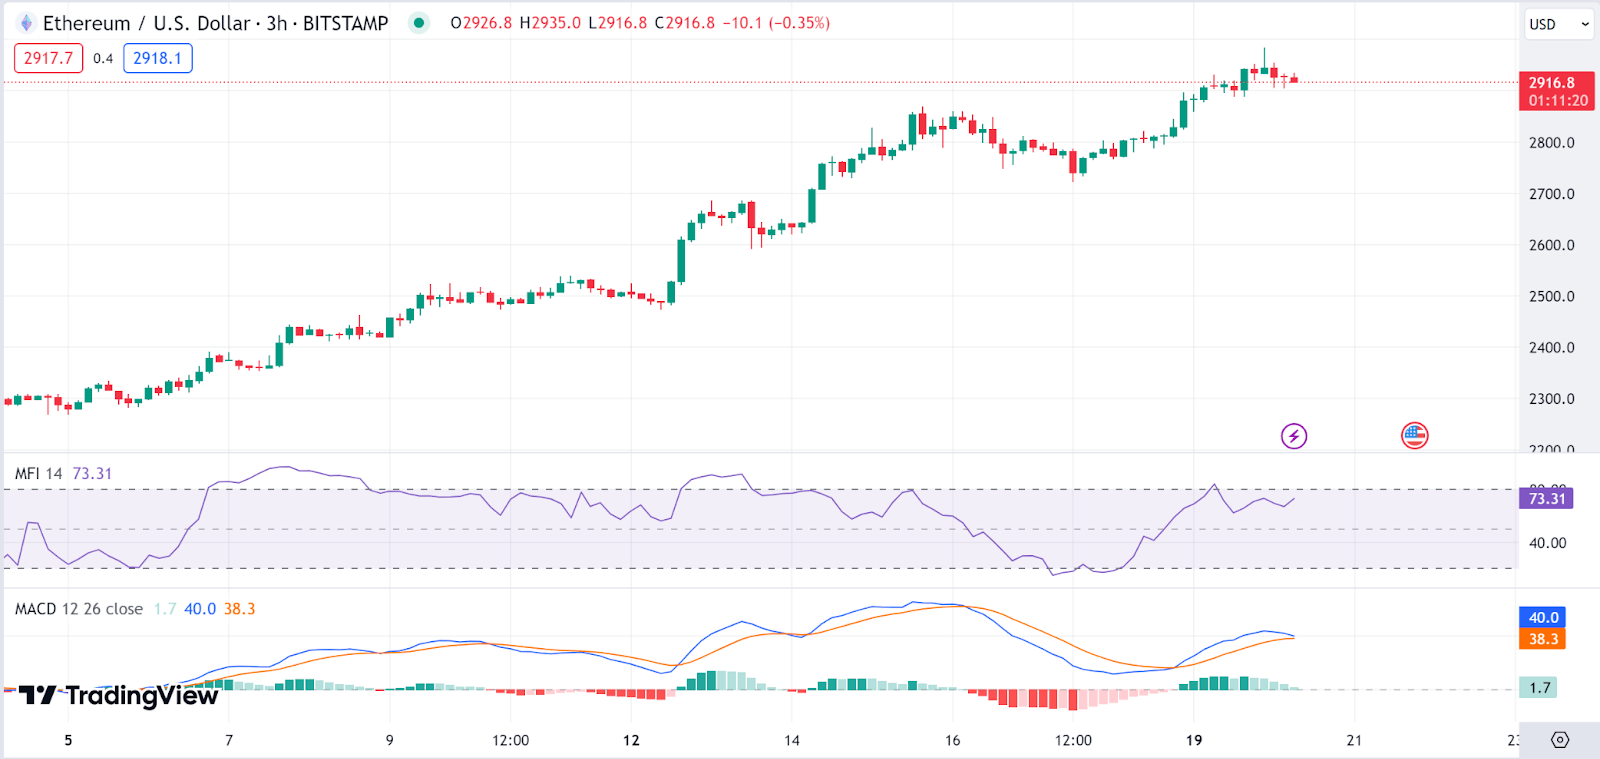 ETH 3-hour chart | Source: TradingView
ETH 3 小时图 |来源:TradingView
BNB Price Review
Despite the general downturn, BNB price has defied the odds to become one of the top gainers. The BNB price is trading near the upper band, indicating a strong upward momentum, but also a potential for a pullback if the price is considered overextended.
BNB价格回顾尽管整体低迷,但BNB价格却力排众议成为涨幅最大的股票之一。 BNB 价格交投于上限附近,表明上涨势头强劲,但如果价格被认为过度扩张,也有可能出现回调。
On the flip side, the Average Directional Index (ADX) value is 21.71, which suggests a moderate trend strength. It’s not particularly strong, but there is a definite trend. Despite the ADX indicating a moderate trend, suggesting that while there is momentum, it might not be excessively strong. The BNB price stood at $357.7 representing a 1% jump in the last 24 hours as of press time.
另一方面,平均方向指数 (ADX) 值为 21.71,这表明趋势强度适中。虽然不是特别强,但是有一定的趋势。尽管ADX显示出温和的趋势,表明虽然有动力,但可能不会太强。截至发稿,BNB 价格为 357.7 美元,在过去 24 小时内上涨了 1%。
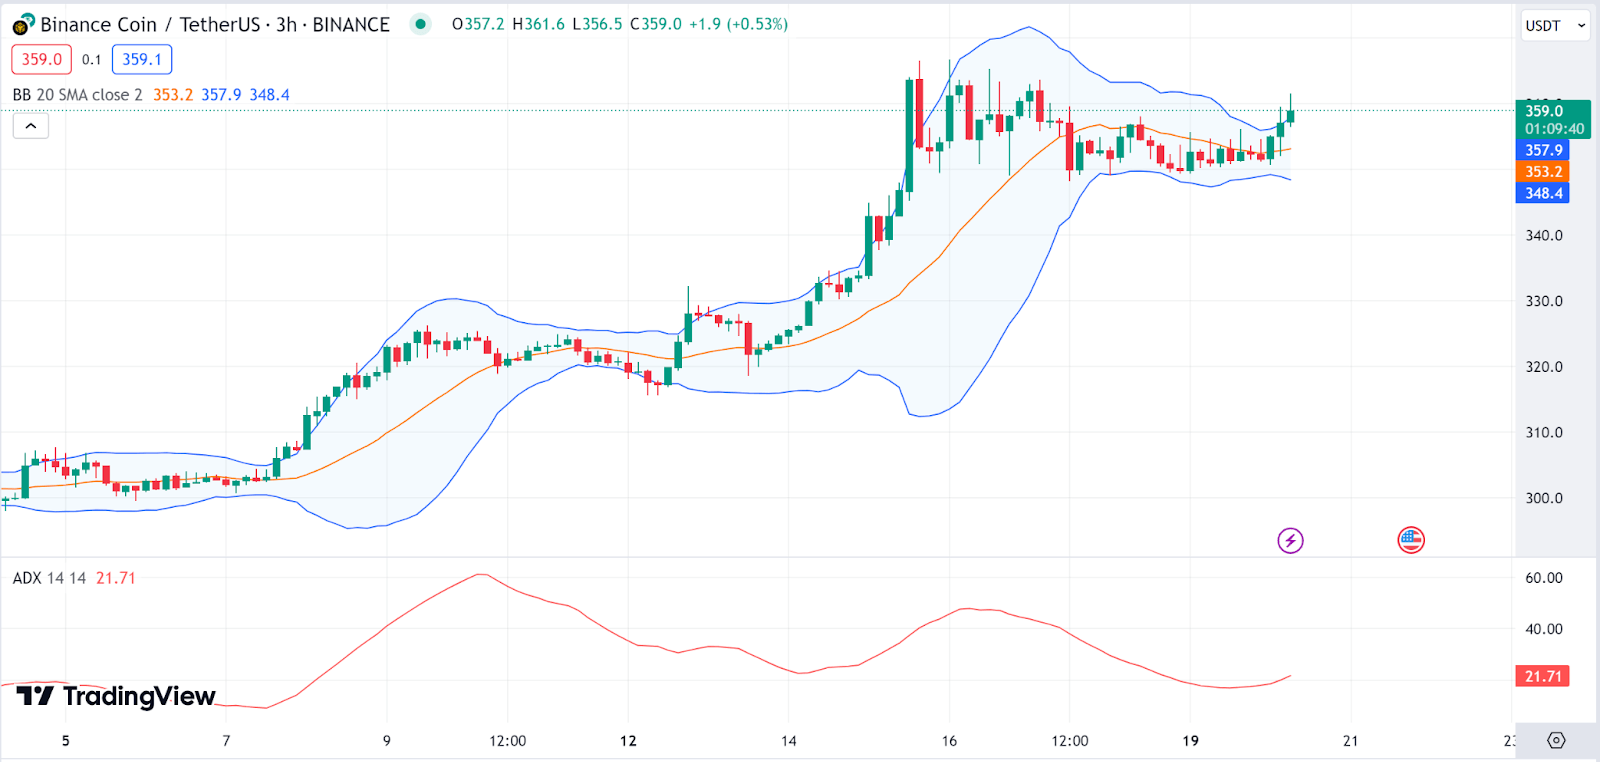 BNB 3-hour chart | Source: TradingView
BNB 3 小时图 |来源:TradingView
Ripple Price Review
Ripple (XRP) has also appeared aiming the few gainers today. The ripple price is trading within the upper half of the pitchfork, which indicates a bullish trend. Additionally, the ADX value is low at 15.10, suggesting the trend is weak.
瑞波币价格回顾瑞波币(XRP)今天似乎也瞄准了少数上涨者。波纹价格在干草叉的上半部分内交易,这表明看涨趋势。此外,ADX 值低至 15.10,表明趋势较弱。
XRP’s current price action is moderately bullish within the context of the pitchfork, but the low ADX value indicates the trend isn’t very strong. This could imply that XRP may enter a consolidation phase or that the trend could easily reverse. The Ripple price stood at $0.566 representing a 0.6% jump in the last 24 hours as of press time.
XRP 当前的价格走势在干草叉的背景下适度看涨,但较低的 ADX 值表明趋势不是很强。这可能意味着 XRP 可能进入盘整阶段,或者趋势可能很容易逆转。截至发稿时,Ripple 价格为 0.566 美元,在过去 24 小时内上涨了 0.6%。
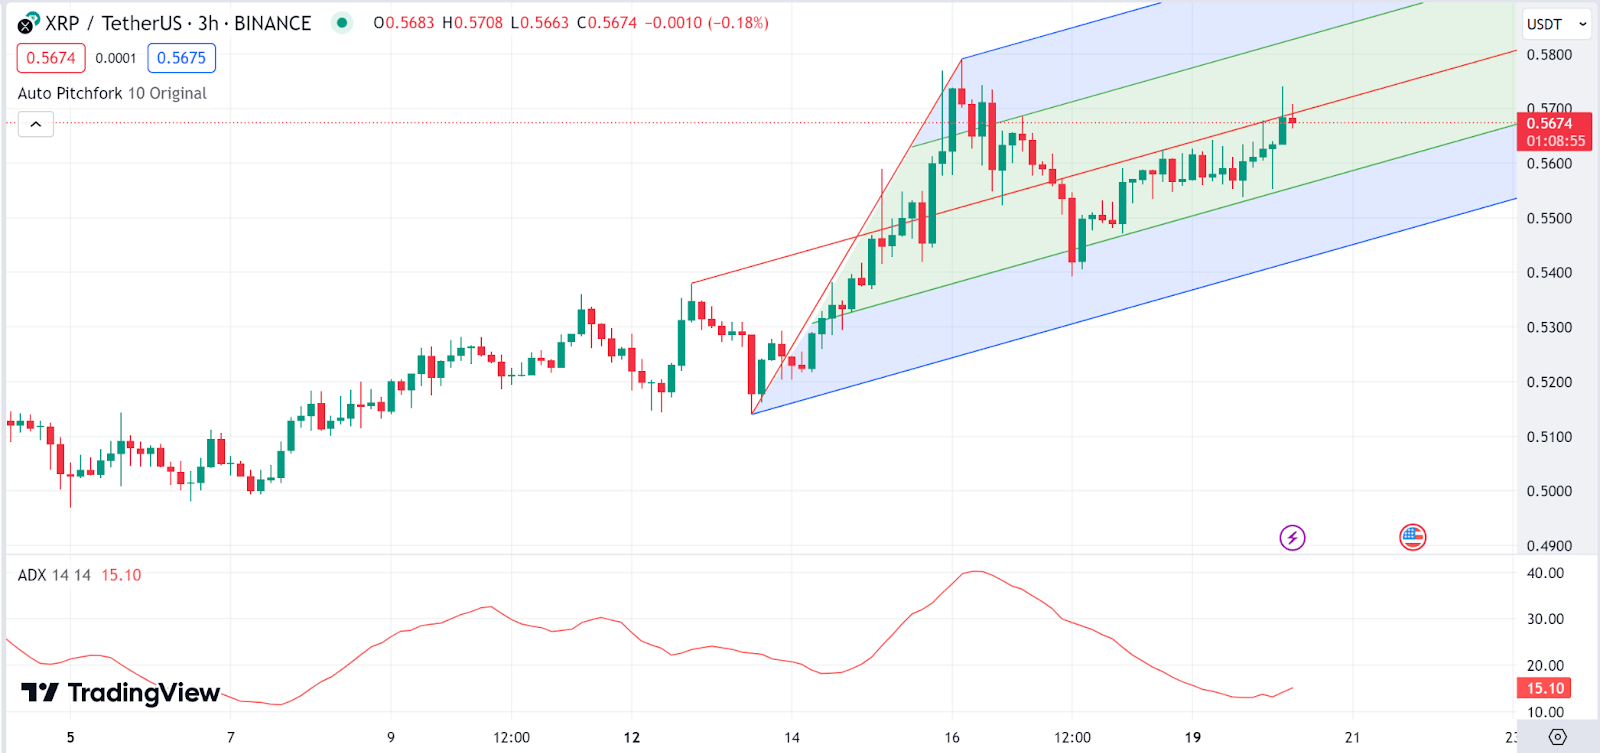 XRP 3-hour chart | Source: TradingView
XRP 3 小时图 |来源:TradingView
Dogecoin Price Review
Dogecoin (DOGE) is our last gainer in today’s bear market. The Dogecoin price is above the Alligator’s jaw (blue line), suggesting a bullish trend. On the flip side, the MACD line is above the signal line, and the histogram shows positive momentum.
狗狗币价格回顾狗狗币(DOGE)是我们今天熊市中的最后一个赢家。狗狗币价格高于鳄鱼下巴(蓝线),表明看涨趋势。另一方面,MACD 线位于信号线上方,柱状图显示出积极的势头。
The positive histogram on the MACD suggests growing momentum. The Dogecoin price stood at $0.08708 representing a 0.39% jump in the last 24 hours as of press time.
MACD 上的正柱状图表明势头正在增长。截至发稿时,狗狗币价格为 0.08708 美元,在过去 24 小时内上涨了 0.39%。
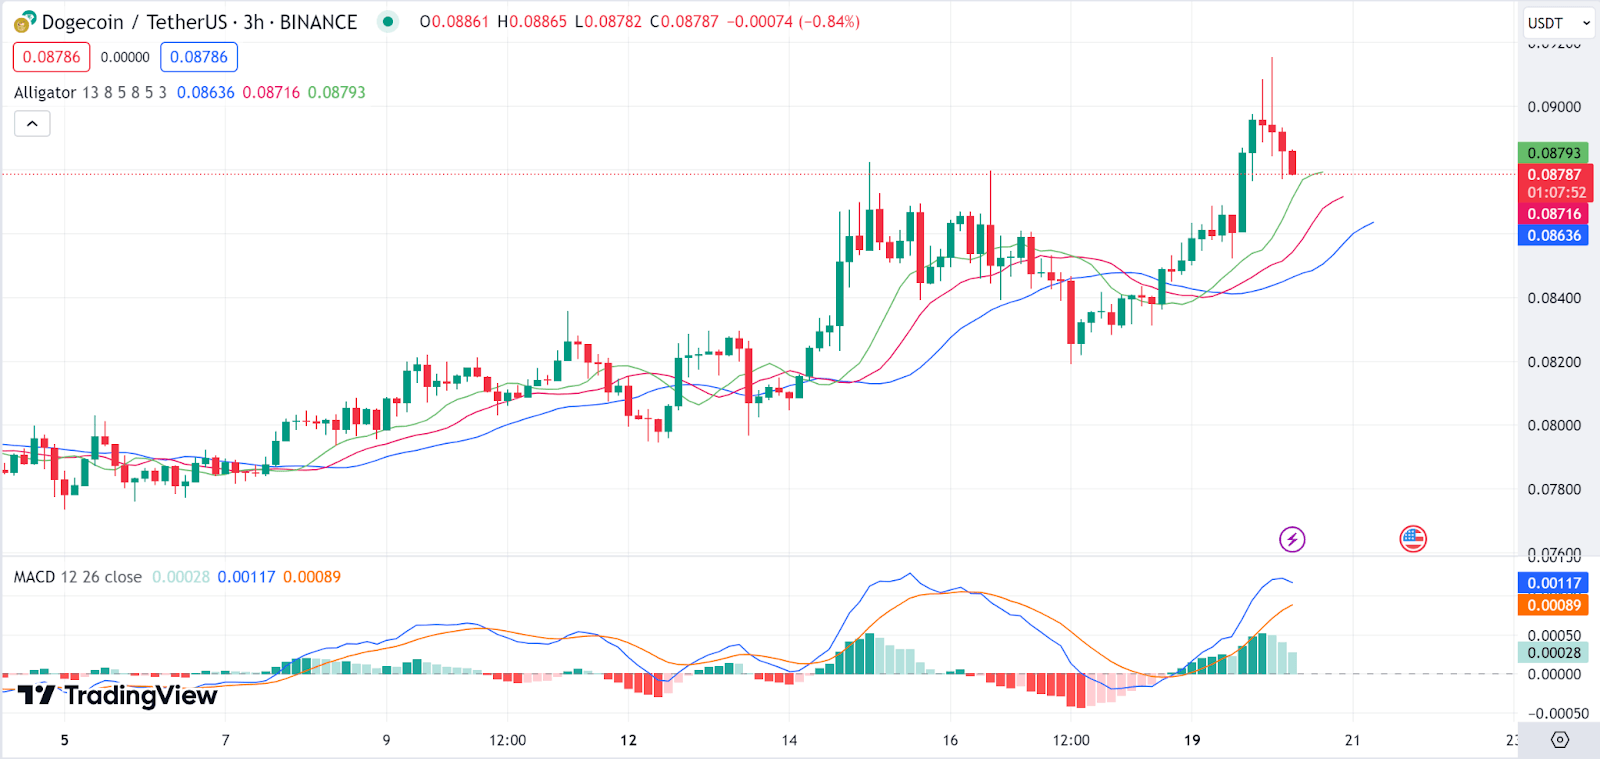 DOGE 3-hour chart | Source: TradingView
DOGE 3 小时图 |来源:TradingView


 Cryptopolitan_News
 Optimisus
 Crypto News Land
 DogeHome
 Crypto News Flash
 CoinsProbe
 CFN
CFN Cryptos Newss


